Review
. 2024 Nov;44(11):1191-1207.
doi: 10.1177/0271678X231210430. Epub 2023 Nov 7.

Static autoregulation in humans

Affiliations
Review

Static autoregulation in humans

Yufan Wang et al. J Cereb Blood Flow Metab. 2024 Nov.

Abstract

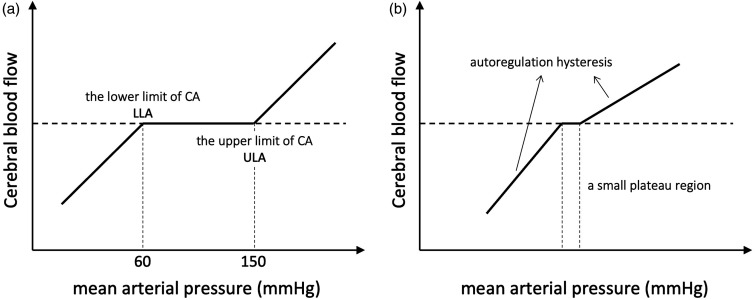
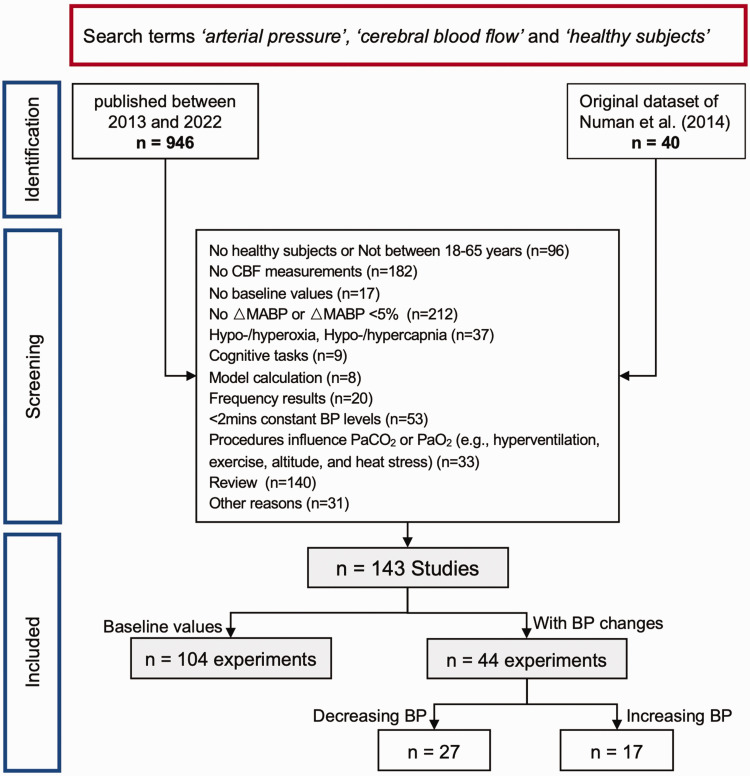
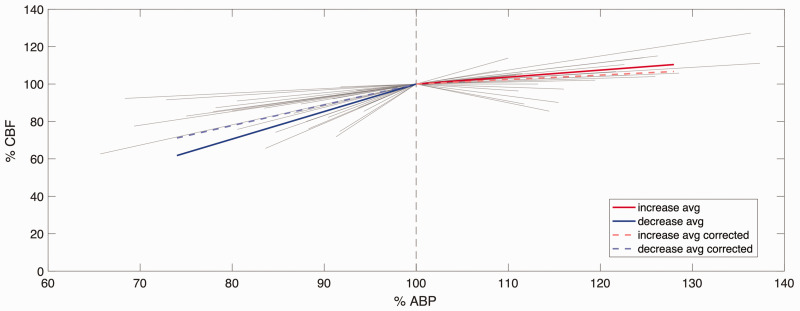
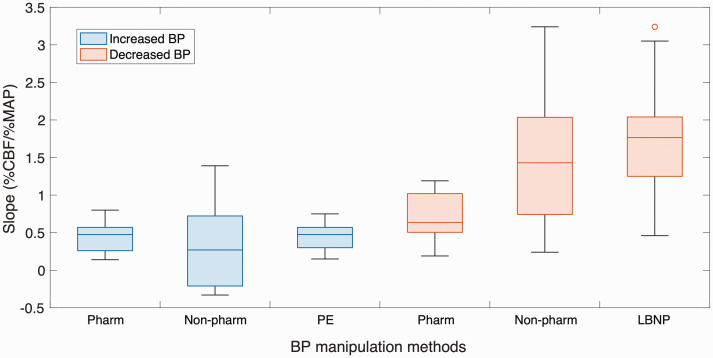
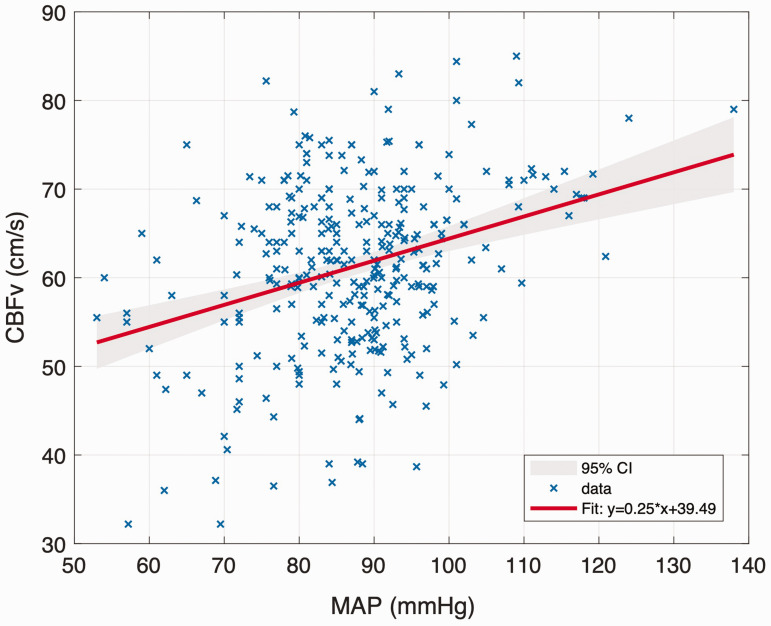
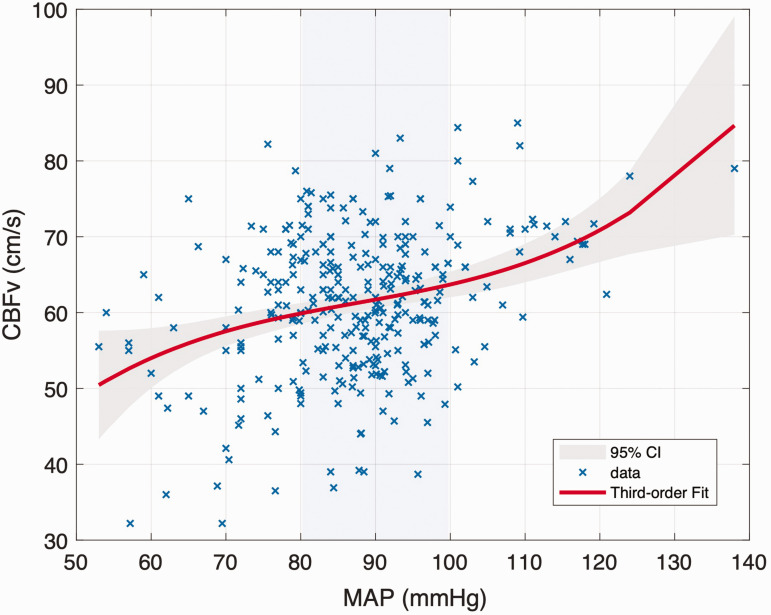
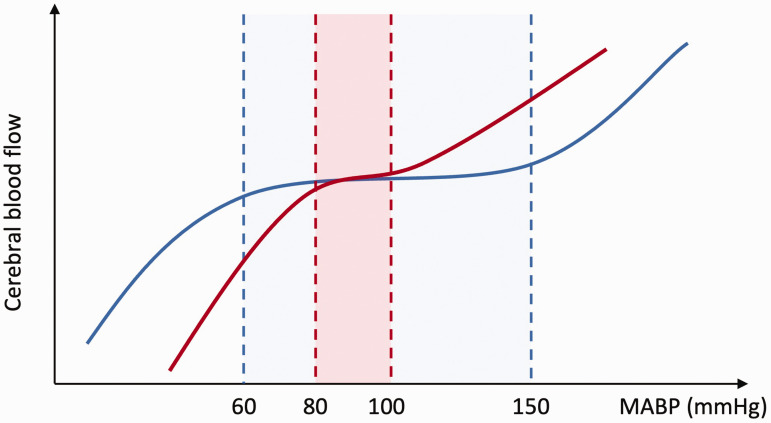
The process by which cerebral blood flow (CBF) remains approximately constant in response to short-term variations in arterial blood pressure (ABP) is known as cerebral autoregulation. This classic view, that it remains constant over a wide range of ABP, has however been challenged by a growing number of studies. To provide an updated understanding of the static cerebral pressure-flow relationship and to characterise the autoregulation curve more rigorously, we conducted a comprehensive literature research. Results were based on 143 studies in healthy individuals aged 18 to 65 years. The mean sensitivities of CBF to changes in ABP were found to be 1.47 ± 0.71%/% for decreased ABP and 0.37 ± 0.38%/% for increased ABP. The significant difference in CBF directional sensitivity suggests that cerebral autoregulation appears to be more effective in buffering increases in ABP than decreases in ABP. Regression analysis of absolute CBF and ABP identified an autoregulatory plateau of approximately 20 mmHg (ABP between 80 and 100 mmHg), which is much smaller than the widely accepted classical view. Age and sex were found to have no effect on autoregulation strength. This data-driven approach provides a quantitative method of analysing static autoregulation that can be easily updated as more experimental data become available.

Keywords: Cerebral autoregulation; arterial blood pressure; autoregulatory curve; cerebral blood flow; static autoregulation.


Conflict of interest statement

Declaration of conflicting interestsThe author(s) declared no potential conflicts of interest with respect to the research, authorship, and/or publication of this article.

Figures

Figure 1.
Figure 1.
(a) Classical view of autoregulation, first proposed by Lassen. It should be noted that the ULA was only demonstrated later in hypercapnic dogs in 1971. (b) A typical contemporary view of autoregulation showing a small plateau region and the directional sensitivity of cerebral autoregulation.
Figure 2.
Figure 2.
Flow chart of excluding procedure.
Figure 3.
Figure 3.
Relationship between %MAP and %CBF in the increased MAP and decreased MAP ranges. All individual lines represent individual experiments (not corrected for CO2); the length of the line indicates the range of MAP of that experiment. Before CO2 correction, average slope (solid line) was 1.47%MAP/%CBF for the decreased MAP (n = 27), and 0.35%MAP/%CBF for increased MAP (n = 17). After CO2 correction, the average slope (dashed line) was 1.11%MAP/%CBF for decreasing MAP (n = 18) and 0.24%MAP/%CBF for increasing MAP (n = 11).
Figure 4.
Figure 4.
Slope distribution of different blood pressure manipulation methods. Experiments inducing BP increase are represented by blue boxplots, while experiments inducing BP decrease are represented by orange boxplots. Non-pharm, non-pharmacological BP manipulation methods; Pharm, pharmacological BP manipulation methods; PE, phenylephrine; LBNP, lower body negative pressure.
Figure 5.
Figure 5.
First-order linear regression model for MAP and CBFv. The grey shading between these bounds reflects the 95% confidence level.
Figure 6.
Figure 6.
Third-order polynomial function regression model for MAP and CBFv. The grey shading between these bounds reflects the 95% confidence level. The blue shading between 80∼100 mmHg reflects the autoregulatory plateau.
Figure 7.
Figure 7.
Classical view and updated view of the cerebral autoregulation curve. The blue line and shaded area represent the autoregulation curve and plateau proposed by Lassen and Paulson et al. The red line and shaded area represent the new autoregulation curve and plateau proposed in this study, based on the dataset from Numan et al. and studies from 2013 to 2022. It should be noted that the new curve is asymmetric (with a lower slope for MAP > 100 mmHg than for MAP < 80 mmHg) and has a slight slope between the “autoregulation plateau” of MAP and CBF.

References

    1. Fog M. Cerebral circulation: the reaction of the pial arteries to a fall in blood pressure. Arch Neurpsych 1937; 37: 351–364.
    1. Lassen NA. Cerebral blood flow and oxygen consumption in man. Physiol Rev 1959; 39: 183–238. - PubMed
    1. Ekström-Jodal B, Häggendal E, Linder L-E, et al.. Cerebral blood flow autoregulation at high arterial pressures and different levels of carbon dioxide tension in dogs. ENE 1971; 6: 6–10. - PubMed
    1. Paulson O, Strandgaard S, Edvinsson L. Cerebral autoregulation. Cerebrovasc Brain Metab Rev 1990; 2: 161–192. - PubMed
    1. Strandgaard S, Olesen J, Skinhøj E, et al.. Autoregulation of brain circulation in severe arterial hypertension. Br Med J 1973; 1: 507–510. - PMC - PubMed

LinkOut - more resources