. 2024 Jan 12;14(1):142-157.
doi: 10.1158/2159-8290.CD-22-1319.

Disruption of SUV39H1-Mediated H3K9 Methylation Sustains CAR T-cell Function

Affiliations

Disruption of SUV39H1-Mediated H3K9 Methylation Sustains CAR T-cell Function

Nayan Jain et al. Cancer Discov. .

Abstract

Suboptimal functional persistence limits the efficacy of adoptive T-cell therapies. CD28-based chimeric antigen receptors (CAR) impart potent effector function to T cells but with a limited lifespan. We show here that the genetic disruption of SUV39H1, which encodes a histone-3, lysine-9 methyl-transferase, enhances the early expansion, long-term persistence, and overall antitumor efficacy of human CAR T cells in leukemia and prostate cancer models. Persisting SUV39H1-edited CAR T cells demonstrate improved expansion and tumor rejection upon multiple rechallenges. Transcriptional and genome accessibility profiling of repeatedly challenged CAR T cells shows improved expression and accessibility of memory transcription factors in SUV39H1-edited CAR T cells. SUV39H1 editing also reduces expression of inhibitory receptors and limits exhaustion in CAR T cells that have undergone multiple rechallenges. Our findings thus demonstrate the potential of epigenetic programming of CAR T cells to balance their function and persistence for improved adoptive cell therapies.

Significance: T cells engineered with CD28-based CARs possess robust effector function and antigen sensitivity but are hampered by limited persistence, which may result in tumor relapse. We report an epigenetic strategy involving disruption of the SUV39H1-mediated histone-silencing program that promotes the functional persistence of CD28-based CAR T cells. See related article by López-Cobo et al., p. 120. This article is featured in Selected Articles from This Issue, p. 5.


Conflict of interest statement

Author’s Disclosures

M.S. is a shareholder in Mnemo Therapeutics which holds license to patents on SUV39H1 inactivation. T.G. is an employee of Mnemo Therapeutics. All other authors declare no conflict of interest.

Authors’ Disclosure

The authors declare no competing interests.

Figures

Figure 1.
Figure 1.
SUV39H1 disruption reduces global H3K9me3 levels in T cells. A, Schematics of H3k9me3 FACS assay. B-C, gRNA editing efficiency (B) and indel distribution (C). D, Western blot showing SUV39H1 disruption at protein level. E, Representative H3K9me3 flow data for each time point. F, Summary of H3K9me3 flow data from two replicates per donor (2 donors). p values were determined by Mann-Whitney (F). p<0.05 was considered statistically significant. p values are denoted: p>0.05, not significant, NS; *, p<0.05; **, p< 0.01; ***, p<0.001.
Figure 2.
Figure 2.
SUV39H1 disruption enhances the anti-tumor efficacy of CAR T cells. A, Schematics of CAR T cell generation protocol and murine NALM6 model. B, Mice survival (left panel) and tumor radiance (right panel) under 1928z CAR T cell treatment dose: 2e5, n=5 for untreated, n=12 for WT (scrambled gRNA), and n=10 for SUV39H1-edited. Survival trends were confirmed in another donor. C, D, CAR T cell quantification (n=5, each dot represents a mouse) in the bone marrow at day 10 (C) and day 17 (D). E, Representative CAR T cell IL7R-α (left) and CD27 (right) flow cytometry plots at day 10 (top panel) and day 17 (bottom panel). F, G, Summary data for IL7R-α and CD27 flow cytometry plot replicates at day 10 (F) and day 17 (G). n=5 for both WT and SUV39H1-edited groups at day 10. n=4 for both WT and SUV39H1-edited groups at day 17. p values were determined by log-rank Mantel–Cox test (B) and Mann-Whitney (C, D, F & G). p<0.05 was considered statistically significant. p values are denoted: p>0.05, not significant, NS; *, p<0.05; **, p< 0.01; ***, p<0.001. The mouse illustration in part A was generated using Servier Medical Art, CC BY 3.0.
Figure 3.
Figure 3.
Single cell transcriptional profiling of CAR T cells. A, Design of single cell transcriptional profiling. Single cell RNA sequencing was performed at three time points: Pre-infusion (day 0), day 9, and day 16. Bone marrow was pooled together from 5 mice for each condition. CAR T cells were then sorted by flow cytometry. B, Uniform Manifold Approximation and Projection (UMAP) for all three time points (Top panel) and CD4’s and CD8’s (bottom panel). C, Marker expression for seurat clusters. D, GSEA analysis showing enrichment in proliferation associated pathways in SUV KO 1928z CAR T cells and effector function associated pathways in WT 1928z CAR T cells. E, Fraction of cycling cells at day 9. F, Gini index (inversely correlated with TCR diversity) over time (pre-infusion [Day 0], day 9 and day 16 in mice) of WT and SUV KO 1928z CAR T cells. The mouse illustration in part A was generated using Servier Medical Art, CC BY 3.0.
Figure 4.
Figure 4.
SUV39H1 disruption attenuates cytokine and granzyme B secretion upon repeated CAR stimulation. A, Schematics of repeated CAR stimulation assay. Cytokines were measured in the media 24 hours after co-culture with target cells at indicated time points. B, Cytokine quantification for unedited and SUV39H1-edited 1928z CAR T cells. IL2 was below detection limit at day 21 while TNF was below assay detection limit at both, day 14 and day 21. Data is represented as mean±SD, n=5. (B). The trends were confirmed in another donor. p values were determined by Mann-Whitney Test. p<0.05 was considered statistically significant. p values are denoted: p>0.05, not significant, NS; *, p<0.05; **, p< 0.01; ***, p<0.001.
Figure 5.
Figure 5.
SUV39H1 disruption improves metabolic fitness of CAR T cells under conditions of repeated stimulation. A, Schematics of repeated CAR stimulation assay. Oxygen consumption rate (OCR) and extracellular acidification rate (ECAR) were measured at indicated time points. B, C, OCR (B) and ECAR (C) rates of scrambled gRNA treated and SUV39H1-edited 1928z CAR T cells were assessed at the indicated time points. Data is represented as mean ± SD, n=4 or 5. (B, C). The trends were confirmed in 3 different donors. p values were calculated by unpaired t-test (B). p<0.05 was considered statistically significant. p values are denoted: p>0.05, not significant, NS; *, p<0.05; **, p< 0.01; ***, p<0.001, ****, p<0.0001.
Figure 6.
Figure 6.
SUV39H1 disruption enhances the ability of CAR T cells to reject tumor upon rechallenge. A, Design of the rechallenge study. Mice were treated with a CAR T cell dose of 2e5. Tumor rechallenge was done with 2e6 NALM6. B, Tumor radiance over time. Tumor rechallenge is indicated by arrowheads. n=10 for both groups. C, Comparing tumor radiance between unedited and SUV39H1-edited 1928z CAR T cells at day 51 (last tumor radiance measurement time point when all unedited 1928z CAR T cells are alive). D, E, CAR T cell quantification in bone marrow (D) and spleen (E) after 5 rounds of rechallenge. F, G, Representative CAR T cell CD27, PD1, LAG3, TIM3 flow cytometry plots at day 70 (F) and summary data for CD27 (left panel) and inhibitory receptor expression (right panel) at day 70 (G). Data is represented as mean ± SD (G). p values were determined by Mann-Whitney Test (CE & G). p values were corrected for multiple comparisons in G by BKY method. p values are denoted: p>0.05, not significant, NS; *, p<0.05; **, p< 0.01; ***, p<0.001, ****, p<0.0001. The mouse illustration in part A was generated using Servier Medical Art, CC BY 3.0.
Figure 7.
Figure 7.
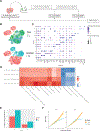
SUV39H1 disruption allows continued expression of memory transcription factors and limits expression of terminal effector transcription factors and inhibitory receptors. A, Design of the rechallenge study. Mice were treated with 2e5 1928z CAR T cells. Tumor rechallenge was done with 2e6 NALM6. Bone marrow was pooled together from 5 mice for each condition. CAR T cells were then sorted by flow cytometry. B, RNAseq heatmap of memory, effector, and inhibitory receptor genes. C, GSEA showing enrichment of human T cell exhaustion signature in unedited 1928z CAR T cells. D, Mean average plot (ATACseq). Red dots are peaks with padj<0.1. E, ATACseq heatmap, most significant peak associated with memory, effector, and inhibitory receptor genes is highlighted. F, Motif enrichment analysis identifies TCF1/LEF1 motif in genes down-regulated in SUV39H1-edited1928z CAR T cells. G, Graphical model summarizing the results. The mouse illustration in part A was generated using Servier Medical Art, CC BY 3.0. Graphical model in part G used elements generated in BioRender.

References

    1. Sadelain M, Riviere I, Riddell S. Therapeutic T cell engineering. Nature 2017;545(7655):423–31 doi 10.1038/nature22395. - DOI - PMC - PubMed
    1. June CH, Sadelain M. Chimeric Antigen Receptor Therapy. N Engl J Med 2018;379(1):64–73 doi 10.1056/NEJMra1706169. - DOI - PMC - PubMed
    1. Salter AI, Pont MJ, Riddell SR. Chimeric antigen receptor-modified T cells: CD19 and the road beyond. Blood 2018;131(24):2621–9 doi 10.1182/blood-2018-01-785840. - DOI - PMC - PubMed
    1. Park JH, Riviere I, Gonen M, Wang X, Senechal B, Curran KJ, et al. Long-Term Follow-up of CD19 CAR Therapy in Acute Lymphoblastic Leukemia. N Engl J Med 2018;378(5):449–59 doi 10.1056/NEJMoa1709919. - DOI - PMC - PubMed
    1. Maude SL, Laetsch TW, Buechner J, Rives S, Boyer M, Bittencourt H, et al. Tisagenlecleucel in Children and Young Adults with B-Cell Lymphoblastic Leukemia. N Engl J Med 2018;378(5):439–48 doi 10.1056/NEJMoa1709866. - DOI - PMC - PubMed

Publication types