. 2023 Nov 15;119(14):2469-2481.
doi: 10.1093/cvr/cvad141.

Contractility measurements for cardiotoxicity screening with ventricular myocardial slices of pigs

Affiliations

Contractility measurements for cardiotoxicity screening with ventricular myocardial slices of pigs

Runzhu Shi et al. Cardiovasc Res. .

Erratum in

Abstract

Aims: Cardiotoxicity is one major reason why drugs do not enter or are withdrawn from the market. Thus, approaches are required to predict cardiotoxicity with high specificity and sensitivity. Ideally, such methods should be performed within intact cardiac tissue with high relevance for humans and detect acute and chronic side effects on electrophysiological behaviour, contractility, and tissue structure in an unbiased manner. Herein, we evaluate healthy pig myocardial slices and biomimetic cultivation setups (BMCS) as a new cardiotoxicity screening approach.

Methods and results: Pig left ventricular samples were cut into slices and spanned into BMCS with continuous electrical pacing and online force recording. Automated stimulation protocols were established to determine the force-frequency relationship (FFR), frequency dependence of contraction duration, effective refractory period (ERP), and pacing threshold. Slices generated 1.3 ± 0.14 mN/mm2 force at 0.5 Hz electrical pacing and showed a positive FFR and a shortening of contraction duration with increasing pacing rates. Approximately 62% of slices were able to contract for at least 6 days while showing stable ERP, contraction duration-frequency relationship, and preserved cardiac structure confirmed by confocal imaging and X-ray diffraction analysis. We used specific blockers of the most important cardiac ion channels to determine which analysis parameters are influenced. To validate our approach, we tested five drug candidates selected from the Comprehensive in vitro Proarrhythmia Assay list as well as acetylsalicylic acid and DMSO as controls in a blinded manner in three independent laboratories. We were able to detect all arrhythmic drugs and their respective mode of action on cardiac tissue including inhibition of Na+, Ca2+, and hERG channels as well as Na+/Ca2+ exchanger.

Conclusion: We systematically evaluate this approach for cardiotoxicity screening, which is of high relevance for humans and can be upscaled to medium-throughput screening. Thus, our approach will improve the predictive value and efficiency of preclinical cardiotoxicity screening.

Keywords: Cardiac arrhythmia; Cardiotoxicity; Drug-induced long QT syndrome; Screening; Ventricular slices.


Conflict of interest statement

Conflict of interest: A.D. and Th.S. are shareholders of InVitroSys GmbH. There are no other remaining competing interests.

Figures

Figure 1
Figure 1
Acute properties of pig ventricular slices. (A) Confocal image of a ventricular slice directly after cutting. Nuclei shown in blue, WGA in green, and bar equals 20 µm. (B–D) Representative twitch contractions (B) and force amplitudes of individual slices (red, grey, and green) and aggregated data (C, black, N = 5, n = 59) as well as individual (red, grey, and green) and mean contraction duration (D, black, N = 5, n = 59) during electrical stimulation with the indicated frequencies. (E) Representative force traces of pacing at 0.5 Hz with decreasing electrical current amplitude (3 ms biphasic, 0.5 Hz). (F) Representative force traces for analysis of ERP with a S1S2 protocol. Note the failure of the S2 stimulus in the end. S1 stimuli are depicted as blue dots and S2 stimuli as red dots.
Figure 2
Figure 2
Effects of lidocaine (red, N = 2, n = 5), a specific blocker of Nav1.5 channels. (A) Representative twitch contractions before and after adding the indicated concentrations. (B) Aggregated data of the normalized pacing threshold in dependence of the concentration (red) compared to time-matched controls (black, N = 3, n = 8) with a two-way ANOVA with Sidak’s multiple comparison test. Slices, which could not be paced with the highest possible current (∼100 mA), are marked as red X. (C) Kaplan–Meier curve displaying the drop in percentage of slices that could be paced by electrical stimulation after applying the different concentrations (red) compared to time-matched controls (black, N = 3, n = 9) by a two-sided Fisher’s exact test. Exact n numbers and P values for each condition are given in Supplementary material online, Table S1, sheets I and II.
Figure 3
Figure 3
Effects of Bay K8644 (blue, N = 2, n = 5) and nifedipine (red, N = 1, n = 4), specific activator and blocker of Cav1.2 channels, respectively. (A, B) Representative force traces at 0.7 Hz pacing after applying the indicated concentrations of the L-type Ca2+ channel activator Bay K8644 (A) and blocker nifedipine (B). (C–F) Aggregated data of the influence of different concentrations on the normalized ERP (C), normalized contraction duration (D), normalized force at 0.7 Hz pacing (E), and the FFR (F) of Bay K8644 and nifedipine. Statistical comparison by a two-way ANOVA with Sidak’s multiple comparison test with time-matched controls (black, N = 3, n = 9). Exact N values and P values for each condition are given in Supplementary material online, Table S1, sheets I, III, and IV.
Figure 4
Figure 4
Effects of dofetilide (red, N = 2, n = 5), a specific blocker of hERG K+ channels. (A) Representative twitch contractions at 0.7 Hz electrical pacing after applying the indicated concentrations. (B–D) Aggregated data showing the effects of dofetilide on the normalized ERP (B) and the normalized contraction duration at different pacing frequencies (C) and at 0.7 Hz in dependence of the applied concentration (D). Exact N and P values for each condition are given in Supplementary material online, Table S1, sheets I and V. Statistical comparison by a two-way ANOVA with Sidak’s multiple comparison test with time-matched controls (black, N = 3, n = 9).
Figure 5
Figure 5
Effects of JNJ 303 (red, N = 4, n = 6), a specific blocker of KVLQT1 K+ channels. (A) Representative twitch contractions before and after applying D-sotalol and additionally JNJ 303 at the indicated concentrations at 0.7 Hz pacing rate. (B, C) Aggregated data of contraction duration at 0.3 Hz pacing rate (B) and the ERP (C). Statistical comparison by a two-way ANOVA and the Sidak’s multiple comparison test. Exact N and P values for each condition are given in Supplementary material online, Table S1, sheets VIa and VIb. Statistical comparison by a two-way ANOVA with Sidak’s multiple comparison test with time-matched sotalol controls (black, N = 2, n = 6). (D) Force traces with arrhythmic extrabeats (marked by red arrow) after applying 10 µM sotalol and 0.3 µM JNJ 303.
Figure 6
Figure 6
Detection of late Na+ currents (late I  Na+). (A) Representative force traces before and directly after applying 100 µM moxifloxacin (MOX) or 100 nM dofetilide (DOF), after 12 h incubation and after addition of 10 µM ranolazine (RAN). (B) Aggregated data (control: N = 3, n = 5; DOF: N = 5, n = 8; MOX: N = 4, n = 7) of the relative ERP (normalized to before) 15 min after the first treatment (grey), 12 h after the treatment (pink), and after adding 10 µM RAN (blue). (C) Changes in ERP after addition of RAN in the respective groups (normalized to 12 h after treatment). Exact N and P values for each condition are given in Supplementary material online, Table S1, sheets IXa, IXb, and IXc. Statistical testing with a one-way ANOVA test and Tukey’s multiple comparison test [P (control vs. DOF) = 0.0003; P (DOF vs. MOX) = 0.0004; P (control vs. MOX) = 0.82].
Figure 7
Figure 7
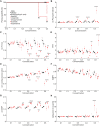
Screening test with drugs from CiPA list with known interactions and risks performed in three different laboratories (N = 3–5, n = 6–10). The effects of bepridil, cisapride, disopyramide, ibutilide, and risperidone (red) as well as negative controls DMSO and acetylsalicylic acid (black) were compared to time-matched controls treated only with PBS (grey). (A) Kaplan–Meier curve displaying the pacing capability of slices. Statistical analysis by Fisher’s exact test. (B–H) Mean and SEM of effects compared to PBS with a two-way ANOVA with Dunnett’s multiple comparison test on the normalized pacing threshold (B), normalized force (C), FFR (D), normalized contraction duration (E), CDFR (F), normalized ERP (G), and changes in diastolic force (H). Absolute values of each slice were normalized to values before adding the drug or solvent. Exact n and P values for each condition are given in Supplementary material online, Table S2.

References

    1. Mamoshina P, Rodriguez B, Bueno-Orovio A. Toward a broader view of mechanisms of drug cardiotoxicity. Cell Rep Med 2021;2:100216. - PMC - PubMed
    1. Li X, Zhang R, Zhao B, Lossin C, Cao Z. Cardiotoxicity screening: a review of rapid-throughput in vitro approaches. Arch Toxicol 2016;90:1803–1816. - PubMed
    1. Lam CK, Wu JC. Clinical trial in a dish: using patient-derived induced pluripotent stem cells to identify risks of drug-induced cardiotoxicity. Arterioscler Thromb Vasc Biol 2021;41:1019–1031. - PMC - PubMed
    1. Cubeddu LX. Drug-induced inhibition and trafficking disruption of ion channels: pathogenesis of QT abnormalities and drug-induced fatal arrhythmias. Curr Cardiol Rev 2016;12:141–154. - PMC - PubMed
    1. Roden DM. Predicting drug-induced QT prolongation and torsades de pointes. J Physiol 2016;594:2459–2468. - PMC - PubMed

Publication types