. 2023 Dec 15;83(24):4112-4129.
doi: 10.1158/0008-5472.CAN-23-2994.

TEAD Inhibition Overcomes YAP1/TAZ-Driven Primary and Acquired Resistance to KRASG12C Inhibitors

Affiliations

TEAD Inhibition Overcomes YAP1/TAZ-Driven Primary and Acquired Resistance to KRASG12C Inhibitors

A Cole Edwards et al. Cancer Res. .

Abstract

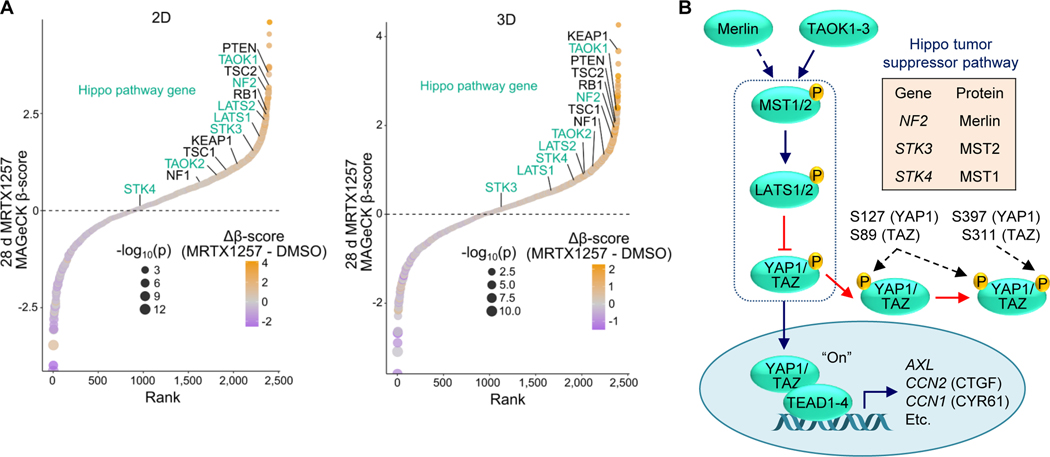
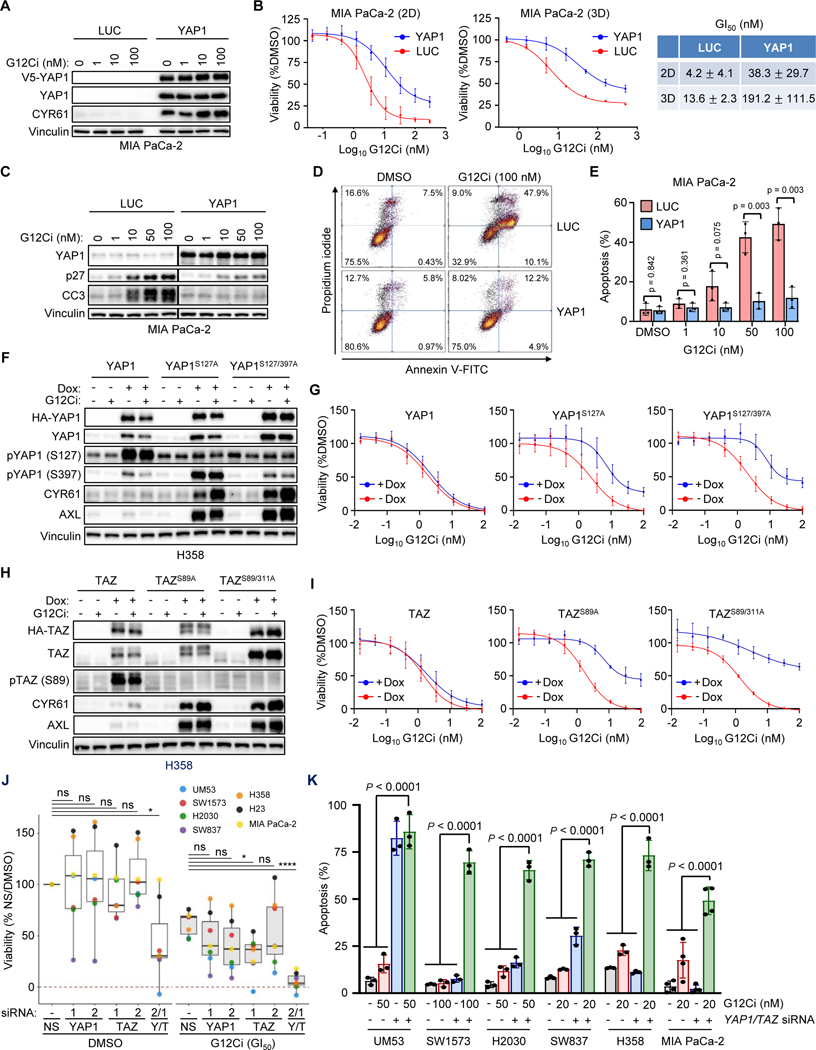
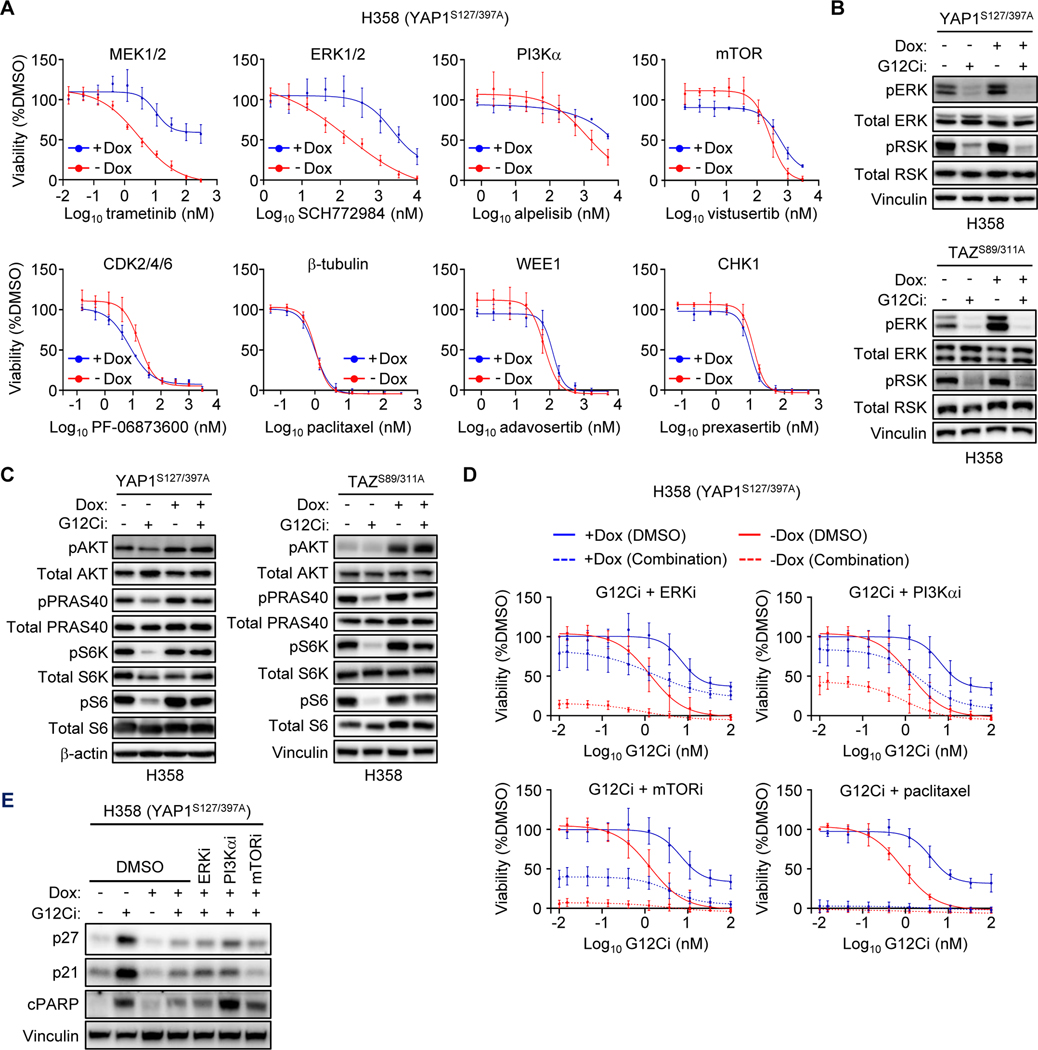
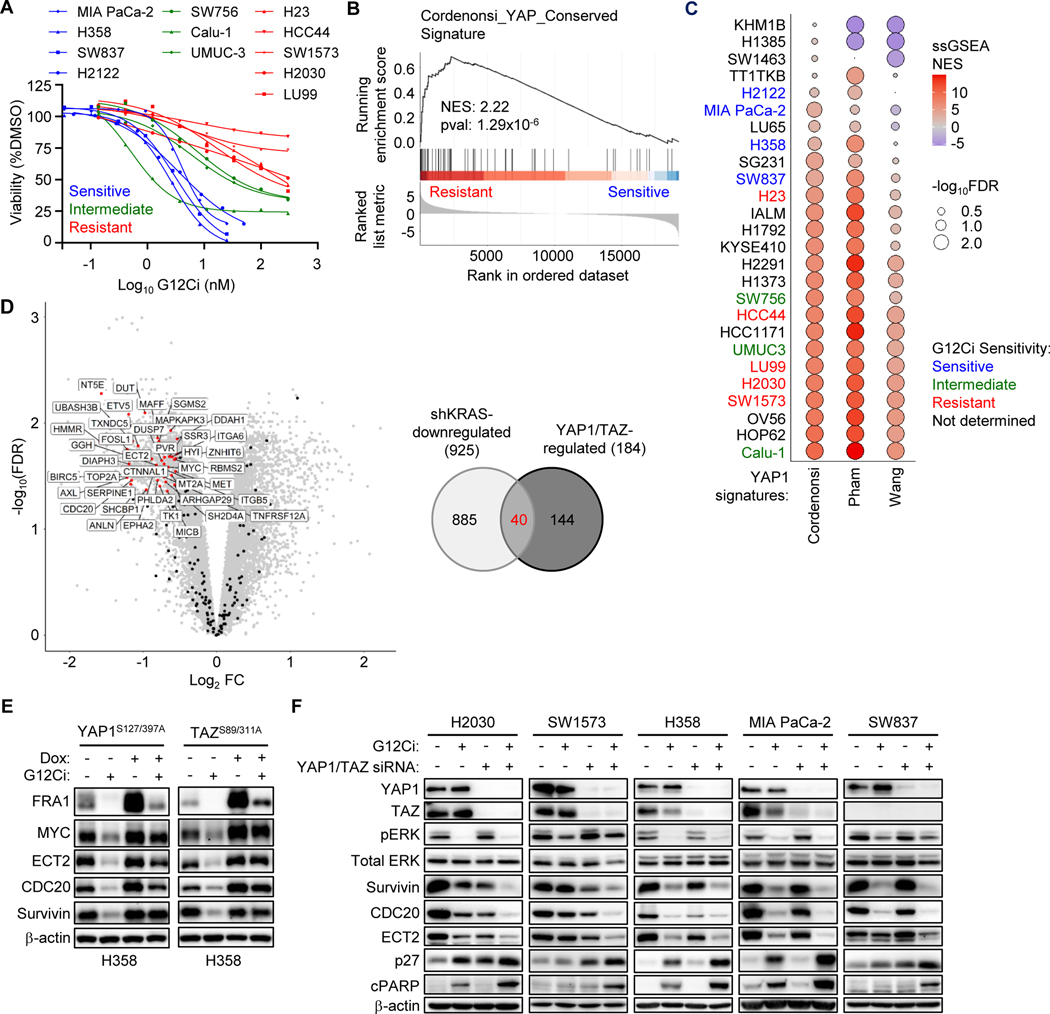
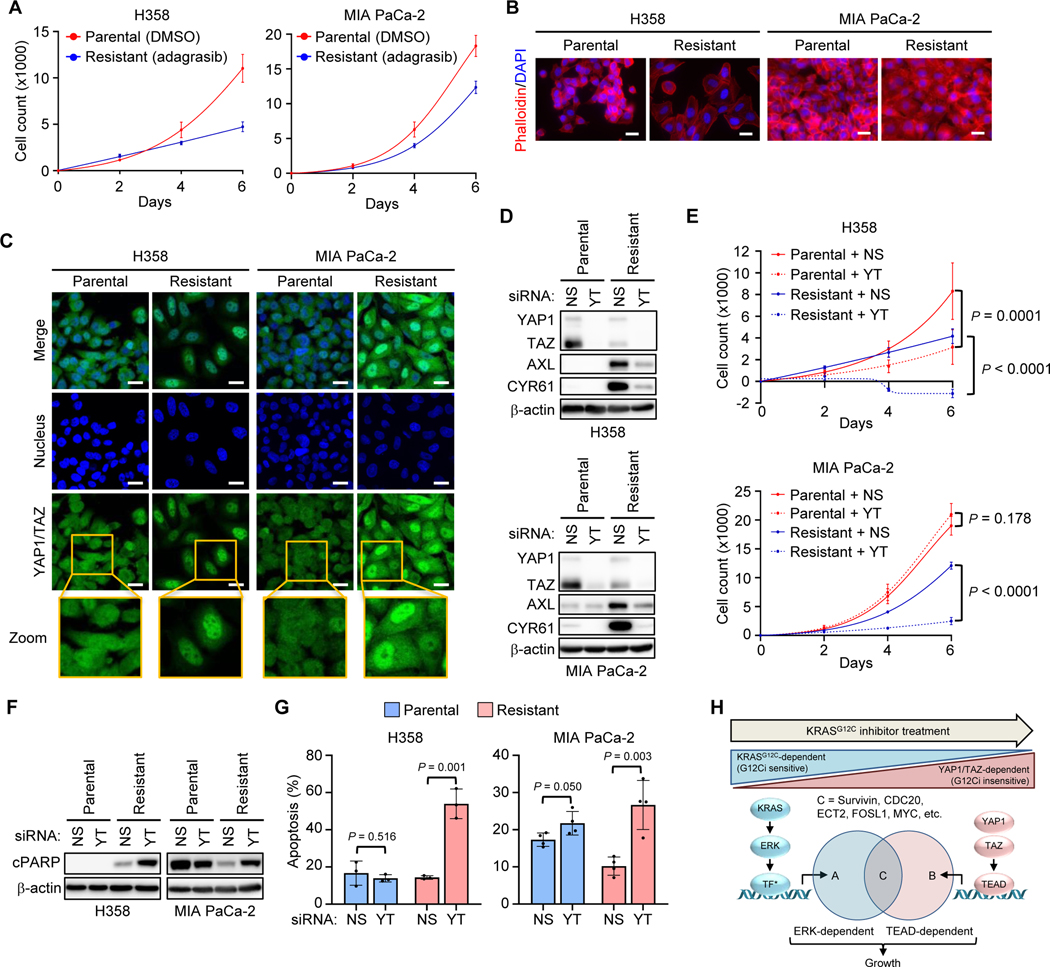
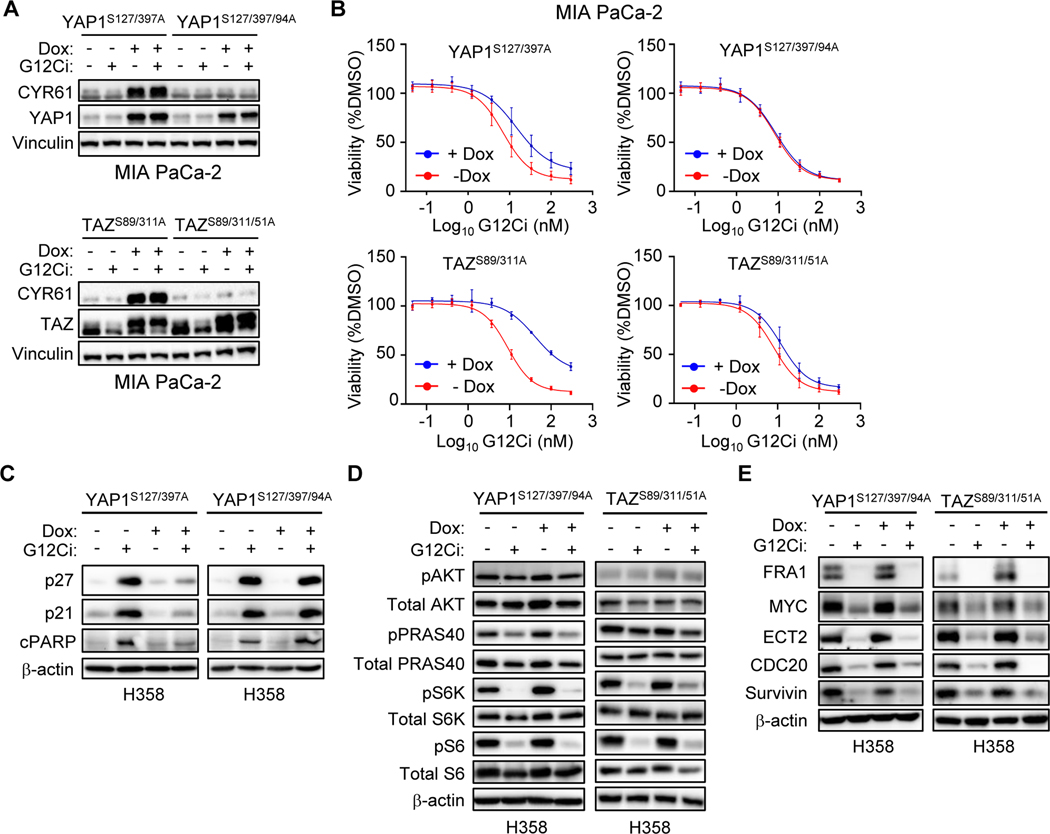
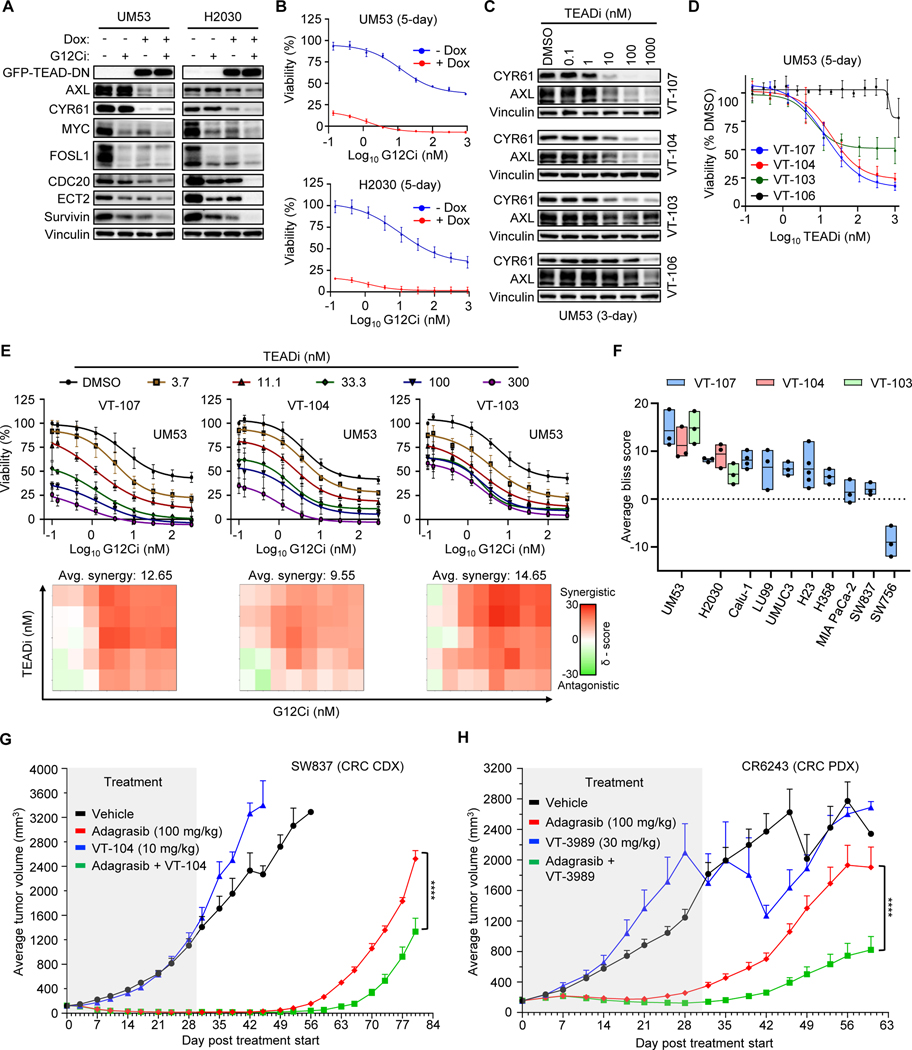
Primary/intrinsic and treatment-induced acquired resistance limit the initial response rate to and long-term efficacy of direct inhibitors of the KRASG12C mutant in cancer. To identify potential mechanisms of resistance, we applied a CRISPR/Cas9 loss-of-function screen and observed loss of multiple components of the Hippo tumor suppressor pathway, which acts to suppress YAP1/TAZ-regulated gene transcription. YAP1/TAZ activation impaired the antiproliferative and proapoptotic effects of KRASG12C inhibitor (G12Ci) treatment in KRASG12C-mutant cancer cell lines. Conversely, genetic suppression of YAP1/WWTR1 (TAZ) enhanced G12Ci sensitivity. YAP1/TAZ activity overcame KRAS dependency through two distinct TEAD transcription factor-dependent mechanisms, which phenocopy KRAS effector signaling. First, TEAD stimulated ERK-independent transcription of genes normally regulated by ERK (BIRC5, CDC20, ECT2, FOSL1, and MYC) to promote progression through the cell cycle. Second, TEAD caused activation of PI3K-AKT-mTOR signaling to overcome apoptosis. G12Ci treatment-induced acquired resistance was also caused by YAP1/TAZ-TEAD activation. Accordingly, concurrent treatment with pharmacologic inhibitors of TEAD synergistically enhanced KRASG12C inhibitor antitumor activity in vitro and prolonged tumor suppression in vivo. In summary, these observations reveal YAP1/TAZ-TEAD signaling as a crucial driver of primary and acquired resistance to KRAS inhibition and support the use of TEAD inhibitors to enhance the antitumor efficacy of KRAS-targeted therapies.

Significance: YAP1/TAZ-TEAD activation compensates for loss of KRAS effector signaling, establishing a mechanistic basis for concurrent inhibition of TEAD to enhance the efficacy of KRASG12C-selective inhibitor treatment of KRASG12C-mutant cancers. See related commentary by Johnson and Haigis, p. 4005.


Conflict of interest statement

Conflict of Interest

The other authors declare no competing interests.

Figures

Figure 1.
Figure 1.
CRISPR-Cas9 screen identifies loss of Hippo pathway components as mediators of G12Ci resistance. A, CRISPR/Cas9 loss-of-function screen performed in MIA PaCa-2 cells treated with the G12Ci, MRTX1257, and plated in 2D (left) or 3D (0.5% methylcellulose, right) for 28 days. Tumor suppressor genes previously identified in patients or preclinically are in black, while components of the Hippo pathway are in turquoise. Genes are ranked by relative enrichment/depletion (β-scores) in the G12Ci condition. Relative enrichment/depletion in G12Ci relative to DMSO condition (Δβ-scores) are also shown. B, Schematic of the Hippo tumor suppressor pathway, with key inhibitory LATS1/2-mediated phosphorylation sites on YAP1/TAZ denoted.
Figure 2.
Figure 2.
YAP1 and TAZ exhibit equivalent functions in driving resistance to pharmacologic inhibition of KRASG12C. A, Immunoblot of ectopic V5 epitope-tagged YAP1WT- and LUC-overexpressing MIA PaCa-2 cells following 24 hours of G12Ci treatment at indicated concentrations. B, Cell viability assay following five days of G12Ci treatment of cells as in A, grown in 2D (plastic, left) and 3D (Matrigel, right) conditions. Data represent the mean ± SD for 3+ (2D) and 2 (3D) independent biological replicates. G12Ci concentrations that reduce viability by 50% (GI50) are shown (right) as mean ± SD. C, Immunoblot of cells as in A. LUC and YAP1 immunoblots were run and imaged together, so all conditions can be directly compared. D, FACS gating strategy for 5-day apoptosis assay following G12Ci treatment (100 nM) of cells as in A. E, Quantification of 5-day apoptosis assay of cells as in A across indicated G12Ci concentrations. Mean ± SD is shown for n = three biological replicates; two-tailed unpaired t-test. F-I, YAP1/TAZ overexpression was induced by Dox (1 μg/mL) 24 hours prior to the indicated treatment. F, Immunoblot of H358 cells overexpressing YAP1 constructs treated for 24 hours with DMSO or G12Ci (20 nM). G, Five-day viability assays following G12Ci treatment of cells as in F. Each data point represents the mean ± SD for three or more biological replicates. H, Immunoblot of H358 cells overexpressing designated TAZ constructs treated for 24 hours with DMSO or G12Ci (20 nM). I, Five-day viability assay following G12Ci treatment of cells as in H. Data points represent the mean ± SD for three biological replicates. J, Five-day viability assay following individual or concurrent YAP1/TAZ knockdown (Y2, T1) in the presence of DMSO or ~GI50 doses of G12Ci (H358: 1 nM; MIA PaCa-2: 5 nM; SW837: 10 nM; UM53, H2030, H23: 50 nM; SW1573: 100 nM). Knockdown was performed 24 hours prior to addition of DMSO or G12Ci. Viability is normalized to DMSO/NS-treated control cells. Data points represent the median viability across three or more biological replicates for each indicated cell line and condition. Statistics represent one-way ANOVA with Dunnett post hoc multiple comparisons testing: *, P < 0.05; ****, P < 0.0001; ns, not significant. K, Five-day apoptosis assay (annexin V-FITC/propidium iodide) in indicated cell lines following treatment with G12Ci, siYAP1/TAZ (Y2, T1), or the combination. Knockdown with non-targeting control (NS, “-“) or YAP1/TAZ (YT, “+”) was performed 24 hours prior to addition of DMSO or G12Ci. Statistics represent one-way ANOVA with Tukey post hoc multiple comparisons testing.
Figure 3.
Figure 3.
YAP1 and TAZ drive resistance to G12Ci independent of ERK. A-E, Expression of activated YAP1 and TAZ in H358 cells was induced by Dox (1 μg/mL) 24 hours prior to the indicated treatments. A, Five-day viability assay in YAP1S127/397A overexpressing H358 cells treated with the indicated inhibitors. Each data point represents the mean ± SD for three biological replicates. B, Immunoblot to detect ERK inhibition in YAP1S127/397A and TAZS89/311A overexpressing H358 cells following 24 hours of treatment with DMSO or G12Ci (20 nM). C, Immunoblot to detect inhibition of PI3K signaling as in B. D, Five-day viability assay of YAP1S127/397A overexpressing H358 cells treated with increasing doses of G12Ci alone or in combination with ERKi (SCH772984, 1 μM), PI3Kαi (alpelisib, 1 μM), mTORC1/2i (vistusertib, 1 μM), or paclitaxel (10 nM). Data points represent the mean ± SD for three or more biological replicates. Some combinations displayed in different panels were performed alongside the shared G12Ci treatment alone (−/+ Dox). E, Immunoblots in cells overexpressing YAP1S127/397A and treated for 24 hours with DMSO or G12Ci (20 nM) alone or in combination with inhibitors as in D. Blots are from the same lysates as Supplementary Fig. S3C.
Figure 4.
Figure 4.
YAP1/TAZ gene signature is associated with primary resistance to G12Ci. A, Five-day viability assay following treatment of 12 KRASG12C-mutant cell lines with increasing concentrations of G12Ci. Each data point represents the mean for three or more biological replicates. Treatment response was stratified into three categories: sensitive (blue), intermediate (green), and resistant (red). Many curves were generated from the G12Ci-alone (-TEADi) condition in Supplementary Fig. S7D-E. B, Cordenonsi YAP Conserved Signature (MSigDB) enrichment plot of differentially regulated genes between four G12Ci-sensitive and five resistant cell lines. C, Single sample GSEA (ssGSEA) net enrichment scores (NES) for three YAP1/TAZ signatures across 26 KRASG12C-mutant cancer cell lines. Cell line labels are colored according to their observed G12Ci sensitivity. D, Volcano plot (left) showing differentially expressed genes following KRAS knockdown (shRNA) in a panel of human PDAC cell lines (26). Genes with a LogFC < −0.5 and an FDR < 0.05 are broadly defined as “shKRAS-downregulated” (n = 925). Genes within published YAP1/TAZ gene signatures (those used in C), along with MYC, which was added manually given the reported ability of both YAP1/TAZ (37) and KRAS (36) to regulate its expression, are overlaid (n = 184 genes). Venn diagram (right) showing the overlap between KRAS-, YAP1/TAZ-, and potentially co-regulated genes. Forty co-regulated genes are labeled. E, Immunoblot of YAP1S127/397A and TAZS89/311A overexpressing H358 cells following 24 hours of treatment with DMSO or G12Ci (20 nM). Dox (1 μg/mL) was added 24 hours before G12Ci. F, Immunoblot of cell lines following 24 hours of treatment with G12Ci (H2030, SW1573: 200 nM; H358, MIA PaCa-2, SW837: 20 nM) with or without YAP1/TAZ knockdown. Reverse knockdown with non-targeting control (siNS, “-“) or YAP1/TAZ (siYT, “+”) was performed 24 hours prior to addition of DMSO or G12Ci.
Figure 5.
Figure 5.
YAP1/TAZ activation drives treatment-induced acquired resistance to G12Ci. A-G, Parental and resistant cell lines were grown in DMSO or adagrasib (H358: 1 μM; MIA PaCa-2: 2 μM), respectively. A, Six-day viability assay of parental and adagrasib-resistant H358 (left) and MIA PaCa-2 (right) cell lines. Each data point represents the mean ± SD for three biological replicates. B, Representative widefield fluorescence images of merged DAPI (blue) and phalloidin (red) staining in H358 (left) and MIA PaCa-2 (right) parental and adagrasib-resistant cell lines. Scale bars = 25 μm. C, Representative confocal immunofluorescence images of individual and merged staining for YAP1/TAZ (green) and DAPI (blue) in cell lines as in B. Scale bars = 25 μm. D, Immunoblot following 72-hour knockdown of YAP1/TAZ (YT) or non-targeting control (NS) in H358 (top) and MIA PaCa-2 (bottom) parental and adagrasib-resistant cell lines. E, Six-day viability assay in cell lines as in D. Each data point represents the mean ± SD for three biological replicates; two-way ANOVA with Tukey post hoc multiple comparisons testing. F, Immunoblot following 72-hour knockdown in cell lines as in D. G, Five-day apoptosis assay (annexin V-FITC/propidium iodide) in cell lines as in D. N = three biological replicates with the mean ± SD shown; two-tailed unpaired t test. H, Schematic representing convergence of KRAS-ERK and YAP1/TAZ signaling.
Figure 6.
Figure 6.
YAP1 and TAZ require TEAD to drive resistance to KRASG12C inhibition. A-E, Mutant YAP1 and TAZ overexpression was induced by Dox (1 μg/mL) 24 hours prior to indicated treatments; YAP1S127/397A and TAZS89/311A (activated), YAP1S127/397/94A and TAZS89/311/51A (activated, TEAD binding-deficient). A, Immunoblot of MIA PaCa-2 cells overexpressing the indicated YAP1 (top) and TAZ (bottom) mutants following 24-hour treatment with DMSO or G12Ci (20 nM). B, Five-day viability assay following G12Ci treatment of cells as in A. Data points represent the mean ± SD for three or more biological replicates. C-E, Immunoblot of H358 cells overexpressing indicated YAP1 and TAZ mutants following 24-hour treatment with DMSO or G12Ci (20 nM). Immunoblots detect markers of cell viability (C), PI3K signaling (D), or protein abundance of KRAS-ERK and YAP1/TAZ co-regulated genes (E).
Figure 7.
Figure 7.
TEAD inhibition enhances initial and long-term efficacy of KRASG12C-selective inhibitors. A, Immunoblot of UM53 and H2030 cells expressing dox-inducible TEAD dominant-negative peptide (TEAD-DN) (19) and treated with DMSO or G12Ci (200 nM) for 24 hours. Dox (1 μg/mL) was added 24 hours before drug treatment. B, Five-day viability assay following G12Ci treatment of cell lines as in A. Each data point represents the mean ± SD for three biological replicates. C, Immunoblot following 72-hour treatment with pan-TEAD inhibitors, VT-104 and VT-107; TEAD1-selective inhibitor, VT-103; and an inactive VT-107 enantiomer, VT-106, at the indicated concentrations. D, Five-day viability assay performed in cells as in C. Each data point represents the mean ± SD for three biological replicates. E, Top – five-day viability assay in UM53 cells following increasing doses of both G12Ci and the indicated TEADi. Each data point represents the mean ± SD for three biological replicates. Bottom - Excess over Bliss synergy values calculated from data represented above using SynergyFinder. Tiles in the 2D contour represents the synergy score at each combination. Representative plots are shown. F, Average synergy scores taken from combination studies in E and Supplementary Fig. S7D-E. Boxplots represent the mean and range for average synergy scores taken from three or more independent biological replicates. G, Adagrasib (100 mg/kg), VT-104 (10 mg/kg) or the combination was administered daily by oral gavage to NOD-SCID mice bearing the SW837 subcutaneous cell line-derived xenografts (n = 8 per treatment). Treatment (grey tile) was stopped at day 30. H, Adagrasib (100 mg/kg), VT-3989 (30 mg/kg) or the combination was administered daily via oral gavage to BALB/c mice bearing the CR6243 subcutaneous patient-derived xenografts (n = 10 per treatment). Treatment (grey tile) was stopped at day 31. (G, H), Data are shown as tumor volume mean ± SEM. Statistical significance between adagrasib and combination treatment groups was determined by two-way ANOVA; ****, P < 0.0001.

Comment in

Similar articles

Cited by

References

    1. Punekar SR, Velcheti V, Neel BG, Wong K-K. The current state of the art and future trends in RAS-targeted cancer therapies. Nat Rev Clin Oncol 2022;19:637–55. - PMC - PubMed
    1. Moore AR, Rosenberg SC, McCormick F, Malek S. RAS-targeted therapies: is the undruggable drugged? Nat Rev Drug Discov 2020;19:533–52. - PMC - PubMed
    1. Siegel RL, Miller KD, Wagle NS, Jemal A. Cancer statistics, 2023. CA Cancer J Clin 2023;73:17–48. - PubMed
    1. Ostrem JM, Peters U, Sos ML, Wells JA, Shokat KM. K-Ras(G12C) inhibitors allosterically control GTP affinity and effector interactions. Nature 2013;503:548–51. - PMC - PubMed
    1. Skoulidis F, Li BT, Dy GK, Price TJ, Falchook GS, Wolf J, et al. Sotorasib for Lung Cancers with KRAS p.G12C Mutation. N Engl J Med 2021;384:2371–81. - PMC - PubMed

Publication types

MeSH terms

Substances