. 2023 Dec 15;83(24):4130-4141.
doi: 10.1158/0008-5472.CAN-23-1127.

CRISPR Screening Identifies Mechanisms of Resistance to KRASG12C and SHP2 Inhibitor Combinations in Non-Small Cell Lung Cancer

Affiliations

CRISPR Screening Identifies Mechanisms of Resistance to KRASG12C and SHP2 Inhibitor Combinations in Non-Small Cell Lung Cancer

Anirudh Prahallad et al. Cancer Res. .

Abstract

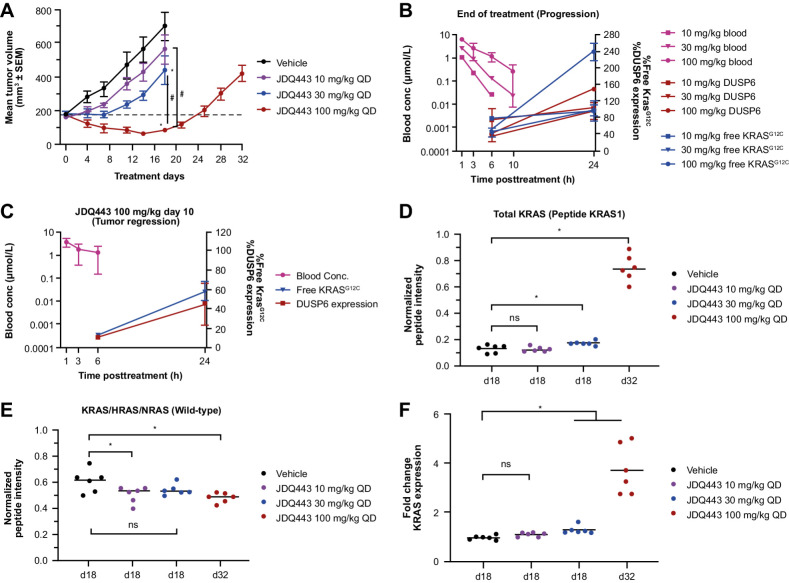
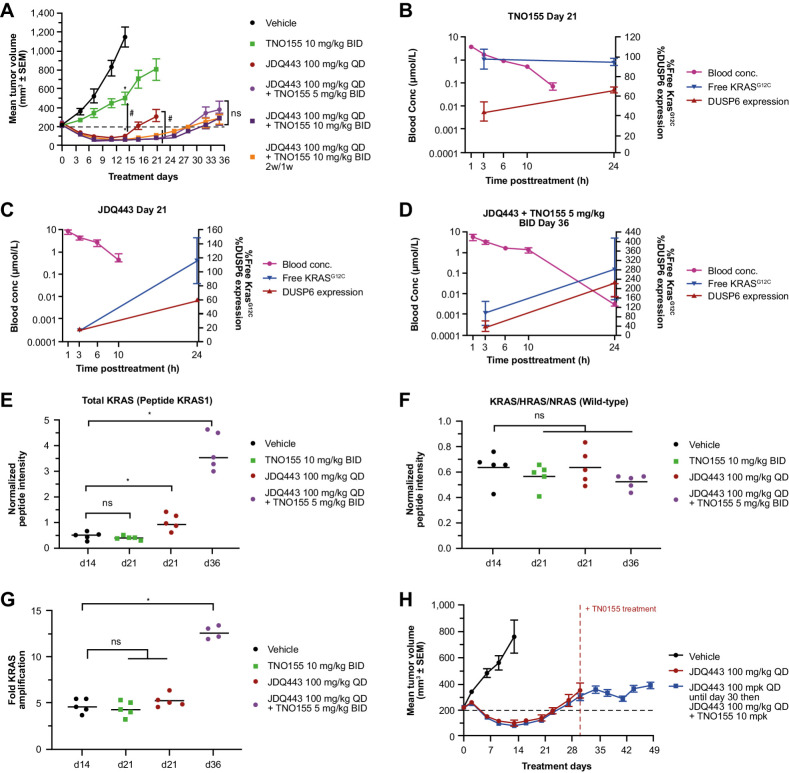
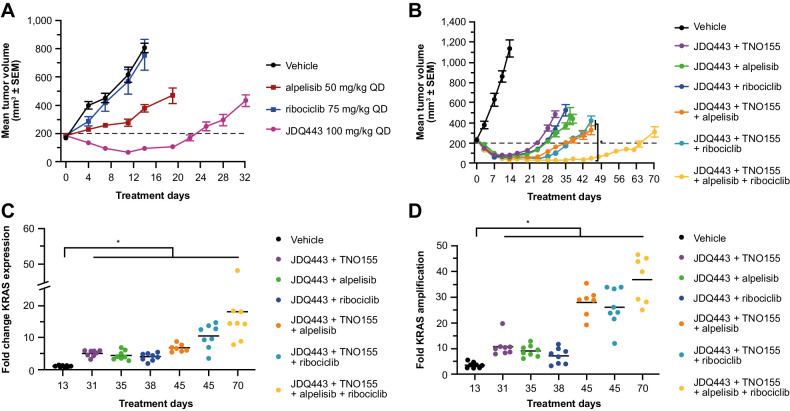
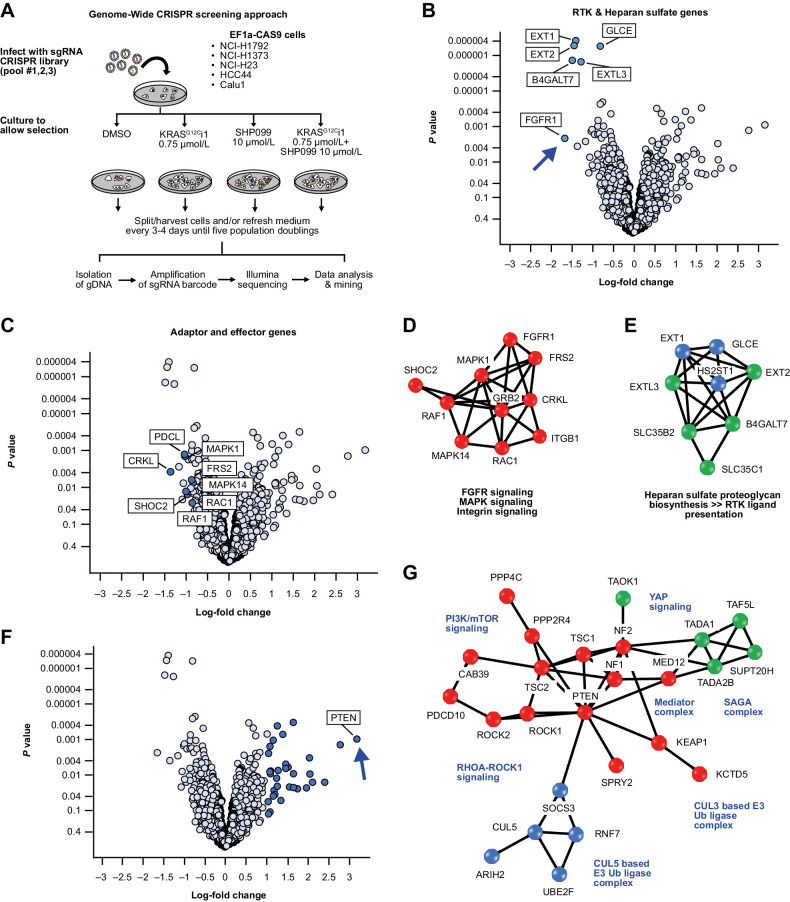
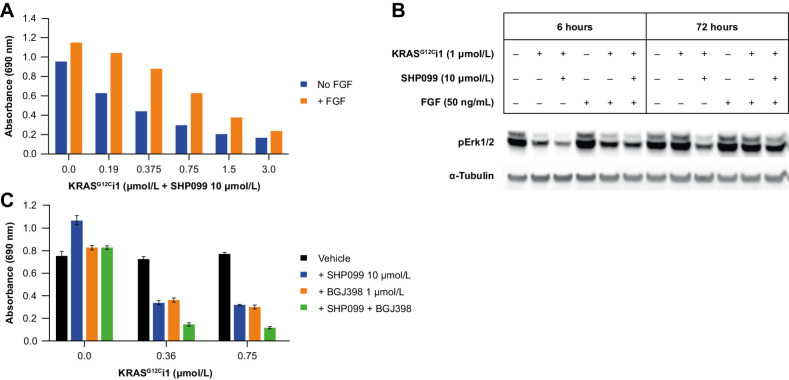
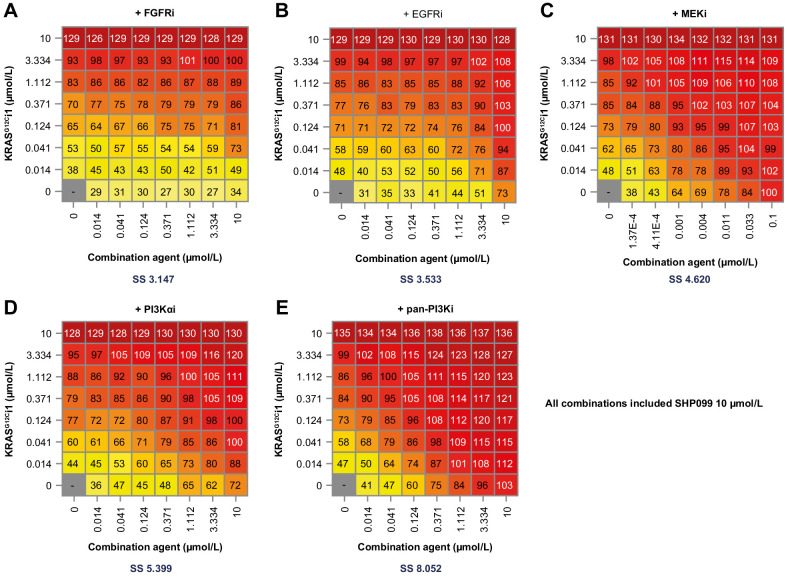
Although KRASG12C inhibitors show clinical activity in patients with KRAS G12C mutated non-small cell lung cancer (NSCLC) and other solid tumor malignancies, response is limited by multiple mechanisms of resistance. The KRASG12C inhibitor JDQ443 shows enhanced preclinical antitumor activity combined with the SHP2 inhibitor TNO155, and the combination is currently under clinical evaluation. To identify rational combination strategies that could help overcome or prevent some types of resistance, we evaluated the duration of tumor responses to JDQ443 ± TNO155, alone or combined with the PI3Kα inhibitor alpelisib and/or the cyclin-dependent kinase 4/6 inhibitor ribociclib, in xenograft models derived from a KRASG12C-mutant NSCLC line and investigated the genetic mechanisms associated with loss of response to combined KRASG12C/SHP2 inhibition. Tumor regression by single-agent JDQ443 at clinically relevant doses lasted on average 2 weeks and was increasingly extended by the double, triple, or quadruple combinations. Growth resumption was accompanied by progressively increased KRAS G12C amplification. Functional genome-wide CRISPR screening in KRASG12C-dependent NSCLC lines with distinct mutational profiles to identify adaptive mechanisms of resistance revealed sensitizing and rescuing genetic interactions with KRASG12C/SHP2 coinhibition; FGFR1 loss was the strongest sensitizer, and PTEN loss the strongest rescuer. Consistently, the antiproliferative activity of KRASG12C/SHP2 inhibition was strongly enhanced by PI3K inhibitors. Overall, KRAS G12C amplification and alterations of the MAPK/PI3K pathway were predominant mechanisms of resistance to combined KRASG12C/SHP2 inhibitors in preclinical settings. The biological nodes identified by CRISPR screening might provide additional starting points for effective combination treatments.

Significance: Identification of resistance mechanisms to KRASG12C/SHP2 coinhibition highlights the need for additional combination therapies for lung cancer beyond on-pathway combinations and offers the basis for development of more effective combination approaches. See related commentary by Johnson and Haigis, p. 4005.


Figures

Figure 1. A, Lu99 xenograft tumor growth curves under JDQ443 treatment. B, JDQ443 PK and PD at end of JDQ443 treatment (day 18/day 32). C, JDQ443 (100 mg/kg once daily) PK and PD during tumor regression (day 10). D, Tumor KRAS protein levels (G12C and wild type). E, Tumor wild-type pan-RAS protein levels at end of JDQ443 treatment. F, KRAS mRNA fold change versus vehicle at end of JDQ443 treatment. *, P < 0.05 versus vehicle; #, P < 0.05 versus each other; ns, nonsignificant, P ≥ 0.05. QD, once daily.
Figure 1.
A, Lu99 xenograft tumor growth curves under JDQ443 treatment. B, JDQ443 PK and PD at end of JDQ443 treatment (day 18/day 32). C, JDQ443 (100 mg/kg once daily) PK and PD during tumor regression (day 10). D, Tumor KRAS protein levels (G12C and wild type). E, Tumor wild-type pan-RAS protein levels at end of JDQ443 treatment. F, KRAS mRNA fold change versus vehicle at end of JDQ443 treatment. *, P < 0.05 versus vehicle; #, P < 0.05 versus each other; ns, nonsignificant, P ≥ 0.05. QD, once daily.
Figure 2. A, LU99 xenograft tumor growth curves for JDQ443, TNO155, or both. B–D, PK and tumor PD of TNO155 10 mg/kg BID, JDQ443 100 mg/kg, or both, at end of treatment period. E, Tumor KRAS protein levels (G12C and wild type). F, Tumor wild-type pan-RAS protein levels. G, Tumor KRAS gene copy number at end of treatment; H, LU99 tumor growth curves for JDQ443 + TNO155 dosed together from day 1 or following early tumor progression on JDQ443 as a single agent. *, P < 0.05 versus vehicle; #, P < 0.05 versus each other; ns, nonsignifcant, P ≥ 0.05. BID, twice daily; QD, once daily.
Figure 2.
A, LU99 xenograft tumor growth curves for JDQ443, TNO155, or both. BD, PK and tumor PD of TNO155 10 mg/kg BID, JDQ443 100 mg/kg, or both, at end of treatment period. E, Tumor KRAS protein levels (G12C and wild type). F, Tumor wild-type pan-RAS protein levels. G, Tumor KRAS gene copy number at end of treatment; H, LU99 tumor growth curves for JDQ443 + TNO155 dosed together from day 1 or following early tumor progression on JDQ443 as a single agent. *, P < 0.05 versus vehicle; #, P < 0.05 versus each other; ns, nonsignifcant, P ≥ 0.05. BID, twice daily; QD, once daily.
Figure 3. A, LU99 tumor growth curves for JDQ443, alpelisib, and ribociclib as single agents. B, Growth curves for JDQ443-based combination regimens. C and D, Fold changes versus vehicle in KRAS mRNA expression (C) and KRAS gene copy number (D) at end of combination treatment. *, P < 0.05. QD, once daily.
Figure 3.
A, LU99 tumor growth curves for JDQ443, alpelisib, and ribociclib as single agents. B, Growth curves for JDQ443-based combination regimens. C and D, Fold changes versus vehicle in KRAS mRNA expression (C) and KRAS gene copy number (D) at end of combination treatment. *, P < 0.05. QD, once daily.
Figure 4. A, Overview of the CRISPR screening approach. B and C, Individual sensitizing genes to the combination of KRASG12Ci1 and SHP099. D and E, Protein interaction networks for genes sensitizing genes identified by CRISPR screening. F, Individual rescuer genes to the combination of KRASG12Ci1 and SHP099. G, Protein interaction networks for rescuer genes.
Figure 4.
A, Overview of the CRISPR screening approach. B and C, Individual sensitizing genes to the combination of KRASG12Ci1 and SHP099. D and E, Protein interaction networks for genes sensitizing genes identified by CRISPR screening. F, Individual rescuer genes to the combination of KRASG12Ci1 and SHP099. G, Protein interaction networks for rescuer genes.
Figure 5. A and B, Inhibition of NCI-H23 colony formation (A) and pERK (B) under KRASG12Ci1 + SHP099 with or without exogenous FGF (50 ng/mL). C, Effect of FGFR1 inhibition with BJG398 on NCI-H23 colony formation under treatment with KRASG12Ci1 ± SHP099.
Figure 5.
A and B, Inhibition of NCI-H23 colony formation (A) and pERK (B) under KRASG12Ci1 + SHP099 with or without exogenous FGF (50 ng/mL). C, Effect of FGFR1 inhibition with BJG398 on NCI-H23 colony formation under treatment with KRASG12Ci1 ± SHP099.
Figure 6. NCI-H23 dose combination matrices for RAS-associated pathway inhibitors with KRASG12Ci1 + SHP009 (10 μmol/L) + BGJ398 (FGFRi; A), erlotinib (EGFRi; B), trametinib (MEKi; C), alpelisib (PI3Kαi; D), or GDC0941 (pan-PI3K; E). SS, synergy score (Loewe's index).
Figure 6.
NCI-H23 dose combination matrices for RAS-associated pathway inhibitors with KRASG12Ci1 + SHP009 (10 μmol/L) + BGJ398 (FGFRi; A), erlotinib (EGFRi; B), trametinib (MEKi; C), alpelisib (PI3Kαi; D), or GDC0941 (pan-PI3K; E). SS, synergy score (Loewe's index).

Comment in

References

    1. Cancer Genome Atlas Research N, Weinstein JN, Collisson EA, Mills GB, Shaw KR, Ozenberger BA, et al. . The cancer genome atlas pan-cancer analysis project. Nat Genet 2013;45:1113–20. - PMC - PubMed
    1. Forbes SA, Bindal N, Bamford S, Cole C, Kok CY, Beare D, et al. . COSMIC: mining complete cancer genomes in the catalogue of somatic mutations in cancer. Nucleic Acids Res 2011;39:D945–50. - PMC - PubMed
    1. Molina JR, Yang P, Cassivi SD, Schild SE, Adjei AA. Non–small cell lung cancer: epidemiology, risk factors, treatment, and survivorship. Mayo Clin Proc 2008;83:584–94. - PMC - PubMed
    1. Malumbres M, Barbacid M. RAS oncogenes: the first 30 years. Nat Rev Cancer 2003;3:459–65. - PubMed
    1. Donovan S, Shannon KM, Bollag G. GTPase activating proteins: critical regulators of intracellular signaling. Biochim Biophys Acta 2002;1602:23–45. - PubMed

Publication types

MeSH terms