. 2024 Feb;109(2):240-254.
doi: 10.1113/EP091571. Epub 2023 Nov 7.

Vascular dysfunction and the age-related decline in critical power

Affiliations

Vascular dysfunction and the age-related decline in critical power

Abigail Dorff et al. Exp Physiol. 2024 Feb.

Abstract

Ageing results in lower exercise tolerance, manifested as decreased critical power (CP). We examined whether the age-related decrease in CP occurs independently of changes in muscle mass and whether it is related to impaired vascular function. Ten older (63.1 ± 2.5 years) and 10 younger (24.4 ± 4.0 years) physically active volunteers participated. Physical activity was measured with accelerometry. Leg muscle mass was quantified with dual X-ray absorptiometry. The CP and maximum power during a graded exercise test (PGXT ) of single-leg knee-extension exercise were determined over the course of four visits. During a fifth visit, vascular function of the leg was assessed with passive leg movement (PLM) hyperaemia and leg blood flow and vascular conductance during knee-extension exercise at 10 W, 20 W, slightly below CP (90% CP) and PGXT . Despite not differing in leg lean mass (P = 0.901) and physical activity (e.g., steps per day, P = 0.735), older subjects had ∼30% lower mass-specific CP (old = 3.20 ± 0.94 W kg-1 vs. young = 4.60 ± 0.87 W kg-1 ; P < 0.001). The PLM-induced hyperaemia and leg blood flow and/or conductance were blunted in the old at 20 W, 90% CP and PGXT (P < 0.05). When normalized for leg muscle mass, CP was strongly correlated with PLM-induced hyperaemia (R2 = 0.52; P < 0.001) and vascular conductance during knee-extension exercise at 20 W (R2 = 0.34; P = 0.014) and 90% CP (R2 = 0.39; P = 0.004). In conclusion, the age-related decline in CP is not only an issue of muscle quantity, but also of impaired muscle quality that corresponds to impaired vascular function.

Keywords: ageing; endothelial function; exercise blood flow; exercise intolerance.


Conflict of interest statement

The authors declare no conflicts of interest.

Figures
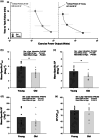
FIGURE 1
FIGURE 1
The effect of age on mass‐specific exercise tolerance during single‐leg knee‐extension exercise. (a) Illustration of the relationship between exercise power and time to task failure for young and older adults (data are means ± SEM). (b) Maximum power output achieved during a graded exercise test (P GXT) normalized by leg lean mass. (c) Critical power (CP) normalized by leg lean mass. (d) Work prime (W′) normalized by leg lean mass. (e) Critical power expressed as a percentage of P GXT. *Significant effect of age. Small symbols in (b–e) represent individual data points, with triangles representing females and circles representing males. Statistics were determined with a 2 × 2 ANOVA, with 10 subjects (five females and five male) in each group.
FIGURE 2
FIGURE 2
The effect of age on blood flow when exercising slightly below (90%) critical power (CP). (a) Leg blood flow, normalized by leg lean mass, during the 10th minute of exercise at 90% CP. (b) Blood flow during the 10th minute of exercise at 90% CP expressed as a percentage of maximum blood flow achieved when exercising at the maximum power achieved during a graded exercise test (P GXT). (c) Leg vascular conductance, normalized by leg lean mass, during the 10th minute of exercise at 90% CP. (d) Vascular conductance during the 10th minute of exercise at 90% CP expressed as a percentage of maximum conductance achieved when exercising at P GXT. *Significant effect of age. Small symbols represent individual data points, with triangles representing females and circles representing males. Statistics were determined with a 2 × 2 ANOVA, with 10 subjects (five females and five male) in each group for (a) and (c). Owing to difficulties in measuring blood flow/pressure during maximum exercise, only eight young (three female and five male) and seven old (five female and two male) subjects were included in the analysis for (b) and (d).
FIGURE 3
FIGURE 3
Effect of age on vascular function. (a) Leg vascular conductance when performing 20 W of knee‐extension (KE) exercise. (b) Total leg blood flow response to passive leg movement (PLM), normalized by leg lean mass, with statistics performed on the area under the curve. (c) Peak blood flow response to PLM. *Significant effect of age. Small symbols in (a) and (c) represent individual data points, with triangles representing females and circles representing males. Statistics were determined with a 2 × 2 ANOVA, with 10 subjects (five females and five male) in each group.
FIGURE 4
FIGURE 4
Relationship between critical power (CP) and vascular function. (a) The relationship between mass‐specific CP and mass‐specific leg blood flow during 90% CP knee‐extension exercise. (b) The relationship between mass‐specific CP and mass‐specific vascular conductance at 90% CP. (c) The relationship between mass‐specific CP and vascular function assessed by passive leg movement (PLM). Statistics were determined by linear regression, with five young females, five young males, five old females and five old males included in the analysis.
FIGURE 5
FIGURE 5
Relationship between resistance artery function and exercise blood flow and conductance. (a) The relationship between leg blood flow during 20 W knee‐extension exercise when normalized for muscle mass and peak leg blood flow in response to passive leg movement (PLM) when normalized for muscle mass. (b) The relationship between leg blood flow during 90% critical power (CP) knee‐extension exercise when normalized for muscle mass and peak leg blood flow in response to PLM when normalized for muscle mass. (c) The relationship between leg blood flow during maximum power achieved during a graded exercise test (P GXT) knee‐extension exercise when normalized for muscle mass and peak leg blood flow in response to PLM when normalized for muscle mass. (d) The relationship between leg vascular conductance during 20 W knee‐extension exercise when normalized for muscle mass and peak leg blood flow in response to PLM when normalized for muscle mass. (e) The relationship between leg vascular conductance during 90% CP knee‐extension exercise when normalized for muscle mass and peak leg blood flow in response to PLM when normalized for muscle mass. (f) The relationship between leg vascular conductance during P GXT when normalized for muscle mass and peak leg blood flow in response to PLM when normalized for muscle mass. Statistics were determined by linear regression, with five young females, five young males, five old females and five old males included in the analysis, except for (c) and (f), which had only eight young (three female and five male) and seven old (five female and two male) subjects included in the analysis owing to difficulties in measuring blood flow/pressure during maximal exercise.
FIGURE 6
FIGURE 6
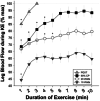
Leg blood flow response to knee‐extension (KE) exercise at four different intensities. All subjects performed 10 min of KE at 10 W, 20 W and 90% of their personal critical power (CP). Subjects also performed exercise at their previously determined maximum power (P GXT) until task failure. Leg blood flow is expressed as a percentage of maximum blood flow achieved when exercising at P GXT. Owing to missing time points (e.g., poor blood flow measurements at the onset of an exercise bout), only 15 subjects (nine young and six old) were included in this analysis. Data are not separated by age. Significant main effects of time (P < 0.001) were observed for each intensity. *Blood flow at that time point is significantly different from the final time point for that intensity. Data are presented as means ± SEM.

References

    1. Broxterman, R. M. , Ade, C. J. , Wilcox, S. L. , Schlup, S. J. , Craig, J. C. , & Barstow, T. J. (2014). Influence of duty cycle on the power‐duration relationship: Observations and potential mechanisms. Respiratory Physiology & Neurobiology, 192, 102–111. - PubMed
    1. Broxterman, R. M. , Trinity, J. D. , Gifford, J. R. , Kwon, O. S. , Kithas, A. C. , Hydren, J. R. , Nelson, A. D. , Morgan, D. E. , Jessop, J. E. , Bledsoe, A. D. , & Richardson, R. S. (2017). Single passive leg movement assessment of vascular function: Contribution of nitric oxide. Journal of Applied Physiology (1985), 123(6), 1468–1476. - PMC - PubMed
    1. Collins, J. , Leach, O. , Dorff, A. , Linde, J. , Kofoed, J. , Sherman, M. , Proffit, M. , & Gifford, J. R. (2022). Critical power and work‐prime account for variability in endurance training adaptations not captured by V̇o(2max). Journal of Applied Physiology (1985), 133(4), 986–1000. - PubMed
    1. Copp, S. W. , Hirai, D. M. , Musch, T. I. , & Poole, D. C. (2010). Critical speed in the rat: Implications for hindlimb muscle blood flow distribution and fibre recruitment. The Journal of Physiology, 588(24), 5077–5087. - PMC - PubMed
    1. Craig, J. C. , Colburn, T. D. , Caldwell, J. T. , Hirai, D. M. , Tabuchi, A. , Baumfalk, D. R. , Behnke, B. J. , Ade, C. J. , Musch, T. I. , & Poole, D. C. (2019). Central and peripheral factors mechanistically linked to exercise intolerance in heart failure with reduced ejection fraction. American Journal of Physiology. Heart and Circulatory Physiology, 317(2), H434–H444. - PMC - PubMed