. 2023 Dec 4;222(12):e202305009.
doi: 10.1083/jcb.202305009. Epub 2023 Nov 7.

CCDC15 localizes to the centriole inner scaffold and controls centriole length and integrity

Affiliations

CCDC15 localizes to the centriole inner scaffold and controls centriole length and integrity

Melis D Arslanhan et al. J Cell Biol. .

Abstract

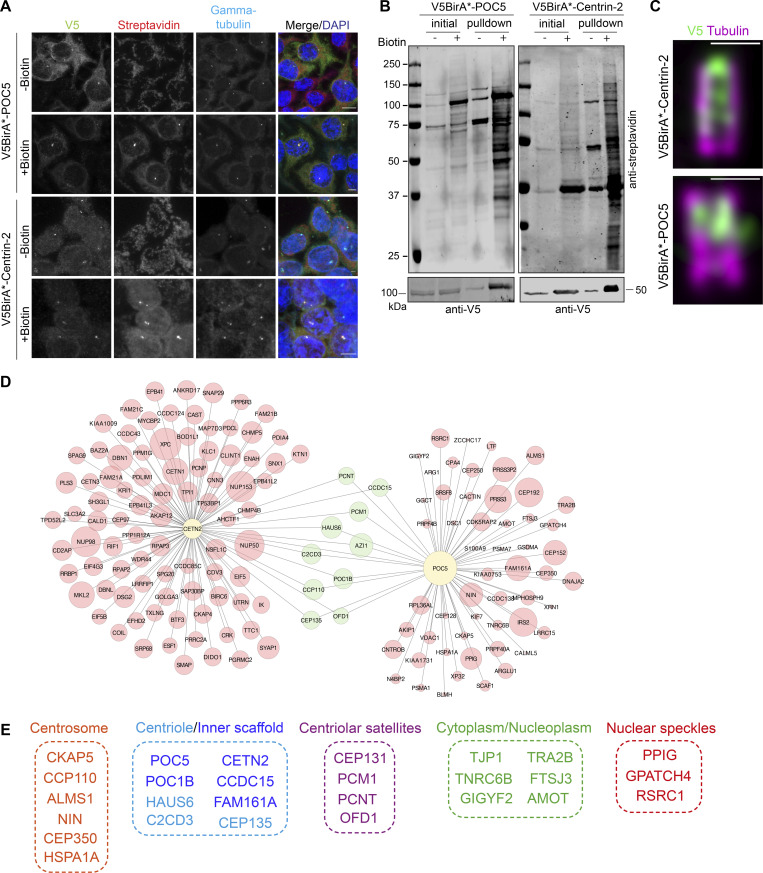
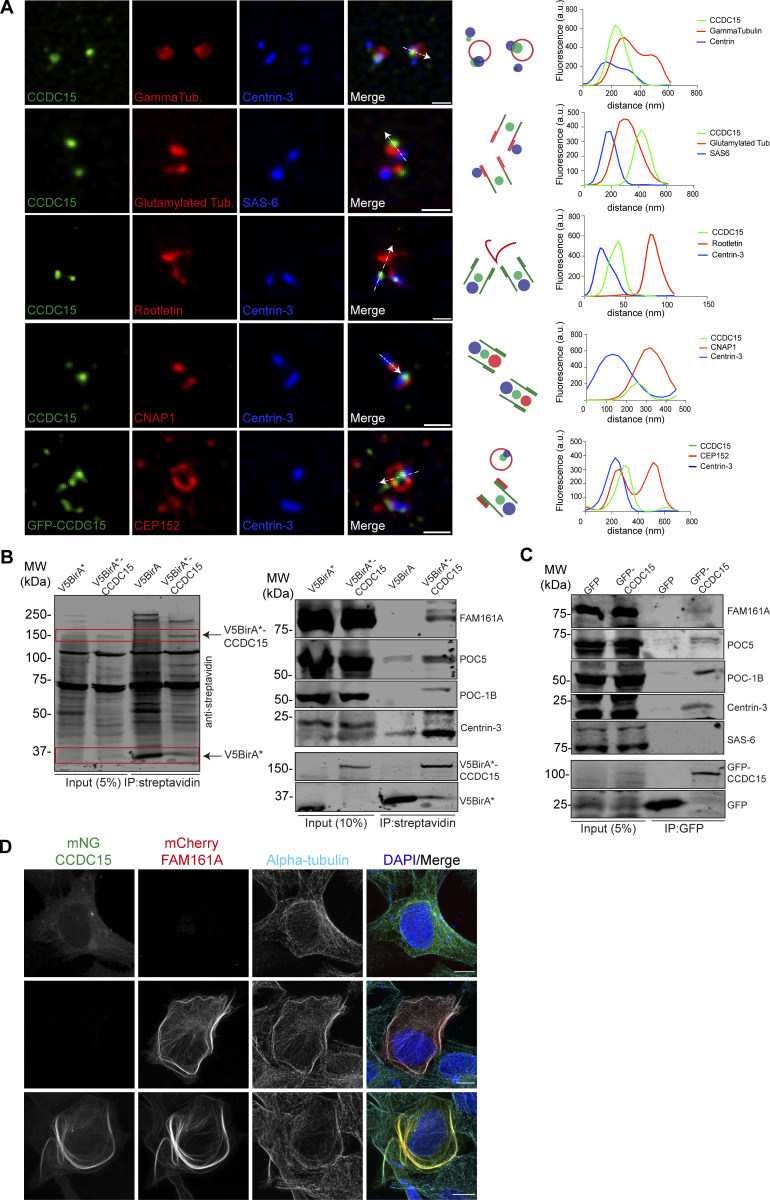
Centrioles are microtubule-based organelles responsible for forming centrosomes and cilia, which serve as microtubule-organizing, signaling, and motility centers. Biogenesis and maintenance of centrioles with proper number, size, and architecture are vital for their functions during development and physiology. While centriole number control has been well-studied, less is understood about their maintenance as stable structures with conserved size and architecture during cell division and ciliary motility. Here, we identified CCDC15 as a centriole protein that colocalizes with and interacts with the inner scaffold, a crucial centriolar subcompartment for centriole size control and integrity. Using ultrastructure expansion microscopy, we found that CCDC15 depletion affects centriole length and integrity, leading to defective cilium formation, maintenance, and response to Hedgehog signaling. Moreover, loss-of-function experiments showed CCDC15's role in recruiting both the inner scaffold protein POC1B and the distal SFI1/Centrin-2 complex to centrioles. Our findings reveal players and mechanisms of centriole architectural integrity and insights into diseases linked to centriolar defects.


Conflict of interest statement

Disclosures: The authors declare no competing interests exist.

Figures

Figure 1.
Figure 1.
Identification of POC5 and Centrin-2 proximity interactome. (A) Biotinylation of the centrosome by V5BirA*-POC5 and V5BirA*-Centrin-2. HEK293T cells stably expressing V5BirA*-POC5 and V5BirA*-Centrin-2 were treated with biotin for 18 h. Cells were then fixed and stained for the protein of interest with V5, biotinylated proteins with fluorescent streptavidin, and centrosome with anti-γ-tubulin antibody. DNA was visualized with DAPI. Scale bar, 10 μm. (B) HEK293T cells stably expressing V5BirA*-POC5 and V5BirA*-Centrin-2 were lysed, and biotinylated proteins were precipitated by streptavidin beads. The initial sample (initial) and immunoprecipitated biotinylated proteins (pulldown) were run on a gel and immunoblotted with fluorescent-coupled streptavidin and V5 antibodies. (C) Representative confocal images of HEK293T::V5BirA*-POC5 and HEK294T::V5BirA*-Centrin-2 centrioles expanded using U-ExM and stained for tubulin (magenta) and V5 (green). Scale bar, 1 μm. (D) POC5 and Centrin-2 proximity interactome map. High-confidence proximity interactors of POC5 and Centrin-2 were determined by using NSAF analysis. The interactome map containing the first 100 proximity interactome of Centrin-2 and all the proximity interactors POC5 was drawn in CytoScape and the shared interactome was visualized in green circles. The circle size corresponds to the fold change. (E) Cellular compartment analysis of the shared proximity interactors of Centrin-2 and POC5. The GO analysis of the shared proximity interactome was determined using DAVID. Source data are available for this figure: SourceData F1.
Figure S1.
Figure S1.
Characterization of stable lines expressing V5BirA* fusions of Centrin-2 and POC5. (A) Quantification of centrosomal and non-centrosomal biotinylation in HEK293T::V5BirA*-Centrin-2 and HEK293T::V5BirA*-POC5 cells treated with 50 μm biotin for 18 h. Streptavidin fluorescence levels were measured from maximum-intensity projections, and average means of the centrosomal levels were normalized to one in each experiment. n = 50 cells per experiment. Data represent the mean of three independent experiments. HEK293T::V5BirA*-Centrin-2: unspecific = 13.98% ± 8.7, centrosomal = 1% ± 0.38, non-centrosomal = 23.82% ± 10.44, P < 0.0001; HEK293T::V5BirA*-POC5: unspecific = 19.94% ± 7.2, centrosomal = 1% ± 0.66, non-centrosomal = 27.12% ± 12.51, P = 0.9831, two-sided t test. (B) Immunoblot analysis of centrosomal and non-centrosomal biotinylation in HEK293T::V5BirA*-Centrin-2 and HEK293T::V5BirA*-POC5 cells. HEK293T::V5BirA*-Centrin-2 and HEK293T::V5BirA*-POC5 cells were treated with 5 μg/ml nocodazole and cytochalasin B for 1 h at 37°C. Cells were then lysed in hypotonic buffer (whole cell lysate), dounce homogenized, and centrifuged. Pellets after centrifugation were prepared as the nuclear fraction. Supernatant (cytosolic fraction) was then centrifuged on a discontinuous sucrose gradient, gradient fractions were collected, and centrosome fractions were pooled (centrosome fraction). The remaining fraction above the sucrose gradient was collected as the “sucrose flowthrough.” 0.1% of each sample was loaded to SDS-PAGE gel. Samples were blotted for the indicated proteins. Cytoplasm samples in the streptavidin and V5 blots that share the actin and tubulin loading control were from the same sample. Cytoplasm sample of the actin and tubulin loading control corresponds to the same lane in the western blot. Red rectangle indicates V5BirA*-Centrin-2 and V5BirA*-POC5 in streptavidin blot. (C) Representative immunofluorescence images of mitotic control, HEK293T::V5BirA*-Centrin-2, and HEK293T::V5BirA*-POC5 cells fixed and stained for streptavidin, γ-tubulin, and DAPI. Scale bar, 5 μm. (D) Representative images of interphase control, HEK293T::V5BirA*-Centrin-2, and HEK293T::V5BirA*-POC5 cells stained for streptavidin and γ-tubulin. DNA was stained with DAPI. Centrosome number >2 was quantified as “centrosome amplification.” Cells with >1 nucleus were quantified as “multinucleated.” Scale bar, 5 μm. (E–H) Quantification for (E) percentage of centrosome duplication (control = 7.1% ± 1.8, V5BirA*-POC5 = 7.12% ± 1.5, V5BirA*-Centrin-2 = 7.5% ± 1.2, P = 0.9088); (F) multinucleation (control = 4.6% ± 0.4, V5BirA*-POC5 = 4.1% ± 0.6, V5BirA*-Centrin-2 = 3.8% ± 0.5, P = 1,644); (G) multipolar spindles (control = 19.9% ± 3.6, V5BirA*-POC5 = 24.9% ± 2.1, V5BirA*-Centrin-2 = 24.2% ± 10.3, P = 0.5306); (H) mitotic index (control = 5.6% ± 2.6, V5BirA*-POC5 = 3.9% ± 2.0, V5BirA*-Centrin-2 = 4.5% ± 0.7, P = 5,034). n > 100 cells per experiment. Data represent mean value from four experiments per condition. Error bars, SD. ns: non-significant, one-way ANOVA. (I) Cell cycle profile of control, HEK293T::V5BirA*-Centrin-2, and HEK293T::V5BirA*-POC5 cells. Cells were fixed with ethanol and stained with Muse Cell Cycle kit. Data represent mean value from three independent experiments with two technical replicates per condition. Error bars, ± SD. ns: non-significant, two-way ANOVA. For G0/G1phase, control = 39.82% ± 2.09, V5BirA*-POC5 = 37.18% ± 1.38, V5BirA*-Centrin-2 = 37.33% ± 1.66; for S phase, control = 21.58% ± 2.96, V5BirA*-POC5 = 21.82% ± 3.46, V5BirA*-Centrin-2 = 21.02% ± 3.90; for G2/M phase, control = 37.28% ± 4.37, V5BirA*-POC5 = 39.10% ± 3.78, V5BirA*-Centrin-2 = 39.02% ± 3.44. For G0/G1 phase control versus V5BirA*-POC5 P = 0.3287, control versus V5BirA*-Centrin-2 P = 0.3706, V5BirA*POC5 versus V5BirA*-Centrin-2 P = 0.9963; for S phase, control versus V5BirA*-POC5 P = 0.9910, control versus V5BirA*-Centrin-2 P = 0.9484, V5BirA*POC5 versus V5BirA*-Centrin-2 P = 0.8999; for G2/M phase, control versus V5BirA*-POC5 P = 0.5842, control versus V5BirA*-Centrin-2 P = 0.6127, V5BirA*POC5 versus V5BirA*-Centrin-2 P = 0.9989. (J) Relative expression of Caspase3 in control, HEK293T::V5BirA*-Centrin-2, and HEK293T::V5BirA*-POC5 cells. Cells were lysed and immunoblotted with antibodies against Caspase3. (K) Quantification of Caspase3 band intensities in control, HEK293T::V5BirA*-Centrin-2, and HEK293T::V5BirA*-POC5 cells. Data represent mean value from three independent experiments per condition. Error bars, SD. Control = 100%, HEK293T::V5BirA*-POC5 = 114% ± 18, HEK293T::V5BirA*-Centrin-2 = 96% ± 12; P = 0.3485 and P = 0.8786, respectively, one-way ANOVA. **** P < 0.0001, ns: non-significant. Source data are available for this figure: SourceData FS1.
Figure S2.
Figure S2.
Gene enrichment analysis of the POC5 and Centrin-2 proximity interactomes. (A and B) GO enrichment analysis of Centrin-2 proximity interactors based on their cellular compartments and biological process. The x axis represents the log-transformed P value (Fisher’s exact test) of GO terms. (C and D) GO enrichment analysis of POC5 proximity interactors based on their cellular compartments and biological process. The x axis represents the log-transformed P value (Fisher’s exact test) of GO terms. (E and F) Centrin-2 and POC5 proximity interactome maps. High-confidence proximity interactors of POC5 and Centrin-2 were determined by using NSAF and CRAPome analysis. The interaction map was generated using STRING protein interaction database and the proximity interactome of Centrin-2 was drawn in CytoScape. The clusters were determined by the ClusterONE plug-in cytoscape.
Figure 2.
Figure 2.
CCDC15 is stably associated with centrosomes throughout the cell cycle. (A) Localization of endogenous CCDC15 to the centrioles in different cell cycle stages. RPE1 cells were stained with antibodies against the centriole marker Centrin-2 and CCDC15. DNA was visualized with DAPI. Scale bar, 5 μm; insets, 1 μm. (B) Spatiotemporal dynamics of CCDC15 during cell cycle. RPE1 cells stably expressing mNG-CCDC15 during mNG-CCDC15 were imaged every 2 min. Scale bar, 1 μm; insets, 0.25 μm. (C) FRAP analysis of CCDC15 dynamics at centrioles. RPE1 cells stably expressing mNG-CCDC15 were grown in a glass-bottom dish; centrioles indicated with yellow circles (3 μm2) were photobleached and then assessed at the indicated times after photobleaching. Scale bar, 500 nm. (D) Percentage of recovery graph of C. Individual FRAP experiments from two biological replicates were fitted into one-phase association curves. n = 11 cells for one centriole curve and n = 15 cells for two centrioles curve. (E) Half-time analyses were calculated using recovery data from D. Error bars, SD. (F) Percentage of mobile and immobile pools of CCDC15 at centrioles were calculated from D. Error bars, SD.
Figure S3.
Figure S3.
Analysis of CCDC15 localization in MTEC cultures and purified centrosomes. (A) Centriolar recruitment of CCDC15 does not depend on microtubules. RPE1 cells were treated with DMSO (vehicle control) or nocodazole. Cells were fixed and stained for CCDC15, α-tubulin, and γ-tubulin. DNA was visualized with DAPI. Scale bar, 1 μm, insets, 0.25 μm. (B) Quantification of A. Error bars, SD. n > 100 cells per experiment. Data represent mean value from two independent experiments per condition. siControl = 1 ± 0.4, siCCDC15 = 0.95 ± 0.43, P = 0.1113, two-sided t test. (C) Localization of CCDC15 in transiently transfected RPE1 cells. RPE1 cells were transfected with mNG-CCDC15, fixed, and stained for CCDC15 and Centrin-2. DNA was visualized with DAPI. Scale bar, 1 μm, insets, 0.25 μm. (D) Localization of CCDC15 in transiently transfected U2OS cells. U2OS cells were transfected with mNG-CCDC15, fixed, and stained for CCDC15 and Centrin-2. DNA was visualized with DAPI. Scale bar, 1 μm. (E) Quantification of C and D. Error bars, SD. n > 100 cells per experiment. Data represent mean value from two independent experiments per condition. U2OS centrosome and satellite localization: 100%, RPE1 only centrosome localization: 220.3% ± 2.3, centrosome and satellite localization: 79.7% ± 2.3. (F) Role of centriolar satellites in centrosomal targeting of CCDC15. RPE1 wild-type (WT) and satellite-less PCM1 knockout (KO) cells were fixed and stained for CCDC15, PCM1, and DNA. Scale bar, 1 μm, insets, 0.25 μm. (G) Quantification of E. n > 100 cells per experiment. Data represent mean value from two independent experiments per condition. RPE1 WT = 1 ± 0.4, RPE1 PCM1 KO = 0.82 ± 0.34. P < 0.0001, two-sided t test. (H) Representative confocal images of MTEC ALI+4 centrioles expanded using U-ExM and stained for tubulin (magenta) and CCDC15 (green). Scale bar, 5 μm. (I) Representative confocal images of HEK293T centrioles expanded using U-ExM and stained for tubulin (magenta) and CCDC15 (green). Scale bar, 1 μm. (J) Representative 3D-SIM images of CCDC15 localization relative to proximal and distal end markers of centrioles. Centrosomes purified from HEK293T cells were fixed with methanol and stained for CCDC15 and markers for distal appendages (CEP164), proximal end linker (Rootletin), centriole distal end lumen (Centrin-3), and PCM (γ-tubulin). Scale bar, 1 μm. **** P < 0.0001, ns: non-significant.
Figure 3.
Figure 3.
CCDC15 localizes to the centrioles and interacts with inner scaffold proteins. (A) Representative 3D-SIM micrographs are shown for CCDC15 relative to different markers of the centriole and PCM. RPE1 cells were fixed with methanol and stained for CCDC15 and markers for PCM (γ-tubulin and CEP152), proximal end linker (Rootletin and CNAP-1), proximal marker (SAS-6), centriole microtubule wall (polyglutamylated tubulin), and centriole distal end lumen (Centrin-3). The cartoons indicate the relative localization of the indicated proteins at the centrosome. The fluorescence intensity along the line drawn in the micrographs was plotted as a function of the distance along the line. Scale bar, 500 nm. (B) CCDC15 has proximity interactions with centriolar inner core proteins FAM161A, POC5, POC1B, and Centrin-3. HEK293T cells were transiently transfected with V5-BirA* or V5-BirA*-CCDC15. Following 18-h biotin incubation, cells were lysed, and biotinylated proteins were precipitated by streptavidin beads. The initial sample and immunoprecipitated (IP) biotinylated proteins were run on a gel and immunoblotted with fluorescent streptavidin and antibodies against FAM161A, POC5, POC1B, Centrin-3, and V5. (C) CCDC15 interacts with endogenous centriole inner core proteins including FAM161A, POC5, POC1B, and Centrin-3 but not with proximal end protein SAS6. HEK293T cells were transfected with GFP or GFP-CCDC15 plasmids. 24 h after transfection, cell lysates were collected and CCDC15 was precipitated using GBP beads. The initial sample and immunoprecipitated proteins were run on a gel and immunoblotted with indicated proteins and GFP. (D) Displacement of CCDC15 to the microtubules upon coexpression with FAM161A. U2OS cells were transfected with only mNG-CCDC15, mCherry-FAM161A, or both. Cells were fixed with methanol and stained with antibodies against the epitope tags and the microtubule marker α-tubulin. Scale bar, 10 μm. Source data are available for this figure: SourceData F3.
Figure 4.
Figure 4.
CCDC15 localizes to the inner scaffold. (A) Representative confocal images of RPE1 mature centrioles expanded using U-ExM and stained for tubulin (magenta) and CCDC15 (green). Scale bar, 1 μm. (B) Top-view confocal images of RPE1 mature centriole images in U-ExM stained for tubulin in magenta and CCDC15 in green. Scale bar, 1 μm. (C) Respective lengths of tubulin and CCDC15 based on A. Error bars, SD. n > 15 centrioles from two independent experiments. Tubulin: 446 nm ± 45, CCDC15: 250 ± 41 nm. (D) Position of CCDC15 along the centriole with its respective percentage of centriole coverage, which was calculated as 55% based on C. (E) Plot profile of CCDC15 (green) and tubulin (magenta). The distance between the tubulin and CCDC15 rings were calculated as 17 nm ± 2 based on C. (F) Timing of CCDC15 centriolar recruitment during centriole duplication. Representative confocal images of RPE1 centrioles at the different stages of centriole duplication were shown. RPE1 cells synchronized in S/G2 phase were expanded using U-ExM and stained for tubulin (magenta) and CCDC15 (green). Procentriole lengths were indicated below the micrographs. Arrows mark the procentrioles. Scale bar, 1 μm. (G) Quantification of CCDC15 fluorescence intensity at different stages of centriole duplication. Normalized CCDC15 fluorescence intensity at the procentrioles was plotted against procentriole length. CCDC15 fluorescence intensity for each centriole was normalized to the mean CCDC15 fluorescence intensity of all centrioles (=1) quantified per experiment. Error bars, SD. n = 30 centrioles. Data represent mean value from three independent experiment. 0–200 nm: 0.31 ± 27, 200–400 nm: 1.23 ± 0.75, >400 nm: 1.49 ± 0.74. P < 0.0001, ns: non-signficant. P < 0.0001, two-sided t test. **** P < 0.0001, ns: non-significant. (H) Representative confocal images of CCDC15 localization (green) at the basal bodies (magenta) in RPE1 cells serum starved for 24 h and expanded using U-ExM. Scale bar, 1 μm. (I) Expression profile of CCDC15 in synchronized cells. Lysates were run on western blot and immunoblotted with CCDC15, CyclinA2, and GAPDH antibodies. U2OS cells were synchronized at the G1/S transition using a double thymidine (DT) block, then released into the cell cycle. Lysates prepared from cells at different time points were immunoblotted for CCDC15, CyclinA2 (marker for the G2/M phase), and GAPDH (loading control). Arrow marks the band for CCDC15. (J) Quantification of band intensities of CCDC15 and CyclinA2 normalized to the actin (loading control). Data represents mean value from three independent experiments. Error bars, SD. P = 0.0286, two-sided t test. *P < 0.05. Source data are available for this figure: SourceData F4.
Figure S4.
Figure S4.
CCDC15 is required for centriole amplification, but not canonical centriole duplication. (A) Immunofluorescence validation of CCDC15 depletion by siRNA treatment in RPE1 cells. RPE1 cells were transfected with control and CCDC15 siRNAs. 96 h after transfection, cells were fixed with methanol and stained for CCDC15 and γ-tubulin. Error bars, SD. n > 100 cells per experiment. Data represent mean value from three experiments per condition. siControl: 1 ± 0.43, siCCDC15: 0.56 ± 0.55, P < 0.0001, two-sided t test. Scale bar, 10 μm, insets, 2 μm. Statistical analysis was done by normalizing the values to the mean of siControl. Absolute intensity for CCDC15 was not plotted. Instead, intensities were normalized to the average CCDC15 intensity of the control sample. (B) Validation of siRNA-mediated depletion of POC5, POC1B, and FAM161A in RPE1 cells. Cells were transfected with control or POC5, POC1B, and FAM161A siRNAs and extracts from these cells were immunoblotted for the indicated proteins and vinculin as loading control. (C) Cell cycle profile of control and CCD15-depleted RPE1 cells. RPE1 cells were transfected with control and CCDC15 siRNAs. 96 h after transfection, cells were fixed with ethanol and stained with Muse Cell Cycle kit. Error bars, SD. Data represent mean value from two independent experiments per condition. For G0/G1 phase, siControl = 74.20% ± 2.12, siCCDC15 = 79.20% ± 2.83, P = 0.1835%; for S phase, siControl = 6.95% ± 0.78, siCCDC15 = 7.8% ± 0.42, P = 0.3077; for G2/M phase, siControl = 17.80% ± 1.70, siCCDC15 = 13.60% ± 2.12, P = 0.1603, one-way ANOVA. (D) Quantification of centriole number in control or CCDC15 siRNA–transfected asynchronous RPE1 cells. Error bars, SD. n > 100 cells per experiment. Data represent mean value from two independent experiments per condition. Centriole number >4 siControl = 0.71% ± 0.3, siCCDC15 = 0.62% ± 0.5, P = 0.7397, two-sided t test. (E) Representative immunofluorescence images of control and CCDC15-depleted cells stained for SAS6, PCNA, and Centrin-2. DNA was visualized with DAPI. Scale bar, 10 μm, insets, 2 μm. (F) Quantification of SAS6 dots in PCNA-positive cells in D. Error bars, SD. n > 50 cells per experiment. Data represent mean value from three experiments per condition. SAS6 2 dots: siControl = 93% ± 3, siCCDC15 = 88% ± 4, P = 0.1565; SAS6 1 dot: siControl = 8% ± 1, siCCDC15 = 12% ± 4, P = 0.2172, two-sided t test. (G) Representative images of centrioles in control and CCDC15-depleted RPE1 cells synchronized by STLC treatment. Cells were transfected with control and CCDC15 siRNA and treated with 50 µM STLC for 18 h before fixation. Cells were then stained for CCDC15 and Centrin-2. The DNA was visualized with DAPI. Scale bar, 10 μm. (H) Quantification of cells with more than four centrioles based on F. Error bars, SD. n > 100 cells per experiment. Data represent mean value from three experiments per condition. siControl = 95% ± 1, siCCDC15 = 63% ± 4, P = 0.0002, two-sided t test. (I) CCDC15 depletion compromises S phase arrest overduplication of centrioles. U2OS cells were transfected with control siRNA or CCDC15 siRNA and arrested in S phase by hydroxyurea treatment for 48 h. Cells were then stained with CCDC15 and Centrin-3. DNA was visualized with DAPI. Scale bar, 10 μm, insets, 2 μm. (J) Quantification of cells with >4 centrioles based on H. Error bars, SD. n > 100 cells per experiment. Data represent mean value from two experiments per condition. siControl = 42% ± 1, siCCDC15 = 28% ± 2, P = 0.0148, two-sided t test. (K) CCDC15 depletion compromises PLK4-induced centriole amplification. RPE-1 cells stably expressing Tet-inducible Plk4 were depleted of CCDC15 by siRNA for 72 h then treated with doxycycline for 18 h to induce Plk4 expression. Cells were fixed and stained for PLK4, Centrin-2, and γ-tubulin. DNA was visualized with DAPI. Scale bar, 10 μm. (L) Quantification of cells with more than four centriole dots based on J. Error bars, SD. n > 100 cells per experiment. Data represent mean value from three experiments per condition. siControl = 83% ± 9, siCCDC15 = 41% ± 6, P = 0.0024, two-sided t test. * P < 0.05, ** P < 0.01, *** P < 0.001, **** P < 0.0001, ns: non-significant. Source data are available for this figure: SourceData FS4.
Figure 5.
Figure 5.
CCDC15 depletion leads to shorter and structurally aberrant centrioles. (A) CCDC15 depletion leads to shorter centrioles. Representative confocal images of expanded centrioles from control and CCDC15-depleted cells stained for CCDC15 (green) and tubulin (magenta). RPE1 cells were transfected with control or CCDC15 siRNA. 96 h after transfection, cells were expanded by U-ExM. Note that CCDC15 was efficiently depleted from only one of the centrioles in most cells (white arrow). Scale bar, 200 nm. (B) Quantification of percentage of CCDC15-positive centrioles based on A. n > 40 centrioles per experiment. Data represents mean value from three independent experiments. Error bars, SD. siControl = 100%, siCCDC15 = 48% ± 4. P = 0.0031, two-sided t test. (C) Centriole length quantification based on A. Error bars, SD. n > 10 centrioles per experiment. Data represents mean value from three independent experiments. siControl: 413 nm ± 66, siCCDC15: 367 nm ± 62. P = 0.0001, two-sided t test. Centrioles depleted of CCDC15 were 45 nm shorter compared with control centrioles in RPE1 cells. (D) Changes in diameter in distal (d), central (c), and proximal (p) regions of the centrioles. RPE1 cells were transfected with control or CCDC15 siRNA and expanded by U-ExM 96 h after transfection. Gels were stained with tubulin (magenta) and endogenous CCDC15 (green) antibodies. Scale bar, 200 nm. (E) Quantification of D. Error bars, SD. n > 10 centrioles per experiment. Data represents mean value from three independent experiments. Distal region: siControl: 222 nm ± 26, siCCDC15: 232 nm ± 25, P = 0.0828; core region siControl: 233 nm ± 23, siCCDC15: 247 nm ± 28, P = 0.0204; proximal region siControl: 242 nm ± 23, siCCDC15: 242 nm ± 27, P = 0.9856, two-sided t test. (F) Representative confocal images of expanded centrioles in control and CCDC15-depleted RPE1 cells stained for CCDC15 (green) and tubulin (magenta). Different types of structural defects of CCDC15-depleted cells were represented, which included centrioles with broken, wider or shorter microtubule walls. Scale bar, 200 nm. (G) Depletion of POC1B and POC5 lead to shorter centrioles while FAM161A has no effect. Representative confocal images of expanded centrioles from control, POC1B, POC5, and FAM161A-depleted cells stained for tubulin (magenta). RPE1 cells were transfected with control, POC1B, POC5, and FAM161A siRNA. 48 h for POC1B and POC5 and 76 h for FAM161A after transfection, cells were expanded by U-ExM. Scale bar, 200 nm. (H) Centriole length quantification based on G. Error bars, SD. n > 10 centrioles per experiment. Data represents mean value from three independent experiments. POC1B: siControl: 400.6 nm ± 36.1, siPOC1B: 341.5 ± 44.39 nm, P < 0.0001; POC5: siControl: 414.1 nm ± 38.3, siPOC5: 432.7 nm ± 44.8, P = 0.0647, FAM161A: siControl: 447.8 nm ± 59.7, siFAM161A: 436.3 nm ± 64, P = 0.3549, two-sided t test. * P < 0.05, *** P < 0.001, **** P < 0.0001, ns: non-significant.
Figure 6.
Figure 6.
CCDC15 is required for recruitment of inner scaffold proteins to the centriole central core and distal end. (A) Representative U-ExM images of centriolar core proteins POC5 (orange), FAM161A (gray), POC1B (blue), and Centrin-2 (green) in control or CCDC15-depleted RPE1 cells. Cells were expanded 96 h after siRNA transfection and immunostained with the indicated antibodies for inner core proteins and tubulin (magenta) for centrioles. Top view of centrioles for Centrin-2 was represented in addition to the longitudinal views represented for all proteins. Scale bar, 200 nm. (B) Quantification of coverages of the centriolar proteins in A. Error bars, SD. n > 20 centrioles per experiment. Data represent mean value from two independent experiments per condition. POC5 coverage: siControl = 52% ± 10, siCCDC15 = 58% ± 12, P = 0.0174; FAM161A coverage: siControl = 50% ± 14, siCCDC15 = 53% ± 15, P = 0.2981; POC1B coverage: siControl = 62% ± 12, siCCDC15 = 53% ± 12, P = 0.0006; Centrin-2 coverage: siControl = 60% ± 12, siCCDC15 = 61% ± 9, P = 0.7254, two-sided t test. (C) Quantification of centrioles positive for Centrin-2 at the distal region of centrioles in control or CCDC15-depleted RPE1 cells based on A. Error bars, SD. n > 20 centrioles per experiment. Data represent mean value from three independent experiments per condition. siControl = 81.25% ± 3, siCCDC15 = 52.46% ± 0.96, P < 0.0001, two-sided t test. (D) Representative U-ExM images of SFI1 protein in control, CCDC15, and POC5 siRNA-depleted RPE1 cells. Cells were expanded and immunostained with SFI1 (green) and tubulin (magenta) antibodies. Scale bar, 200 nm. (E) Quantification of centrioles positive for SFI1 at the distal region of centrioles in control and CCDC15-depleted RPE1 cells based on D. Error bars, SD. n > 20 centrioles per experiment. Data represent mean value from three independent experiments per condition. siControl = 93.25% ± 0.1, siCCDC15 = 56.38% ± 2.2, P < 0.0001; siControl = 96.5% ± 1.5, siPOC5 = 96.4% ± 1.5, P = 0.9625, two-sided t test. (F) Representative U-ExM images of coverages of CCDC15 in control, POC5, POC1B, and FAM161A-depleted RPE1 cells. Cells were expanded and immunostained with CCDC15 (green) and tubulin (magenta) antibodies. Scale bar, 200 nm. (G) Quantification of CCDC15 coverage with respect to tubulin represented in in control, POC5, POC1B, and FAM161A-depleted RPE1 cells represented in F. Error bars, SD. n > 10 centrioles per experiment. Data represent mean value from three independent experiments per condition. siControl = 48.5% ± 11, siPOC1B = 40.6% ± 12.4, P = 0.0062; siPOC5 = 53.1% ± 8.2, P = 0.0538; siFAM61A = 48.8% ± 10.8, non-significant, two-sided t test. (H) Representative U-ExM images of centrioles from RPE1 cells transfected with control siRNA or CCDC15 and POC1B siRNAs together. Cells were stained for CCDC15 and POC1B in green and tubulin in magenta. Scale bar, 500 nm. (I) Representative U-ExM images of defective centrioles in CCDC15 and POC1B co-depleted cells. Cells were costained with CCDC15 and POC1B in green and tubulin in magenta. Scale bar, 500 nm. (J) Centriole length quantification of I. Error bars, SD. n > 15 centrioles per experiment. Data represents mean value from two independent experiment. siControl: 1 ± 0.13, siCCDC15: 0.87 ± 0.11, P < 0.0001, siCCDC15/siPOC1B: 0.84 ± 0.10, P = 0.2588, two-sided t test. Statistical analysis was done by normalizing the values to the mean of siControl. (K) Percentage of cells with defective centrioles for the indicated cells in CCDC15 and POC1B co-depleted cells. n > 15 centrioles per experiment. Error bars, SD. Data represents mean value from two independent experiments. siControl = 3.35% ± 1.1, siCCDC15 = 12% ± 0.28, siCCDC15/siPOC5 = 23.5% ± 1.13. For siControl-siCCDC15 P = 0.0080, for siCCDC15-siCCDC15/POC1B P = 0.0051, for siControl-siCCDC15/siPOC1B P = 0.0029, two-sided t test. * P < 0.05, ** P < 0.01, *** P < 0.001, **** P < 0.0001, ns: non-significant.
Figure S5.
Figure S5.
CCDC15 and inner scaffold proteins depend on each other for centrosomal abundance. (A–E) Representative images and quantification of effect of CCDC15 depletion on centrosomal levels of (A) POC1B and Centrin-2 (for POC1B, siControl = 1 ± 0.45 siCCDC15 = 0.62 ± 0.35, P < 0.0001; and for Centrin-2, siControl = 1 ± 0.38, siCCDC15 = 0.97 ± 0.35, P = 0.2083); (B) POC5 (siControl = 1 ± 0.01, siCCDC15 = 1.15 ± 0.06, P < 0.0001); (C) FAM161A (siControl = 1 ± 0.57, siCCDC15 = 0.97 ± 0.58, P = 0.6618); (D) CEP63 (siControl = 1 ± 0.23, siCCDC15 = 0.96 ± 0.17, P = 0.2143); and (E) CEP164 (siControl = 1 ± 0.14, siCCDC15 = 0.98 ± 0.16, P = 0.5910). RPE1 cells were fixed 96 h after transfection with control or CCDC15 siRNA and stained for the indicated proteins. DNA was visualized with DAPI. Error bars, SD. n > 100 cells per experiment. Data represent mean value from three experiments per condition. Two-sided t test. Scale bar, 1 μm, insets, 0.5 μm. (F) Representative images of the effect of POC5, POC1B, or FAM161A depletion on centrosomal levels of CCDC15. RPE1 cells were fixed 96 h after transfection with the indicated siRNAs and stained for CCDC15, Cenrin-2, and γ-tubulin. DNA was visualized with DAPI. Scale bar, 5 μm. (G) Quantification of CCDC15 centrosomal intensity based on F. Error bars, SD. n > 100 cells per experiment. Data represent mean value from three experiments per condition. siControl = 1 ± 0.4; siPOC1B = 0.44 ± 0.32; siPOC5 = 1.3 ± 0.53; siFAM161A = 0.64 ± 0.24, P < 0.0001, two-sided t test. **** P < 0.0001, ns: non-significant.
Figure 7.
Figure 7.
CCDC15 depletion results in reduced ciliation and inefficient redistribution of signaling proteins in response to Hedgehog stimulus. (A) Representative immunofluorescence images of ciliogenesis defects in RPE1 cells. Cells were transfected with control or CCDC15 siRNA. 72 h after transfection, cells were serum-starved for 24 h, fixed, and immunostained for the primary cilium with acetylated tubulin antibody (Acet-tubulin) and the centrosome with γ-tubulin antibody. DNA was visualized with DAPI. Yellow dashed boxeds mark the zoomed-in primary cilium. Scale bar, 10 μm, insets, 2 μm. (B and C) Quantification of ciliogenesis efficiency and length for A. Error bars, SD. n > 100 cells per experiment. Data represent mean value from three experiments per condition. Ciliation percentage: siControl = 70% ± 6, siCCDC15 = 46% ± 0.8, P = 0.0027. Cilium length: siControl = 3 μm ± 0.7, siCCDC15 = 2.3 μm ± 0.4, P < 0.0001, two-sided t test. (D) Representative U-ExM images of control and CCDC15-depleted RPE1 cells serum starved for 24 h. Centrioles and primary cilium were stained with tubulin (magenta) antibody and CCDC15 (green). Different ciliary defects associated with basal bodies efficiently depleted for CCDC15 were represented (panel on the right). Scale bar, 200 nm. (E) Representative immunofluorescence images of the effect of CCDC15 depletion on ciliary recruitment of SMO. Control and CCDC15 siRNA–depleted RPE1 cells were treated with 200 nM SAG for 24 h, fixed and stained for SMO, acetylated tubulin (Ac-tub), and DAPI. Yellow dashed boxes mark the zoomed-in primary cilium. Scale bar, 10 μm, insets, 1 μm. (F) Quantification of E. Error bars, SD. n > 50 cells per experiment. Data represent mean value from three independent experiments. SMO-positive cilia: siControl 56% ± 1, siCCDC15 25% ± 6, P = 0.0003, two-sided t test. (G) Representative images of the effect of CCDC15 depletion on basal body levels of IFT88. RPE1 cells were transfected with control or CCDC15 siRNA, fixed and stained for IFT88, acetylated tubulin, and γ-tubulin. DNA was visualized with DAPI. Yellow dashed boxes mark the zoomed-in primary cilium. Scale bar, 10 μm, insets, 1 μm. (H) Quantification of G. Graphs indicate IFT88 levels normalized to γ-tubulin levels at the basal body. Error bars, SD. n > 50 cells per experiment. Data represent the mean of three independent experiments. siControl = 1 ± 0.34, siCCDC15 = 0.67 ± 0.37. P < 0.0001, two-sided t test. ** P < 0.01, *** P < 0.001, **** P < 0.0001, ns: non-significant.

Similar articles

Cited by

References

    1. Abal, M., Keryer G., and Bornens M.. 2005. Centrioles resist forces applied on centrosomes during G2/M transition. Biol. Cell. 97:425–434. 10.1042/BC20040112 - DOI - PubMed
    1. Arquint, C., Gabryjonczyk A.M., and Nigg E.A.. 2014. Centrosomes as signalling centres. Philos. Trans. R. Soc. Lond. B Biol. Sci. 369:20130464. 10.1098/rstb.2013.0464 - DOI - PMC - PubMed
    1. Arslanhan, M.D., Rauniyar N., Yates J.R. III, and Firat-Karalar E.N.. 2021. Aurora Kinase A proximity map reveals centriolar satellites as regulators of its ciliary function. EMBO Rep. 22:e51902. 10.15252/embr.202051902 - DOI - PMC - PubMed
    1. Atorino, E.S., Hata S., Funaya C., Neuner A., and Schiebel E.. 2020. CEP44 ensures the formation of bona fide centriole wall, a requirement for the centriole-to-centrosome conversion. Nat. Commun. 11:903. 10.1038/s41467-020-14767-2 - DOI - PMC - PubMed
    1. Aydogan, M.G., Hankins L.E., Steinacker T.L., Mofatteh M., Saurya S., Wainman A., Wong S.S., Lu X., Zhou F.Y., and Raff J.W.. 2022. Centriole distal-end proteins CP110 and Cep97 influence centriole cartwheel growth at the proximal end. J. Cell Sci. 135:jcs260015. 10.1242/jcs.260015 - DOI - PMC - PubMed

Publication types

Substances