. 2023 Nov 28;17(22):22800-22820.
doi: 10.1021/acsnano.3c07517. Epub 2023 Nov 7.

Platinum Nanozymes Counteract Photoreceptor Degeneration and Retina Inflammation in a Light-Damage Model of Age-Related Macular Degeneration

Affiliations

Platinum Nanozymes Counteract Photoreceptor Degeneration and Retina Inflammation in a Light-Damage Model of Age-Related Macular Degeneration

Sara Cupini et al. ACS Nano. .

Abstract

Degeneration of photoreceptors in age-related macular degeneration (AMD) is associated with oxidative stress due to the intense aerobic metabolism of rods and cones that if not properly counterbalanced by endogenous antioxidant mechanisms can precipitate photoreceptor degeneration. In spite of being a priority eye disease for its high incidence in the elderly, no effective treatments for AMD exist. While systemic administration of antioxidants has been unsuccessful in slowing down degeneration, locally administered rare-earth nanoparticles were shown to be effective in preventing retinal photo-oxidative damage. However, because of inherent problems of dispersion in biological media, limited antioxidant power, and short lifetimes, these NPs are still confined to the preclinical stage. Here we propose platinum nanoparticles (PtNPs), potent antioxidant nanozymes, as a therapeutic tool for AMD. PtNPs exhibit high catalytic activity at minimal concentrations and protect primary neurons against oxidative insults and the ensuing apoptosis. We tested the efficacy of intravitreally injected PtNPs in preventing or mitigating light damage produced in dark-reared albino Sprague-Dawley rats by in vivo electroretinography (ERG) and ex vivo retina morphology and electrophysiology. We found that both preventive and postlesional treatments with PtNPs increased the amplitude of ERG responses to light stimuli. Ex vivo recordings demonstrated the selective preservation of ON retinal ganglion cell responses to light stimulation in lesioned retinas treated with PtNPs. PtNPs administered after light damage significantly preserved the number of photoreceptors and inhibited the inflammatory response to degeneration, while the preventive treatment had a milder effect. The data indicate that PtNPs can effectively break the vicious cycle linking oxidative stress, degeneration, and inflammation by exerting antioxidant and anti-inflammatory actions. The increased photoreceptor survival and visual performances in degenerated retinas, together with their high biocompatibility, make PtNPs a potential strategy to cure AMD.

Keywords: Müller cells; electroretinogram; high-density multielectrode arrays; microglia; nanoparticles; oxidative stress; photoreceptor death.


Conflict of interest statement

The authors declare no competing financial interest.

Figures

Figure 1
Figure 1
Physical–chemical and biological characterization of platinum nanozymes. (A) Representative TEM micrograph of RSA-coated PtNPs (scale bar, 50 nm) and statistical size analysis (at least 200 NPs were counted). (B) Gel-shift assay in 2.5% agarose gel. The gels are shown in bright-field (top) and UV-transillumination (bottom) modes. In the first lane, the electrophoretic run of citrate-stabilized PtNPs is shown. In the second lane, a delayed electrophoretic run of the RSA-coated PtNPs can be observed. In the transillumination mode, the excess of unbound RSA (black band) is visible. (C) Evaluation of CAT-like activity through overtime monitoring of the oxygen gas developed by the reaction (see Methods). In a vial presenting 20% O2 (air), colloidal suspensions of citrate-stabilized PtNPs (cit-PtNPs, 0.2 ppm) and citrate-stabilized CeO2 NPs (cit-CeO2 NPs, 1000 ppm) were exposed to H2O2 (500 mM). The observed O2 % induced by the CAT-like activity of PtNPs reached 70%, while that induced by CeO2 NPs (5000-fold more concentrated) was 30% after 100 min. (D, E) Effect of PtNPs on the recovery of chemically induced ROS and apoptosis in primary rat cortex neurons. Treatments with 1 mM H2O2 for 5 min (D) and 5 μM antimycin A for 24 h (E) were used to induce ROS in the culture. ROS values were measured by using appropriate fluorescent probes (H2DCF and DHE, respectively). Apoptosis was measured through caspase 3/7 activity. Results are reported as means ± sem from n = 3 independent experiments and are normalized over untreated controls. **p < 0.01, ***p < 0.001, ****p < 0.0001; one-way ANOVA/Tukey’s tests. In all cases, neurons pretreated with 50 μg/mL RSA-coated PtNPs for 48 h showed a significant recovery of ROS amounts and apoptosis. (F) Representative TEM image of RSA-coated PtNPs internalized in primary rat cortex neurons (scale bar, 1 μm). Two representative intracellular vesicles containing PtNPs are indicated with numbers and magnified. Scale bars of magnified vesicles are 200 nm. N denotes the nucleus. (G) Estimated NP uptake quantification per cell from ICP-MS measurements. The uptake of RSA-coated PtNPs is significantly higher than that of citrate-stabilized PtNPs.
Figure 2
Figure 2
Morphofunctional characterization of the light-damage model of atrophic macular degeneration. (A) Schematic representation of the retinal circuitry and of the neuronal components responsible for the generation of the flash-electroretinogram (fERG) responses. The A-wave reflects the photoactivation of the PRs following a flash, while the B-wave is correlated to the propagation of the electrical stimuli from PRs to second-order neurons. (B) Morphological alterations and retinal function impairment assessed in albino SD rats reared in dim light (5–10 Lux) at two recovery times (7 and 15 days) after the light-induced retina lesion (24 h of light exposure to 1000 lux). Representative images labeled with bisbenzimide (white) of the hotspot in the dorsal retina (upper row), dorsal periphery (middle row), and ventral retina (lower row) of healthy rats and of rats that had been light-damaged for 24 h and analyzed 7 days (Ld 24H 7d) and 15 days (Ld 24H 15d) after the lesion. Of note, the presence of rosettes in Ld 24H 15d and photoreceptor loss were found in both lesioned groups, while no major changes were detected in the ventral retina. (C) The ONL thickness, normalized to the total retinal thickness (means ± sem), was calculated at 20 equidistant retinal positions from the dorsal periphery to the ventral periphery passing through the optic nerve (ON). The light damage causes a strong thinning of the ONL in the dorsal central retina (hotspot), where PRs are irreversibly damaged, surrounded by a penumbra area where degeneration can progressively spread (red box). Sample size: Healthy, n = 6; Ld 24H 7d, n = 6; Ld 24H 15d, n = 5. (D) Amplitudes (means ± sem) of the A-wave (left) and the B-wave (right) are plotted on a semilogarithmic scale as a function of the stimulus intensity (ranging from 0.001 to 10 cd m2 s–1). The exposure at 1000 lux for 24 h strongly reduces both fERG components in the lesioned animals. Sample size: Healthy, n = 8; Ld 24H 7d, n = 4; Ld 24H 15d, n = 4. Abbreviations: ONL, outer nuclear layer; INL, inner nuclear layer; GCL, ganglion cell layer. Scale bar: 20 μm.
Figure 3
Figure 3
Effects of the preventive treatment with PtNPs on the electrical activity of light-damaged retinas. (A) Timeline of the experiments. Two-month-old albino SD rats reared in dim light were intravitreally injected with 2 μL of either PtNPs or vehicle (RSA). One week later, the animals were subjected to photo-oxidative damage by exposure to 1000 lux for 24 h. Fifteen days after the injection, fERG recordings were performed, and the retinal tissues were collected for morphological analyses (Imaging). (B, C) The amplitudes (means ± sem) of the A-wave (B) and the B-wave (C) are plotted on a semilogarithmic scale as a function of the stimulus intensity (ranging from 0.001 to 10 cd m2 s–1) for animals injected with either vehicle (blue) or PtNPs (red) before the light damage. Lesioned animals injected with PtNPs perform better than vehicle-injected animals, particularly for the B-wave at higher luminances, indicating an effect of PtNPs at the level of the photoreceptor/second-order neuron synapses. Sample size: n = 14 for both vehicle and PtNPs. *p < 0.05; two-way mixed ANOVA/Holm-Šídák’s multiple comparisons tests. (D) Correlation between the B-wave ratio (i.e., the amplitude of the experimentally recorded B-wave normalized by the healthy B-wave amplitude deduced from the A-wave amplitude) and the A-wave amplitude in lesioned animals injected with either vehicle (blue) or PtNPs (red) before light damage. The Pearson’s correlation coefficients (r) of the linear regression line are shown in the plot. (E) Cumulative distribution of the B/A wave ratios plotted in (D). p < 0.0001, Kolmogorov–Smirnov test.
Figure 4
Figure 4
Effects of the preventive treatment with PtNPs on the morphology of light-damaged retinas. (A) Representative images of the dorsal periphery, hotspot, and ventral retina, labeled with bisbenzimide for nuclear labeling (white) and immunostained for the Müller cell marker GFAP (green). The images show only a slight effect on the ONL thickness in the dorsal retina in PtNP-pretreated animals compared with the vehicle-treated littermates. Abbreviations: ONL, outer nuclear layer; INL, inner nuclear layer; GCL, ganglion cell layer. Scale bar: 20 μm. (B, C) The ONL thickness normalized to the total retinal thickness (B) and the number of photoreceptor nuclear rows (C) are plotted at 20 equidistant retinal positions from the dorsal periphery to the ventral periphery passing through the optic nerve (ON) for animals injected with either vehicle (blue) or PtNPs (red) before light damage. Data are expressed as means ± sem. Colored boxes represent the corresponding analyzed areas shown in (A). Sample size: n = 14 for both vehicle and PtNPs. Two-way mixed ANOVA/Fisher’s LSD test. (D) Quantitative analysis of the integrated density of GFAP expression in the dorsal periphery (left; n = 14 and 12 for vehicle and PtNPs, respectively), hotspot (middle; n = 13 for both experimental groups), and ventral retina (right; n = 12 and 13 for vehicle and PtNPs, respectively). Bar plots represent the means ± sem with superimposed individual experimental points. PtNPs significantly reduce the GFAP expression in the dorsal periphery. ns, p > 0.05; *p < 0.05; Mann–Whitney U-test/unpaired Student t-test.
Figure 5
Figure 5
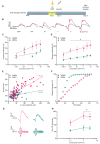
Effects of the postlesional treatment with PtNPs on the electrical activity of light-damaged retinas. (A) Timeline of the experiments. Two-month-old albino SD rats reared in dim light were subjected to photo-oxidative damage by exposure to 1000 lux for 24 h and, 48 h later, intravitreally injected with 2 μL of either PtNPs or vehicle (RSA). Fifteen days after the light damage, fERG recordings were performed, and the retinal tissues were collected for ex vivo electrophysiological (HD-MEA) and morphological analyses (Imaging). (B) Representative fERG traces evoked by light flashes of increasing luminance highlight the difference in the two groups for all tested luminances in animals injected with either vehicle (blue) or PtNPs (red) 24 h after light damage. (C, D) The amplitudes (means ± sem) of the A-wave (C) and the B-wave (D) are plotted on a semilogarithmic scale as a function of the stimulus intensity (ranging from 0.001 to 10 cd*m2*s–1) for animals injected with either vehicle (blue) or PtNPs (red) 24 h after light damage. At all tested luminances, the animals injected with PtNPs show larger amplitudes than vehicle-injected animals, particularly for the B-wave, suggesting a positive effect of PtNPs in preserving retinal function, even after severe light damage. E. Correlation between the B-wave ratio (i.e., the amplitude of the experimentally recorded B-wave normalized by the healthy B-wave amplitude deduced from the A-wave amplitude) and the A-wave amplitude in lesioned animals injected with either vehicle (blue) or PtNPs (red) after the light damage. The Pearson’s correlation coefficients (r) of the linear regression line are shown in the plot. (F) Cumulative distribution of the B/A wave ratios plotted in (D). The difference between the two experimental groups suggests the ability of PtNPs to preserve both an efficient synaptic transmission between PRs and second-order neurons and an enhanced PRs activation. p < 0.0001, Kolmogorov–Smirnov test. (G, H) Representative recordings (G) and mean (±sem) sum of amplitudes (H) of oscillatory potentials as a function of luminance (0.1, 1, and 3 cd m2 s–1) in PtNP- and vehicle-treated animals. Peaks of OPs are labeled with black dots. Sample size: vehicle, n = 14; PtNPs, n = 16. *p < 0.05; two-way mixed ANOVA/Holm-Šídák’s tests (C, D, H).
Figure 6
Figure 6
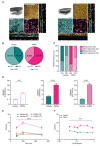
Effects of the postlesional treatment with PtNPs on retinal ganglion cell firing in the dorsal light-damaged retina. (A) Upper left panel: 3D reconstruction of representative dorsal hemiretinas from vehicle (left)- and PtNP (right)-treated rats 24 h after the light damage (scale bar, 50 μm). Other panels: Z-axis magnification of each retinal layer and the orthogonal XZ, YZ projections (scale bar: 20 μm). The PtNP treatment ameliorates the retinal architecture, which is notably altered in vehicle-treated retinas due to ongoing degeneration. (B) Pie charts showing the percentage of ON (dark color) and OFF (light color) RGCs on the total number of active cells recorded for each dorsal hemiretina in vehicle- (blue)- and PtNP (red)-treated rats 24 h after the light damage. Of note, there is a higher occurrence of active ON-RGCs in the PtNP-treated retinas (p < 0.0001, Fisher’s exact test). (C) Percentage of responsive cells for each RGC polarity. ON-RCGs are more responsive in both groups. Treatment with PtNPs further increases the percentage of responsive ON-RGCs, while no differences are observed for OFF-RGCs. (D) Bar plots (means ± sem) of the spiking activity of total RGCs (left; n = 607 and 213 cells for vehicle and PtNPs, respectively), ON-RGCs (middle; n = 242 and 131 cells for vehicle and PtNPs, respectively), and OFF-RGCs (right; n = 365 and 82 cells for vehicle and PtNPs, respectively) in response to a 250 ms full-field flash stimulation in dorsal hemiretinas from vehicle (blue)- and PtNP (red)-treated rats 24 h after the light damage. These graphs reveal an increment for the PtNP-treated retinas and display a generalized and significant increase in RGC firing activity. (E) Temporal dynamics of RGC firing evoked by full-field flash stimulation. While no difference is present for the OFF-RGCs, significantly higher spiking activity is evident for the ON-RGCs of the PtNP-treated, but not vehicle-treated, retinas. (F) RGC spiking activity evoked by reverting gratings with spatial frequency ranging from 0.2 to 0.8 cpd to assess spatial discrimination capabilities. The light-lesioned retina treated with PtNPs displays a significant increase in spatial resolution at all tested frequencies with respect to vehicle-treated retinas. **p < 0.01, ***p < 0.001, ****p < 0.0001; Mann–Whitney U-test (D), two-way mixed ANOVA/Holm-Šídák’s tests (E, PtNPs ON-RGCs versus vehicle ON-RGCs; F, PtNPs versus vehicle).
Figure 7
Figure 7
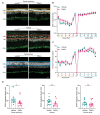
Effects of the postlesional treatment with PtNPs on the morphology of light-damaged retinas. (A–D) Representative cross sections of the dorsal periphery, hotspot, and ventral retina, labeled with bisbenzimide for nuclear labeling (white). Abbreviations: ONL, outer nuclear layer; INL, inner nuclear layer; GCL, ganglion cell layer. Scale bar: 20 μm. (E, F) The ONL thickness normalized to the total retinal thickness (E) and the number of photoreceptor nuclear rows (F) are plotted at 20 equidistant retinal positions from the dorsal periphery to the ventral periphery passing through the optic nerve (ON) for animals injected with either vehicle (blue) or PtNPs (red) 24 h after light damage. Data are expressed as means ± sem. Sample size: vehicle, n = 8; PtNPs, n = 10. *p < 0.05, **p < 0.01, ***p < 0.001; two-way mixed ANOVA/Fisher’s LSD tests. PtNPs significantly preserve both the ONL thickness and the number of PRs in the dorsal retina periphery, limiting the extension of the damaged area at the hotspot level only and preventing the spread of the degeneration to the penumbra area. The ventral area is not affected by light damage.
Figure 8
Figure 8
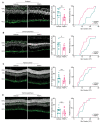
Effects of the postlesional treatment with PtNPs on astrocyte activation in light-damaged retinas. (A–D) Retinas from animals injected with either vehicle (blue) or PtNPs (red) 24 h after the light damage were analyzed for GFAP expression in the hotspot (A) and periphery (B) of the dorsal retina and in the center (C) and periphery (D) of the ventral retina. Left panels: representative retinal cross sections immunolabeled for the Müller cell marker GFAP (green) merged with bisbenzimide nuclear labeling (white). Abbreviations: ONL, outer nuclear layer; INL, inner nuclear layer; GCL, ganglion cell layer. Scale bar, 20 μm. Middle panels: quantitative analysis of the integrated density of GFAP expression. Bar plots represent the means ± sem with superimposed individual experimental points. PtNPs significantly reduce the extent of the GFAP expression in the dorsal retina. Sample size: vehicle, n = 10; PtNPs, n = 10. *p < 0.05, **p < 0.01; Mann–Whitney U-test/unpaired Student t-test. Right panels: corresponding cumulative frequency distribution curves (binning width: 10000). PtNP injection significantly reduced the upregulation of GFAP in the Müller cells both in the hotspot and in the adjacent dorsal periphery with respect to vehicle-treated retinas (A, p = 0.015; B, p = 0.078; Kolmogorov–Smirnov test). No differences are present between the two experimental groups in the ventral areas (C, p = 0.699; D, p = 0.699; Kolmogorov–Smirnov test).
Figure 9
Figure 9
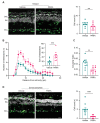
Effects of the postlesional treatment with PtNPs on the activation of microglia in light-damaged retinas. Retinas from animals injected with either vehicle (blue) or PtNPs (red) 24 h after the light damage were immunolabeled for the microglial marker IBA1 (green) merged with bisbenzimide nuclear labeling (white). Abbreviations: ONL, outer nuclear layer; INL, inner nuclear layer; GCL, ganglion cell layer. Scale bar: 20 μm. (A) Dorsal retina hotspot. Representative IBA1-stained cross sections (left) and bar plot of the mean (±sem) number of IBA1-positive microglial cells counted in the ONL with superimposed individual experimental points (right). (B) Sholl analysis showing the mean (±sem) number of intersections of microglial processes with shells drawn at increasing distances from the soma. Inset: bar plot showing the mean (±sem) sum of intersections calculated from the cell body to the maximal branch extension. (C) Circularity index of microglial cells in the ONL of the hotspot in the dorsal retina. The index was calculated using the Fiji software plugin. A circularity value of 1.0 indicates a perfect circle, while its decrease toward zero indicates an increasingly elongated polygon. Bar plots represent the means (±sem) with superimposed individual experimental points. The more elongated and polygonal-like shape observed in the PtNP group reveals decreased activation of the microglial cells. (D) Dorsal retina periphery. Representative IBA1-stained cross sections (left) and bar plot of the mean (±sem) number of IBA1-positive microglial cells counted in the ONL with superimposed individual experimental points (right). Microglial cells usually reside in the inner retina playing a surveillance role. After light damage and photoreceptor degeneration, microglial cells migrate to the outer retina, retracting pedicles and assuming a more amoeboid shape. PtNPs significantly reduce their infiltration in the ONL. Sample size: vehicle, n = 10; PtNPs, n = 9. **p < 0.01, ***p < 0.001, unpaired Student t-test (A–C), Mann–Whitney U-test (D).

References

    1. Sies H. Hydrogen peroxide as a central redox signaling molecule in physiological oxidative stress: Oxidative eustress. Redox Biology 2017, 11, 613–619. 10.1016/j.redox.2016.12.035. - DOI - PMC - PubMed
    1. Yu D.-Y.; Cringle S. J. Retinal degeneration and local oxygen metabolism. Exp. Eye Res. 2005, 80, 745–751. 10.1016/j.exer.2005.01.018. - DOI - PubMed
    1. Kunchithapautham K.; Rohrer B. Apoptosis and autophagy in photoreceptors exposed to oxidative stress. Autophagy 2007, 3, 433–441. 10.4161/auto.4294. - DOI - PubMed
    1. Bardi G.; Boselli L.; Pompa P. P. Anti-inflammatory potential of platinum nanozymes: mechanisms and perspectives. Nanoscale 2023, 15, 14284.10.1039/D3NR03016D. - DOI - PubMed
    1. Mariotti A.; Pascolini D. Global estimates of visual impairment. Br J. Ophthalmol 2012, 96, 614–618. 10.1136/bjophthalmol-2011-300539. - DOI - PubMed

Publication types