Clinical Trial
. 2024 Jan 16;134(2):e175369.
doi: 10.1172/JCI175369.

Durable responses to ATR inhibition with ceralasertib in tumors with genomic defects and high inflammation

Affiliations
Clinical Trial

Durable responses to ATR inhibition with ceralasertib in tumors with genomic defects and high inflammation

Magnus T Dillon et al. J Clin Invest. .

Abstract

BACKGROUNDPhase 1 study of ATRinhibition alone or with radiation therapy (PATRIOT) was a first-in-human phase I study of the oral ATR (ataxia telangiectasia and Rad3-related) inhibitor ceralasertib (AZD6738) in advanced solid tumors.METHODSThe primary objective was safety. Secondary objectives included assessment of antitumor responses and pharmacokinetic (PK) and pharmacodynamic (PD) studies. Sixty-seven patients received 20-240 mg ceralasertib BD continuously or intermittently (14 of a 28-day cycle).RESULTSIntermittent dosing was better tolerated than continuous, which was associated with dose-limiting hematological toxicity. The recommended phase 2 dose of ceralasertib was 160 mg twice daily for 2 weeks in a 4-weekly cycle. Modulation of target and increased DNA damage were identified in tumor and surrogate PD. There were 5 (8%) confirmed partial responses (PRs) (40-240 mg BD), 34 (52%) stable disease (SD), including 1 unconfirmed PR, and 27 (41%) progressive disease. Durable responses were seen in tumors with loss of AT-rich interactive domain-containing protein 1A (ARID1A) and DNA damage-response defects. Treatment-modulated tumor and systemic immune markers and responding tumors were more immune inflamed than nonresponding.CONCLUSIONCeralasertib monotherapy was tolerated at 160 mg BD intermittently and associated with antitumor activity.TRIAL REGISTRATIONClinicaltrials.gov: NCT02223923, EudraCT: 2013-003994-84.FUNDINGCancer Research UK, AstraZeneca, UK Department of Health (National Institute for Health Research), Rosetrees Trust, Experimental Cancer Medicine Centre.

Keywords: Cancer immunotherapy; DNA repair; Drug therapy; Oncology.


Figures

Figure 1
Figure 1. Study design.
(A) CONSORT diagram of study parts A and B. (B) Schematic of role of ATR in DDR signaling. (C) Study schema for parts A and B. For part A, all patients received continuous dosing. For part B, they received continuous or intermittent dosing. Part B patients had mandatory tumor biopsy at baseline. All patients had PD sampling (PBMC, hair follicles) at baseline and at days 14–22. Response assessment was after 2 cycles of treatment.
Figure 2
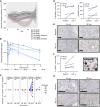
Figure 2. PKs and PDs.
(A) Change in platelet count with time, by dose cohort. Smoothed conditional mean absolute changes compared with baseline blood count are presented, with 95% CI. (B) Ceralasertib PK. Geometric mean (and SD) plasma concentration over time after a single dose at the indicated dose levels (semi-log scale). (C) Absolute change in γH2AX-positive PBMCs (defined as percentage of cells with >5 foci) after 2-week dosing at the indicated dose levels. Line color indicates RECIST response. *P = 0.046, Wilcoxon’s signed rank test with a hypothetical median of 0. (D) Tumor PDs. Change in p-(S635)Rad50 in paired tumor biopsies after 2-week dosing. p-Rad50 in tumor cells expressed by percentage positive (left) and H score (right) for the indicated dose levels. Fold change versus baseline. P = 0.13, Wilcoxon’s signed rank test. (E) Examples of staining for p-Rad50 for the indicated dose levels. Scale bars: 200 μm. Left panel: HNSCC, 40 mg BD, RECIST PR. Right panel: parotid adenocarcinoma, 160 mg BD, RECIST SD. (F) Evidence of increased replication stress with ceralasertib treatment. Immunohistochemical staining for γH2AX in paired tumor biopsies. Left: change in percentage of positive tumor cells (defined as at least 5 nuclear foci or pan-nuclar staining) after 2-week dosing. P = 0.22, paired t test. Right: examples of nuclear foci and pan-nuclear staining after treatment. Scale bar: 50 μm. (G) Examples of γH2AX staining for the indicated dose levels. Left panel: HNSCC, 40 mg BD, RECIST PR. Right panel: serous ovarian carcinoma, 160 mg BD, RECIST SD. Scale bars: 200 μm.
Figure 3
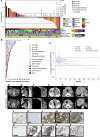
Figure 3. Antitumor responses.
(A) Waterfall plot of best change in sum of longest diameters of target lesions (SLD), with corresponding duration on study. (B) Swimmer plot of evaluable patients. (C) Spider plot of evaluable patients. (DI) Representative scans from responding patients. (D) Ovarian clear cell carcinoma, ARID1A loss, RECIST PR, 1,763 days on study, 160 mg BD, intermittent. (E) HNSCC, MRE11, and CDKN2A mutation, 1,194 days on study. (F) Esophageal squamous cell carcinoma, HR and Fanconi pathway deficiency, RECIST PR, 575 days on study, 160 mg BD intermittent. (G) Nasopharyngeal carcinoma, NRAS activation, RECIST PR, 341 days on study, 240 mg BD. (H) HNSCC, RECIST PR, 106 days on study, 40 mg BD. (I) Pancreatic adenocarcinoma, no clear mutation, unconfirmed PR, 480 days on study, 160 mg BD intermittent. Tumor protein profiling: IHC tumor staining was performed on the cases mentioned. Arrows indicate responding tumor lesions. (J) Clear cell ovarian carcinoma with loss of ARID1A, H score 0. Red arrowhead indicates tumor cells; white indicates stroma. (K) Eccrine adenocarcinoma with loss of ARID1A, H score 0. (L) Lung adenocarcinoma, ARID1A mutation but no protein loss. H score 290. (M) Cervix adenocarcinoma, ARID1A mutation but no protein loss. H score 300. (N) Clear cell ovarian carcinoma, ARID1A mutation but no protein loss. H score 235. (O) Serous ovarian carcinoma, ATM protein loss. (P) Same tumor as in M, showing cyclin E1 overexpression. H score 169. (Q) Peritoneal carcinoma, CCNE1 amplification on sequencing, cyclin E1. H score 210. (R) Serous endometrial carcinoma, CCNE1 amplification on sequencing, cyclin E1. H score 224. (S) Serous endometrial carcinoma, CCNE1 overexpression by IHC, cyclin E1. H score 155.
Figure 4
Figure 4. Immune profiling.
(A) H&E and PD-L1 IHC staining of paired biopsies of a responding patient (HNSCC, 40 mg, RECIST PR), showing infiltration of PD-L1–positive immune cells after 2 weeks of ceralasertib. Scale bar: 200 mm. (B) Fold change (FC) in percentage of CD45+ cells in peripheral blood after 2 weeks of ceralasertib (day 14) and after a 2-week break (day 29) compared with baseline sample for the indicated cell type. Median and IQR indicated. Statistical significance by Wilcoxon’s test. (C) Shown is log2 fold change in percentages of the CD8+ T, CD4+ T, and unconventional (Unconv) T cells of the following populations: TN (T naive as CCR7+CD45RA+), TCM (T central memory as CCR7+CD45RA), TEM (T effector memory as CCR7CD45RA), and TEMRA (T effector memory RA as CCR7CD45RA+) from baseline, median, and IQR indicated. (D) Fold change in percentage of CD45 of memory CD4-TEMRA (effector memory reexpressing CD45RA) from baseline. Median and IQR indicated. Statistical significance by Wilcoxon’s test. (E) Fold change in percentage of NK cells or CD8+ T cells in the peripheral blood of (from left to right) NK cell NKG2A-positive, NK cell CD69-positive and CD8+ T cell PD-1–positive from baseline. Median and IQR indicated. Statistical significance by Wilcoxon’s test. (F) Left: fold change in percentage of CD45 of classical monocytes, as above. Middle: change in gMDSC as a percentage of CD45-positive cells, right: change in mMDSC as a percentage of CD45-positive cells. Median and IQR indicated. *P < 0.05, unpaired t test. (G) Fold change versus baseline in levels of the indicated plasma cytokines after 2 weeks of ceralasertib. *P < 0.05, paired t test.
Figure 5
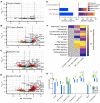
Figure 5. Tumor analysis.
(AD) Volcano plots of differential gene expression for the indicated conditions; log2 fold-change cutoff was set at 2 (1.5 for A) and P value at 0.05. Labeled genes are the most differentially expressed genes, which are also present in the REACTOME innate immune, adaptive immune, or immune system gene sets. (A) All samples, on treatment versus baseline; (B) on treatment versus baseline in responders; (C) responders versus nonresponders, baseline biopsies; (D) responders versus nonresponders, on-treatment biopsies. (E) Left: number of significantly differentially expressed genes from paired tumor RNA-Seq, for the indicated conditions. Right: number of genes in the indicated REACTOME pathways represented among differentially expressed genes for the indicated conditions (not all pathways are shown). (F) GSEA of tumor RNA-Seq data using the hallmarks gene set. For the indicated conditions, those pathways with normalized enrichment scores of more than 2 are shown. All have nominal P value and FDR q value of 0.000. OT, on treatment; BL, baseline. Heatmap indicates normalized enrichment score for the indicated gene sets. (G) Gene expression (minimum to maximum) for the indicated genes, in tumor biopsies at baseline and after 2 weeks of ceralasertib. *P < 0.05, 2-way ANOVA.
Figure 6
Figure 6. Tumor analysis.
(A) Heatmap of macrophage-related gene expression in baseline tumor biopsies. (B) Heatmap of antigen processing–related transcripts in baseline biopsies. The first column represents the participant shown in Figure 2D, with high mutational burden. (C) Heatmap of cytokine-related gene expression in baseline tumor biopsies. Scale = z score, scaled by row. (D) Heatmap of cytotoxicity signature in on-treatment biopsies. (E) Representative images of tumor micrographs quantified in G. Top 3 rows: participants with SD. Lower row: participant with PR. Scale bar: 200 μm. (F) Stromal TIL count in H&E sections of patients who experienced clinical benefit (CB) (defined as PR or >16 weeks on study) compared with those who did not. (G) Fold change in stromal TILs in a responding patient and 2 nonresponding patients.

References

    1. Bradbury A, et al. Targeting ATR as Cancer Therapy: A new era for synthetic lethality and synergistic combinations? Pharmacol Ther. 2020;207:107450. doi: 10.1016/j.pharmthera.2019.107450. - DOI - PubMed
    1. Cimprich KA, Cortez D. ATR: an essential regulator of genome integrity. Nat Rev Mol Cell Biol. 2008;9(8):616–627. doi: 10.1038/nrm2450. - DOI - PMC - PubMed
    1. Lecona E, Fernandez-Capetillo O. Targeting ATR in cancer. Nat Rev Cancer. 2018;18(9):586–595. doi: 10.1038/s41568-018-0034-3. - DOI - PubMed
    1. Dillon MT, et al. Radiosensitization by the ATR inhibitor AZD6738 through generation of acentric micronuclei. Mol Cancer Ther. 2017;16(1):25–34. doi: 10.1158/1535-7163.MCT-16-0239. - DOI - PMC - PubMed
    1. Lau A, et al. Abstract C60: Pre-clinical efficacy of the ATR inhibitor AZD6738 in combination with the PARP inhibitor olaparib. Mol Cancer Ther. 2015;14(12 suppl 2):C60. doi: 10.1158/1535-7163.TARG-15-C60. - DOI

Publication types

Associated data