. 2023 Nov 7;19(11):e1011771.
doi: 10.1371/journal.ppat.1011771. eCollection 2023 Nov.

KSHV vIL-6 enhances inflammatory responses by epigenetic reprogramming

Affiliations

KSHV vIL-6 enhances inflammatory responses by epigenetic reprogramming

Tomoki Inagaki et al. PLoS Pathog. .

Abstract

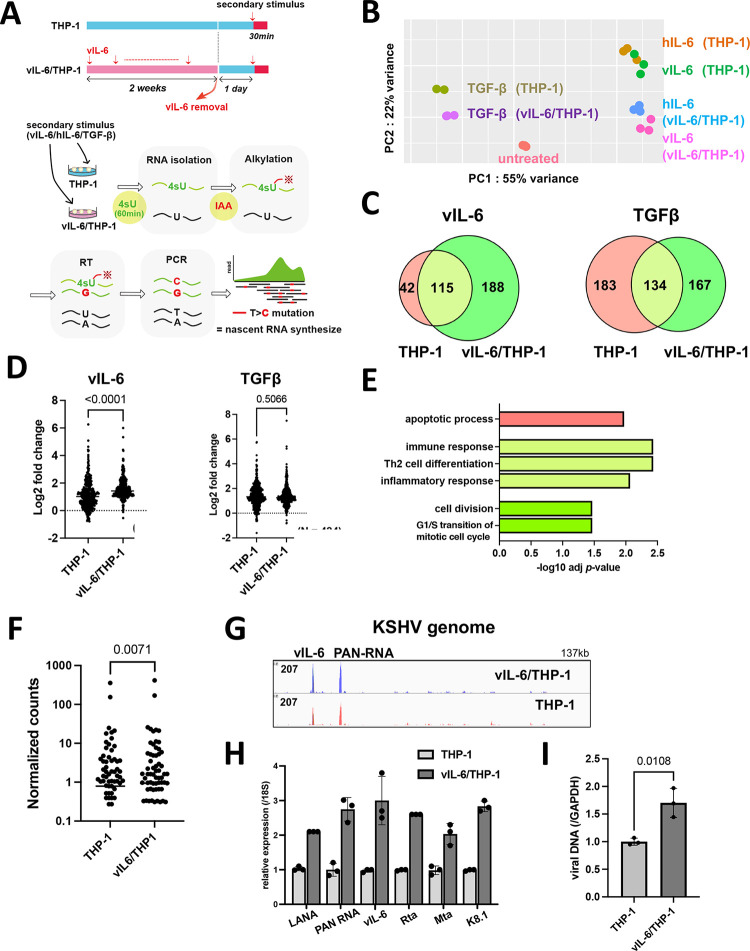
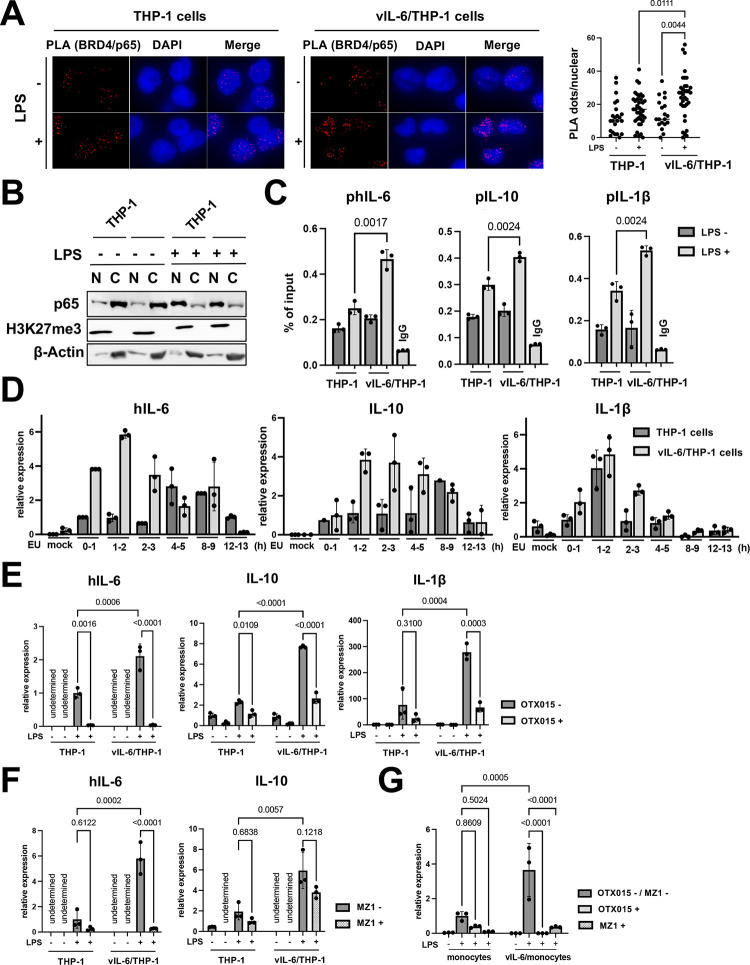
Kaposi sarcoma-associated herpesvirus (KSHV) inflammatory cytokine syndrome (KICS) is a newly described chronic inflammatory disease condition caused by KSHV infection and is characterized by high KSHV viral load and sustained elevations of serum KSHV-encoded IL-6 (vIL-6) and human IL-6 (hIL-6). KICS has significant immortality and greater risks of other complications, including malignancies. Although prolonged inflammatory vIL-6 exposure by persistent KSHV infection is expected to have key roles in subsequent disease development, the biological effects of prolonged vIL-6 exposure remain elusive. Using thiol(SH)-linked alkylation for the metabolic (SLAM) sequencing and Cleavage Under Target & Release Using Nuclease analysis (CUT&RUN), we studied the effect of prolonged vIL-6 exposure in chromatin landscape and resulting cytokine production. The studies showed that prolonged vIL-6 exposure increased Bromodomain containing 4 (BRD4) and histone H3 lysine 27 acetylation co-occupancies on chromatin, and the recruitment sites were frequently co-localized with poised RNA polymerase II with associated enzymes. Increased BRD4 recruitment on promoters was associated with increased and prolonged NF-κB p65 binding after the lipopolysaccharide stimulation. The p65 binding resulted in quicker and sustained transcription bursts from the promoters; this mechanism increased total amounts of hIL-6 and IL-10 in tissue culture. Pretreatment with the BRD4 inhibitors, OTX015 and MZ1, eliminated the enhanced inflammatory cytokine production. These findings suggest that persistent vIL-6 exposure may establish a chromatin landscape favorable for the reactivation of inflammatory responses in monocytes. This epigenetic memory may explain the greater risk of chronic inflammatory disease development in KSHV-infected individuals.


Conflict of interest statement

I have read the journal’s policy and the authors of this manuscript have the following competing interests: M.S. and Y.I. are founders of VGN BIO, Inc. and have a pending patent application for the use of vIL-6 for therapeutic purposes. No other authors have financial interests.

Figures

Fig 1
Fig 1
Biological effects of prolonged vIL-6 exposure (A) A schematic diagram of the THP-1 cell culture model. THP-1 cells were treated with or without vIL-6 every other day for 2 weeks (THP-1, vIL-6/THP-1). After withdrawal of the cytokine for 24 hours. vIL-6, hIL-6 and TGF-β were added for 30 minutes for secondary stimulation. Subsequently, 4-Thiouridine (4sU, 300 μM) was added to the culture media and the cells were incubated for 1 hr to label newly synthesized RNA. Newly synthesized RNA was then alkylated by iodoacetamide (IAA, 100mM). Total RNA was isolated for the following analyses. (B) Principal component analysis (PCA). Nascent transcribed gene expression in THP-1 and vIL-6/THP-1 cells was shown. vIL-6, hIL-6 and TGF-β were used as secondary stimulation. Untreated THP-1 cells were used as a control. The samples were represented by three biological replicates. The x and y axes show the percentage of variance explained by PC1 (55% variance) and PC2 (22% variance). (C) The number of upregulated genes (log2 fold change >1, adj p-value < 0.01) after vIL-6 stimulation (left) and TGF-β stimulation (right). Red and green circles represent THP-1 and vIL-6/THP-1 cells, respectively. (D) Comparison of up-regulated gene expression between parent THP-1 and vIL-6/THP-1 cells after stimulation with vIL-6 (left, N = 344) or TGFβ (right, N = 484). Data were analyzed using Wilcoxon matched-pairs signed ranked test and shown as median. (E) KEGG pathway analysis was performed on up-regulated genes (log2 fold change >1, adj p-value < 0.01) in either THP-1 or vIL-6/THP-1 cells with vIL-6 stimulation. Each bar represents the pathways that were enriched only in parental THP-1 cells (red), only in vIL-6/THP-1 cells (green), or commonly enriched (light green). Results are presented in descending order of the analysis. (F) Comparison of all KSHV gene expression between parent THP-1 and vIL-6/THP-1 cells after r219.KSHV infection (N = 88) for 72 hours. Data were analyzed using Wilcoxon matched-pairs signed ranked test and shown as median. (G) RNA-sequence reads aligned to the KSHV genome (NC 009333.1) in parent THP-1 (red) and vIL-6/THP-1 cells (blue) after r219.KSHV infection. (H) KSHV gene expression in parent THP-1 and vIL-6/THP-1 cells after r219.KSHV infection. THP-1 and vIL-6/THP-1 cells were infected with r219.KSHV for 72 hours. RNA was then collected and transcribed into cDNA for RT-qPCR. 18S rRNA expression was used for internal control. Data was analyzed using two-sided unpaired Student’s t test and shown as mean ± SD. (I) KSHV DNA copies 72 hours at r219.KSHV post-infection. GAPDH was used for internal control. Data was analyzed using two-sided unpaired Student’s t test and shown as mean ± SD.
Fig 2
Fig 2
Newly BRD4 recruitment and H3K27Ac translocation in vIl-6/THP-1 cells (A) Enrichment analysis by CHIP-Atlas. Enrichment analysis was performed on the list of genes whose expression were up-regulated by vIL-6 stimulation. The parameters used were as follows; cell type class: blood, threshold for significance: 100, threshold for log10 adjusted p value < -10. The Venn diagram shows the relatedness and number of genes up-regulated after vIL-6 stimulation in parental THP-1 (red circle) and vIL-6/THP-1 cells (green circle). (B) The predicted transcription factors or mediators selectively enriched only in vIL-6/THP-1 cells. The results were limited to THP-1 cells in CHIP-Atlas database. (C) CUT&RUN signals in ±5-kbp windows around the center of peaks in vIL-6/THP-1 cells. The list of peaks (p-value < 10−4) was extracted using findPeaks (HOMER with default parameters). Enrichment is shown in vIL-6/THP-1 (blue line) and in THP-1 (red line) cells. Images were drawn by plotProfile (HOMER). (D) H3K27Ac marks in parental THP-1 and vIL-6/THP-1 cells. The number of H3K27Ac peaks in vIL-6/THP-1 and parental THP-1 cells are depicted by a Venn diagram. (E) BRD4 CUT&RUN signals in vIL-6/THP-1 cells. The green line indicates BRD4 peaks±5-kbp around the center of H3K27Ac peaks in vIL-6/THP1 cells while the pink line indicates those in parental THP-1 cells. (F) Schematic model of H3K27Ac translocation and BRD4 recruitment at newly emerged H3K27Ac regions in vIL-6/THP-1 cells. (G) Distances of the nearest TSS to overlapping peaks of BRD4 binding and H3K27Ac enrichment sites. Total peak counts are shown. P values were calculated by the Kolmogorov–Smirnov test. (H) Annotation of overlapping peaks between BRD4 and H3K27Ac enrichment sites. Each annotation and its proportion were calculated by annotatePeaks.pl (Homer; parameters; default). Promoter regions are defined as ± 1-kbp from TSS. (I) BRD4 CUT&RUN signals in ±5-kbp windows around the center of CTCF peaks in vIL-6/THP-1 cells (blue) and parental THP-1 cells (pink).
Fig 3
Fig 3
Prolonged vIL-6 exposure enhances inflammatory response to LPS through the novel accumulation of BRD4 and H3K27Ac (A) Heatmap showing the results of Olink Target 48 Cytokine panel analysis. LPS (100ng/ml) was added to parental THP-1 or vIL-6/THP-1 cells for 6 hours. Cytokine production in untreated THP-1 cells was set as 1 and log2 fold activation relative to untreated THP-1 cells is shown. Samples were prepared in triplicate, and the mean values were shown. (B) Individual inflammatory cytokine production determined by Olink proximity extension assay. Data was analyzed using two-sided unpaired Student’s t test and shown as mean ± SD. (C) PCA based on nascent transcribed gene expression in THP-1 cells and vIL-6/THP-1 cells after LPS stimulation. The samples were represented by 3 biological replicates. The x and y axes show the percentage of variance explained by PC1 (98% variance) and PC2 (1% variance). (D) The number of up-regulated genes (log2 fold change >1, adj p-value < 0.01) in THP-1 and vIL-6/THP-1 cells after LPS stimulation (left) and KEGG pathway analysis performed on commonly up-regulated genes (right). (E) Schematic diagram for comparing peaks score of up-regulated genes between THP-1 and vIL-6/THP-1 cells. Commonly up-regulated genes by LPS stimulation were obtained from SLAMseq data and BRD4/H3K27Ac merge peaks score were obtained from CUT&RUN data. The peak scores were associated with each up-regulated gene. (F) BRD4/H3K27Ac merge peak score for commonly upregulated genes in THP-1 and vIL-6/THP-1 cells (N = 1626). Data were analyzed using Wilcoxon matched-pairs signed ranked test and shown as median. (G) BRD4/H3K27Ac peak score between up-regulated genes (N = 1626) and unchanged genes (log2 fold change >1 and < -1, adj p-value > 0.01) (N = 4582) in THP-1 (left) and vIL-6/THP-1 cells (right). Data were analyzed using the Mann-Whitney test and shown as the median.
Fig 4
Fig 4. Activation of inflammatory gene expression by vIL-6 expression in cells.
(A) Immunoblotting of THP-1 cells transduced with plenti4/V5-DEST expressing vIL-6. (B) hIL-6, IL-10 and vIL-6 genes expression in lenti vIL-6/THP-1 and parental THP-1 cells. Cells were stimulated with LPS for 1 hour and total RNA was harvested. Fold activation over parental THP-1 without stimulation is shown. lenti vIL-6 THP-1: vIL-6 expressing lentivirus transduced THP-1 cells, THP-1: parental cells.
Fig 5
Fig 5
Association of BRD4 and p65 is responsible for prolonging hIL-6 transcription burst by LPS (A) Proximity extension assay (PLA) to visualize BRD4 and p65 interaction. THP-1 and vIL-6/THP-1 cells were incubated with LPS (100ng/ml) for 6 hours, fixed by 4% PFA/PBS for 15min, permeabilized by 0.15% TritonX/PBS for 10min and PLA was performed. Representative images of PLA (red dots) and quantification of PLA are shown (right). Data were analyzed using a one-way ANOVA test. (B) Immunoblotting of p65, H3K27me3, and β-actin in the nuclear and cytoplasmic fractions. THP-1 and vIL-6/THP-1 cells were incubated with LPS (100ng/ml) for 6 hours and cell fractionation was performed. (C) The levels of p65 enrichment in the hIL-6, hIL-10, and IL-1β promoter regions were detected using ChIP-qPCR. Normal Rabbit IgG antibody was used as a negative control. Data was analyzed using two-sided unpaired Student’s t test and shown as mean ± SD. (D) Nascent RNA expression in THP-1 and vIL-6/THP-1 cells after LPS stimulation. Cells were incubated with LPS and ethynyl uridine (EU) was added at 0h, 1h 2h, 4h, 8h, and 12h after LPS stimulation for 1 hour. Mock samples were prepared without EU for 1 hour incubation with LPS. (E) The hIL-6, IL-10, and IL-1β gene expression level in response to OTX-015 treatment. THP-1 and vIL-6/THP-1 cells were incubated with OTX-015 (40nM) for 4 hours followed by LPS (100ng/ml) for 1 hour. RNA was then collected and transcribed into cDNA for RT-qPCR. 18S rRNA expression was used for internal control. Data were analyzed using a one-way ANOVA test. (F) The hIL-6 and IL-10 gene expression level in response to MZ1 (250nM) treatment. Sample preparation and data processing were the same as OTX-015 treatment. (G) hIL-6 gene expression level in response to OTX-015 and MZ1 treatment. Primary monocytes were exposed to vIL-6 (100ng/ml) every other day for 1 week (vIL-6/monocytes). Cells were then incubated with OTX-015 (40nM) or MZ1 (250nM) for 4 hours followed by LPS (100ng/ml) for 1 hour. RNA was then collected and transcribed into cDNA for RT-qPCR. 18S rRNA expression was used for internal control. Data were analyzed using a one-way ANOVA test.
Fig 6
Fig 6
Schematic model of transcription reprogramming by prolonged vIL-6 exposure Signal-dependent transcription factors such as STAT3 are recruited at up-regulated gene promoters by vIL-6, and BRD4 and H3K27Ac are increasingly co-occupied at those promoters by prolonged vIL-6 exposure. After removing the stimulus, STAT3 is removed from the promoters; however, the activated H3K27Ac modification and BRD4 remained and established a "primed" chromatin state for subsequent activation. Subsequent LPS stimulation activated hIL-6 or IL-10 genes that had been primed by vIL-6, more quickly and robustly.

Update of

Similar articles

Cited by

References

    1. Mizobuchi H, Yamamoto K, Tsutsui S, Yamashita M, Nakata Y, Inagawa H, et al. A unique hybrid characteristic having both pro- and anti-inflammatory phenotype transformed by repetitive low-dose lipopolysaccharide in C8-B4 microglia. Sci Rep. 2020;10(1):8945. Epub 20200602. doi: 10.1038/s41598-020-65998-8 ; PubMed Central PMCID: PMC7265460. - DOI - PMC - PubMed
    1. Morein D, Rubinstein-Achiasaf L, Brayer H, Dorot O, Pichinuk E, Ben-Yaakov H, et al. Continuous Inflammatory Stimulation Leads via Metabolic Plasticity to a Prometastatic Phenotype in Triple-Negative Breast Cancer Cells. Cells. 2021;10(6). Epub 20210531. doi: 10.3390/cells10061356 ; PubMed Central PMCID: PMC8229065. - DOI - PMC - PubMed
    1. Chang Y, Cesarman E, Pessin MS, Lee F, Culpepper J, Knowles DM, et al. Identification of herpesvirus-like DNA sequences in AIDS-associated Kaposi’s sarcoma. Science. 1994;266(5192):1865–9. doi: 10.1126/science.7997879 . - DOI - PubMed
    1. Antman K, Chang Y. Kaposi’s sarcoma. N Engl J Med. 2000;342(14):1027–38. doi: 10.1056/NEJM200004063421407 . - DOI - PubMed
    1. Giffin L, Damania B. KSHV: pathways to tumorigenesis and persistent infection. Adv Virus Res. 2014;88:111–59. doi: 10.1016/B978-0-12-800098-4.00002-7 ; PubMed Central PMCID: PMC4104069. - DOI - PMC - PubMed