. 2023 Nov 14;120(46):e2312052120.
doi: 10.1073/pnas.2312052120. Epub 2023 Nov 7.

INDETERMINATE1-mediated expression of FT family genes is required for proper timing of flowering in Brachypodium distachyon

Affiliations

INDETERMINATE1-mediated expression of FT family genes is required for proper timing of flowering in Brachypodium distachyon

Bing Liu et al. Proc Natl Acad Sci U S A. .

Abstract

The transition to flowering is a major developmental switch in plants. In many temperate grasses, perception of indicators of seasonal change, such as changing day-length and temperature, leads to expression of FLOWERING LOCUS T1 (FT1) and FT-Like (FTL) genes that are essential for promoting the transition to flowering. However, little is known about the upstream regulators of FT1 and FTL genes in temperate grasses. Here, we characterize the monocot-specific gene INDETERMINATE1 (BdID1) in Brachypodium distachyon and demonstrate that BdID1 is a regulator of FT family genes. Mutations in ID1 impact the ability of the short-day (SD) vernalization, cold vernalization, and long-day (LD) photoperiod pathways to induce certain FTL genes. BdID1 is required for upregulation of FTL9 (FT-LIKE9) expression by the SD vernalization pathway, and overexpression of FTL9 in an id1 background can partially restore the delayed flowering phenotype of id1. We show that BdID1 binds in vitro to the promoter region of FTL genes suggesting that ID1 directly activates FTL expression. Transcriptome analysis shows that BdID1 is required for FT1, FT2, FTL12, and FTL13 expression under inductive LD photoperiods, indicating that BdID1 is a regulator of the FT gene family. Moreover, overexpression of FT1 in the id1 background results in rapid flowering similar to overexpressing FT1 in the wild type, demonstrating that BdID1 is upstream of FT family genes. Interestingly, ID1 negatively regulates a previously uncharacterized FTL gene, FTL4, and we show that FTL4 is a repressor of flowering. Thus, BdID1 is critical for proper timing of flowering in temperate grasses.

Keywords: Brachypodium distachyon; FT; INDETERMINATE1; flowering; vernalization.


Conflict of interest statement

The authors declare no competing interest.

Figures

Fig. 1.
Fig. 1.
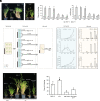
Characterization of delayed-flowering mutant id1-1 in response to SD vernalization. (A) Representative image of SD vernalized (SDV) Bd21-3 and id1-1 mutant in 14-h LD. The image was taken 30 d and 100 d after shifting to LDs for Bd21-3 and id1-1 plants, respectively. (Scale bar, 5 cm.) (B) Flowering time, and (C) leaf number as a function of time in SD (a time course of SD vernalization (SDV)). Plants were grown in 8-h SD for the indicated number of weeks, then shifted to 14-h LD. Days to heading and leaf number on the parent culm were measured. Values shown are the mean ± SD of at least 10 individual plants. (Student’s t test: *P < 0.01). (D) Identification of lesions in BdID1. Schematic representation of the gene and protein of BdID1 (Upper). The BdID1 gene diagram shows the nucleotide change in id1-1 that alters a splice acceptor site. Protein structure highlights the ID1 domain in BdID1, including two C2H2-type and two C2HC-type ZF domains. An asterisk (*) represents the premature stop codon encoded by the main transcript in the id1-1 mutant. RT-PCR (Lower) showing the transcripts of BdID1 in the Bd21-3 and id1-1 mutant. Two replicates are shown in the gel.
Fig. 2.
Fig. 2.
BdID1 is required for FTL9 expression in SD. (A and B) Diurnal expression pattern of FTL9 (A) and VRN2 (B) in Bd21-3 and the id1-1 mutant in 8-h SD. The newest fully expanded leaves were sampled at intervals of 4 h from the start of illumination from plants grown to the fourth leaf stage. Values are the mean ± SD from three independent biological replicates normalized to the internal UBIQUITIN18 (UBC18) control. (C) Flowering behavior of Bd21-3, id1-1, UBI:FTL9 id1-1, and UBI:FTL9 plants. Numbers at the Bottom represent the days after shifting to LDs (for SDV plants) or germination (for nonvernalized plants) when images were taken. (Scale bar, 5 cm.) (D) Flowering time of Bd21-3, id1-1, UBI:FTL9 id1-1, and UBI:FTL9 plants in 16-h LD. Values are the mean ± SD of at least 10 individual plants [one-way ANOVA, followed by Fisher’s LSD test (P < 0.05)].
Fig. 3.
Fig. 3.
BdID1 is required for expression of FT1 and FTL genes in LD. (A) Representative image of Bd21-3 and the id1-1 mutant in 20-h LD. The image was taken 40 d and 100 d after germination for Bd21-3 and id1-1 plants, respectively. (Scale bar, 5 cm.) (B) Flowering time (Left) and leaf number (Right) of Bd21-3 and the id1-1 mutant under 14-, 16-, and 20-h LD. Values shown are the mean ± SD of at least 10 individual plants (Student’s t test: *P < 0.01). (CH) Diurnal expression patterns of VRN1 (C), FT1 (D), FT2 (E), FTL10 (F), FTL12 (G), and FTL13 (H) in Bd21-3 and id1-1 under 20-h LD. The newest fully expanded leaves were sampled at intervals of 4 h from the start of illumination when plants were grown to the fourth leaf stage. Samples at ZT 22 were also included in order to capture a time point in the dark. Values are the mean ± SD from three independent biological replicates normalized to the UBC18 internal control. Note that the Y axes in panels EH are different from those of C and D as indicated by the 10–3 designation reflecting the lower expression levels of FT2, FTL10, FTL12, and FTL13 relative to VRN1 and FT1.
Fig. 4.
Fig. 4.
BdID1 promotes flowering by directly targeting FT1. (A) Representative image of Bd21-3, id1-1, UBI:FT1, and UBI:FT1 id1-1 plants in 20-h LD. Numbers at the Bottom represent the days after germination when the image was taken. (Scale bar, 5 cm.) (B) Flowering time of Bd21-3, id1-1, UBI:FT1, and UBI:FT1 id1-1 plants in 20-h LD. Values shown are the mean ± SD of at least 10 individual plants [one-way ANOVA, followed by Fisher’s LSD test (P < 0.05)]. (C) EMSA analysis showing BdID1 binds to FT1 and FTL9 in vitro. The asterisk indicates the position of shifted bands. (D) Dual luciferase assay showing BdID1 directly induces FT1 and FTL9 expression. (Upper) Schematic representation of the effector and reporter constructs. Values are the mean ± SD of three independent biological replicates. *Significant differences between HA and HA-BdID1 (Student’s t test: *P < 0.01).
Fig. 5.
Fig. 5.
BdID1 is required for FT1 but not VRN1 expression in response to cold vernalization. (A) Representative image of Bd21-3 and id1-1 mutant after cold vernalization. The Left image shows the phenotypes without vernalization (NV) of Bd21-3, 5-wk cold vernalized Bd21-3, and id1. For NV Bd21-3, the image was taken 100 d after germination. For vernalized Bd21-3 and id1-1, the image was taken 20 d and 120 d after shifting to LDs, respectively. The Right image shows Bd21-3 and the id1-1 mutant after 7 wk cold vernalization. Images were taken 45 d after shifting to LDs. (Scale bar, 5 cm.) (B) Flowering time (Left) and leaf number (Right) of a cold vernalization time course. Germinated seeds were grown in cold (8-h light/16-h dark) for 3 to 8 wk and then shifted to 16-h LDs. Days to heading and leaf number on the parent culm were measured. Values shown are the mean ± SD of at least 10 individual plants (Student’s t test: *P < 0.01). (C) Experimental design for evaluating gene expression. Plants were grown to the third leaf stage under 12-h day-lengths (averaged 22 °C light/20 °C dark), and then shifted to cold (4 °C light/4 °C dark) under 8-h SD. The third leaf was harvested during the cold after 2-, 4-, 6-, and 8-wk of cold exposure. The remaining plants that were not harvested were shifted to 16-h (averaged 22 °C light/20 °C dark) conditions for 10 d, and the third leaf was harvested at ZT8. (D and E) Relative expression levels of VRN1, FT1, and FT2 during cold (D) and after cold (E). Values are the mean ± SD from three independent biological replicates normalized to the internal control UBC18 (Student’s t test: *P < 0.01). (F) Representative image of vernalized Bd21-3 and id1-1, nonvernalized Bd21-3, id1-1, UBI:VRN1, and UBI:VRN1 id1-1 plants in 16-h LD. Numbers at the Bottom represent the days after shifting to LD (for vernalized plants) or germination (for nonvernalized plants) when images were taken. (Scale bar, 5 cm.) (G) Flowering time of Bd21-3, id1-1, UBI: VRN1, and UBI: VRN1 id1-1 plants in 16-h LD. Values shown are the mean ± SD of at least 10 individual plants [one-way ANOVA, followed by Fisher’s LSD test (P < 0.05)].
Fig. 6.
Fig. 6.
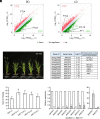
Transcriptomic analysis of the id1 mutant. (A) Scatter plot showing the differentially expressed genes in the id1-1 mutant under SD and LD. Red represents up-regulated genes, green down-regulated (P < 0.01 and fold-change > 2), and gray points indicate unchanged expression. FT1 and differentially expressed FTL genes were highlighted in the scatter plot. (B) Representative image of Bd21-3 and UBI:FTL4 plants in 20-h LD. The image was taken 45 d after germination for Bd21-3 and UBI:FTL4 plants. (Scale bar, 5 cm.) (C) Flowering time of Bd21-3 and UBI:FTL4 plants under 20-h LD. Values shown are the mean ± SD of at least 10 individual plants [one-way ANOVA, followed by Fisher’s LSD test (P < 0.05)]. (D) Table of differentially expressed MADS-box genes in the id1-1 mutant vs. Bd21-3. Log2FC and orthologs involved in flowering time control and floral organ identities in other species are shown. At, Arabidopsis thaliana; Ta, Triticum aestivum. (E) Verification of mis-regulated MADS-box gene expression by qRT-PCR. Values are the mean ± SD of three independent biological replicates normalized to the internal control UBC18 (Student’s t test: *P < 0.01).

Similar articles

Cited by

References

    1. Amasino R., Vernalization, competence, and the epigenetic memory of winter. Plant Cell 16, 2553–2559 (2004). - PMC - PubMed
    1. Andres F., Coupland G., The genetic basis of flowering responses to seasonal cues. Nat. Rev. Genet. 13, 627–639 (2012). - PubMed
    1. Chouard P., Vernalization and its relations to dormancy. Annu. Rev. Plant Physiol. Plant Mol. Biol. 11, 191–238 (1960).
    1. Purvis O. N., Gregory F. G., Studies in vernalisation of cereals I. A comparative study of vernalisation of winter rye by low temperature and by short days. Ann. Bot. Lond. 1, 562–569 (1937).
    1. Heide O. M., Control of flowering and reproduction in temperate grasses. New Phytol. 128, 347–362 (1994). - PubMed