. 2024 Mar 4;26(3):538-552.
doi: 10.1093/neuonc/noad207.

Tumor and immune cell types interact to produce heterogeneous phenotypes of pediatric high-grade glioma

Affiliations

Tumor and immune cell types interact to produce heterogeneous phenotypes of pediatric high-grade glioma

John DeSisto et al. Neuro Oncol. .

Abstract

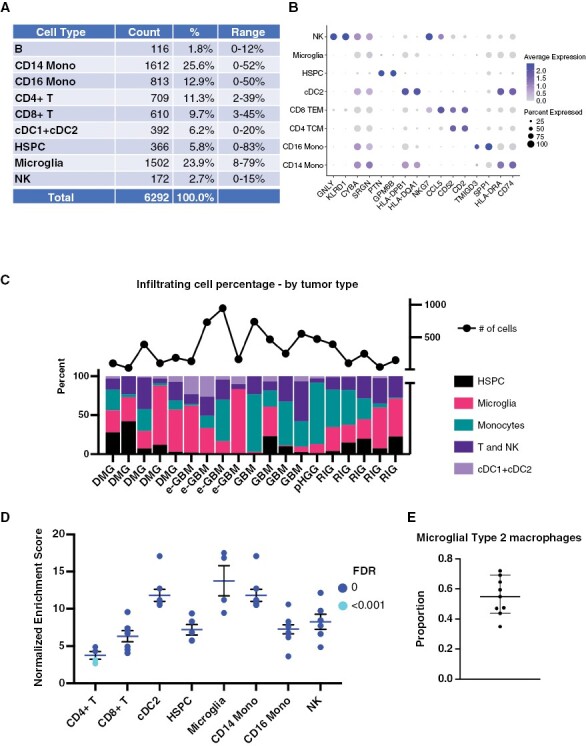
Background: Pediatric high-grade gliomas (PHGG) are aggressive brain tumors with 5-year survival rates ranging from <2% to 20% depending upon subtype. PHGG presents differently from patient to patient and is intratumorally heterogeneous, posing challenges in designing therapies. We hypothesized that heterogeneity occurs because PHGG comprises multiple distinct tumor and immune cell types in varying proportions, each of which may influence tumor characteristics.

Methods: We obtained 19 PHGG samples from our institution's pediatric brain tumor bank. We constructed a comprehensive transcriptomic dataset at the single-cell level using single-cell RNA-Seq (scRNA-Seq), identified known glial and immune cell types, and performed differential gene expression and gene set enrichment analysis. We conducted multi-channel immunofluorescence (IF) staining to confirm the transcriptomic results.

Results: Our PHGG samples included 3 principal predicted tumor cell types: astrocytes, oligodendrocyte progenitors (OPCs), and mesenchymal-like cells (Mes). These cell types differed in their gene expression profiles, pathway enrichment, and mesenchymal character. We identified a macrophage population enriched in mesenchymal and inflammatory gene expression as a possible source of mesenchymal tumor characteristics. We found evidence of T-cell exhaustion and suppression.

Conclusions: PHGG comprises multiple distinct proliferating tumor cell types. Microglia-derived macrophages may drive mesenchymal gene expression in PHGG. The predicted Mes tumor cell population likely derives from OPCs. The variable tumor cell populations rely on different oncogenic pathways and are thus likely to vary in their responses to therapy.

Keywords: glioma; pediatric | scRNA-Seq.


Conflict of interest statement

The authors declare no competing interests.

Figures

Figure 1.
Figure 1.
CNV analysis and bioinformatic clustering identify normal CNS analogs of tumor cells. a. and b. UMAP projections of tumor cells show Seurat unsupervised cluster membership (a) is consistent with cell type (b), but Seurat clusters include additional subgroups due to phenotypic differences such as expression of cell cycle, angiogenic, metastasic, or inflammatory genes; c. Analysis strategy for scRNA-Seq data; d. Predicted nonimmune cell types from supervised clustering; e. Predicted tumor cell type percentages by sample (one sample is omitted from this display due to cell count <10 following elimination of low-expressing cells).
Figure 2.
Figure 2.
Differential gene expression among predicted tumor cell types. a. Heatmap by gene expression shows segregation of the 3 principal tumor cell types; b. Non-negative matrix factorization (NMF) of principal cell types shows OPC and Mes cells are similar but differ markedly from astrocytes; c. Marker gene expression confirms cell types differentially express known characteristic markers; d. OPCs are enriched in ASCL1, SOX2, and SOX10, which control stemness characteristics, and the stem cell marker NES; e. OPCs are enriched in transcription factors whose expression precedes emergence of a mesenchymal phenotype and Mes cells are enriched in genes characteristic of mesenchymal cells, suggesting Mes cells may develop from OPCs during tumor growth; f. OPC and Mes marker genes in predicted cell types; g. Ki67 staining shows OPCs and astrocytes are more proliferative than the average of all cells; Mes cells have a proliferative subpopulation but on average are less proliferative than the average cell population, representative IF images in Supplementary Figure S3a–b.
Figure 3.
Figure 3.
Tumor cell types differ in pathway enrichment. a. Enrichment in gene sets from adult HGG shows intertumoral heterogeneity based on bulk RNA-seq data (FDR < 1.6E−4 for all gene sets); b. Tumor cell types and microglia vary in enrichment of adult HGG gene sets; c. Pathway analysis in tumor cell types; d. Histone methylation mark gene sets predicting stemness/differentiation (greater enrichment in these gene sets suggests greater cell differentiation); e. Heatmap summarizing pathway enrichment shows differences in oncogenic processes and targetable signaling pathways among principal tumor cell types.
Figure 4.
Figure 4.
Pathway and differential gene expression analysis reveal differences by cell type in angiogenesis, metastasis, and stem cell gene expression. a. Expression of mesenchymal versus epithelial pathway genes for astrocyte subclusters; b. Astrocyte subcluster expression of VEGF pathway genes strongly correlates with NF-κB pathway expression (r = 0.85, P = .0036); c. OPC cluster 6 expresses apical radial glial cell genes (“Multi” box), suggesting neural stem cell identity, and OPC cluster 7 expresses committed progenitor genes suggesting a hierarchical relationship within the OPC population (left panel); astrocyte subpopulation 5 expresses apical radial glial cell genes (“Multi” box) and subpopulation 2 expresses committed astrocyte progenitor genes (“As-IPC” boxes) (right panel); d. Expression of mesenchymal versus epithelial genes for OPC subclusters; e. OPC subcluster has low expression of VEGF pathway genes that is uncorrelated with also low NF-κB pathway expression; f. Expression of mesenchymal versus epithelial genes for Mes subclusters; g. Mes subcluster expression of VEGF pathway genes strongly correlates with NF-κB pathway expression (r = 0.84, P = .0042).
Figure 5.
Figure 5.
Immune cell classification. a. Counts and proportions of cell types found in tumor-associated immune cells; b. Key marker gene expression by immune cell type; c. Immune cell totals and proportions by sample; d. Normalized enrichment score of gene sets indicating identity of immune cells, false discovery rate (FDR) shown by symbol color, error bars show standard error of the mean; e. Proportion by tumor sample of microglial population (CD74/IBA1+) that expresses type 2 (tumor-associated) macrophage marker CD163 (mean with standard error of the mean shown), representative IF images in Supplementary Figure S3c.
Figure 6.
Figure 6.
Microglial derived macrophages may induce mesenchymal transformation and evidence for T-cell exhaustion and tumor permissive immune microenvironment. a. Correlations between tumor and immune cell types show microglia-associated macrophages are enriched and monocyte-associated macrophages depleted in Mes subtype; FDR (q < 0.05) for all data points; b. Heatmap of immune cell types shows microglial cells are enriched in mesenchymal adult HGG gene set; FDR < 0.05; c. Nearest neighbor analysis using immunofluorescence shows Mes (IGFBP2+) cells are on average closer to microglial derived type 2 macrophages (CD163+/CD74) than to OPCs (Olig2+); data points show statistical mode by sample; total number of cells analyzed exceeds 290 for each sample, representative IF images in Supplementary Figure S3d; d. Microglia-derived macrophage (micro) population has greater proportion of M2 macrophages than CD14+ or CD16+ monocyte-associated macrophages; e. M1 (HLA-DPA1, C3) and M2 (CD163) markers validate macrophage classification by gene expression; f. Marker gene expression suggests T-cell exhaustion; exhaustion markers (CD44, SPN, CD69, PRDM1 are enriched), while enrichment markers (IL7R, SELL, GZMB) are depleted; g. GSEA showing negative NES for gene sets upregulated during tumor rejection suggests tumor permissive immunosuppressed microenvironment.

Similar articles

Cited by

References

    1. Surowiec RK, Ferris SF, Apfelbaum A, et al. . Transcriptomic analysis of diffuse intrinsic pontine glioma (DIPG) identifies a targetable ALDH-positive subset of highly tumorigenic cancer stem-like cells. Mol Cancer Res. 2021;19(2):223–239. - PMC - PubMed
    1. Petrilli LL, Fuoco C, Palma A, et al. . Inter and intra-tumor heterogeneity of paediatric type diffuse high-grade gliomas revealed by single-cell mass cytometry. Front Oncol. 2022;12:1016343. - PMC - PubMed
    1. Fangusaro J. Pediatric high-grade gliomas and diffuse intrinsic pontine gliomas. J Child Neurol. 2009;24(11):1409–1417. - PubMed
    1. Metselaar DS, du Chatinier A, Stuiver I, Kaspers GJL, Hulleman E.. Radiosensitization in pediatric high-grade glioma: targets, resistance and developments. Front Oncol. 2021;11:662209. - PMC - PubMed
    1. Filbin MG, Tirosh I, Hovestadt V, et al. . Developmental and oncogenic programs in H3K27M gliomas dissected by single-cell RNA-seq. Science (New York, N.Y.). 2018;360(6386):331–335. - PMC - PubMed

Publication types

Associated data