. 2023 Nov 15;111(22):3570-3589.e5.
doi: 10.1016/j.neuron.2023.09.043. Epub 2023 Nov 6.

The neuropeptidergic connectome of C. elegans

Affiliations

The neuropeptidergic connectome of C. elegans

Lidia Ripoll-Sánchez et al. Neuron. .

Abstract

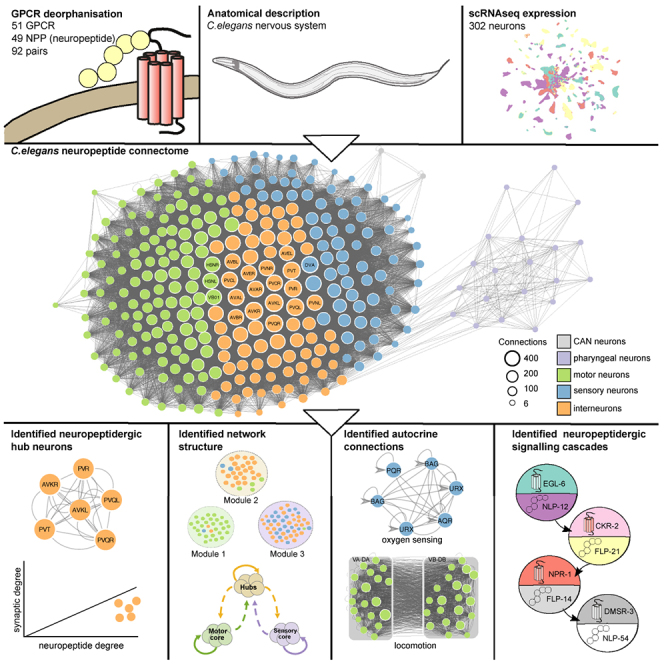
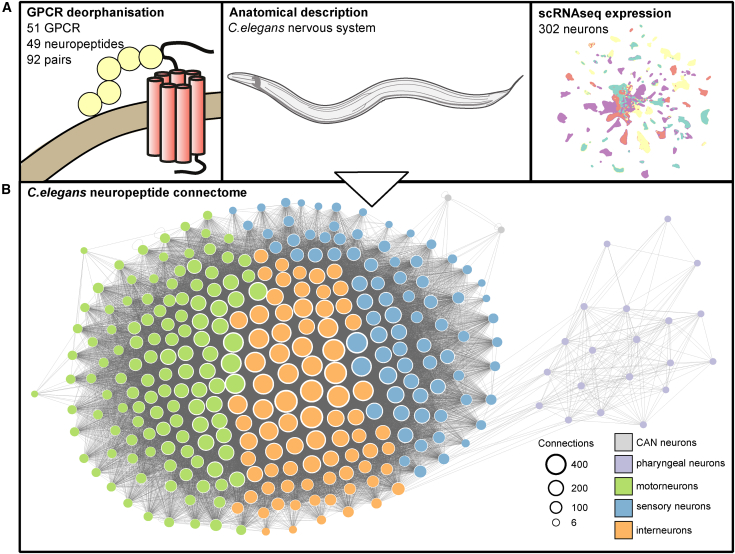
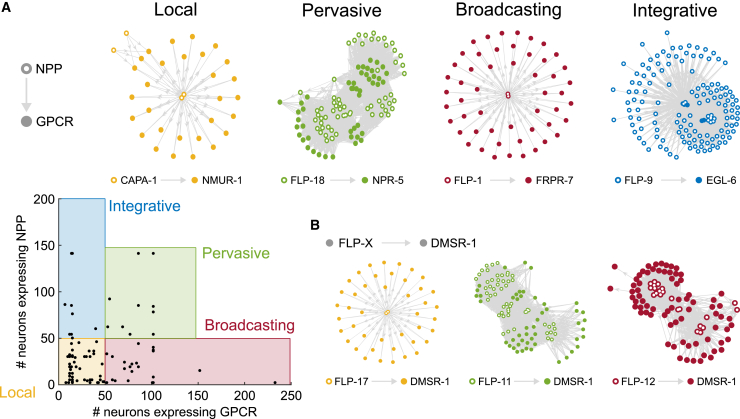
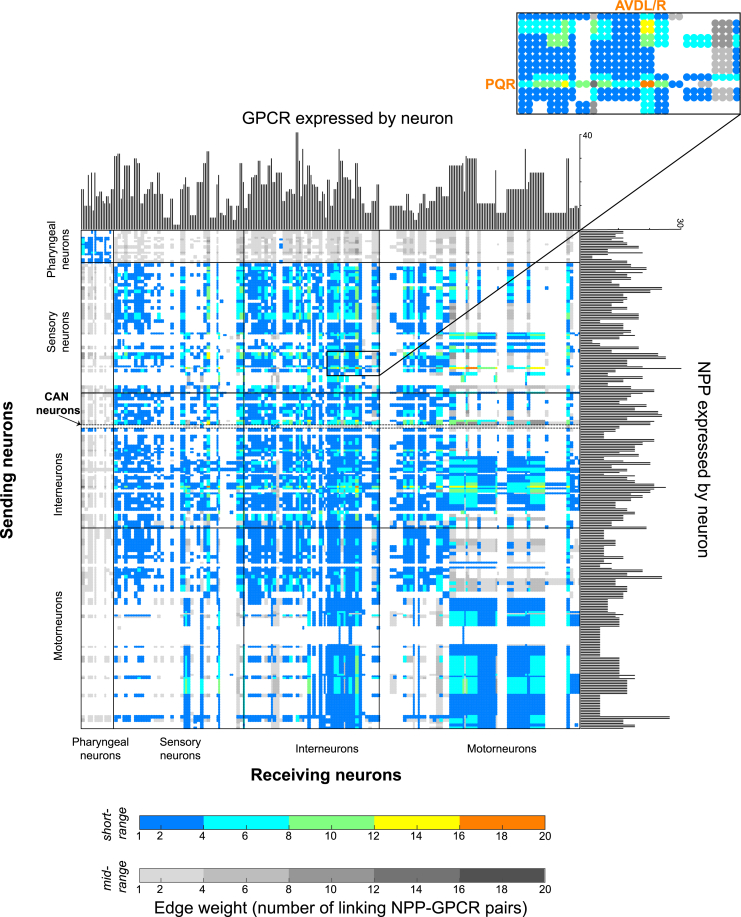
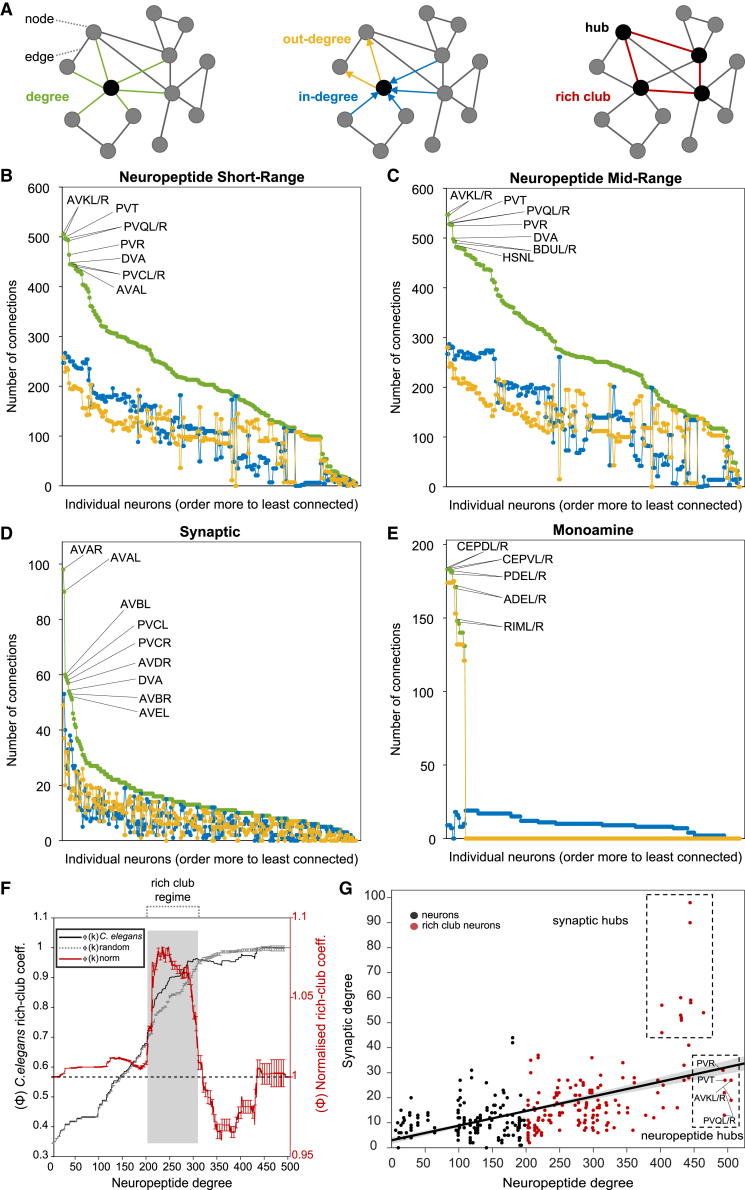
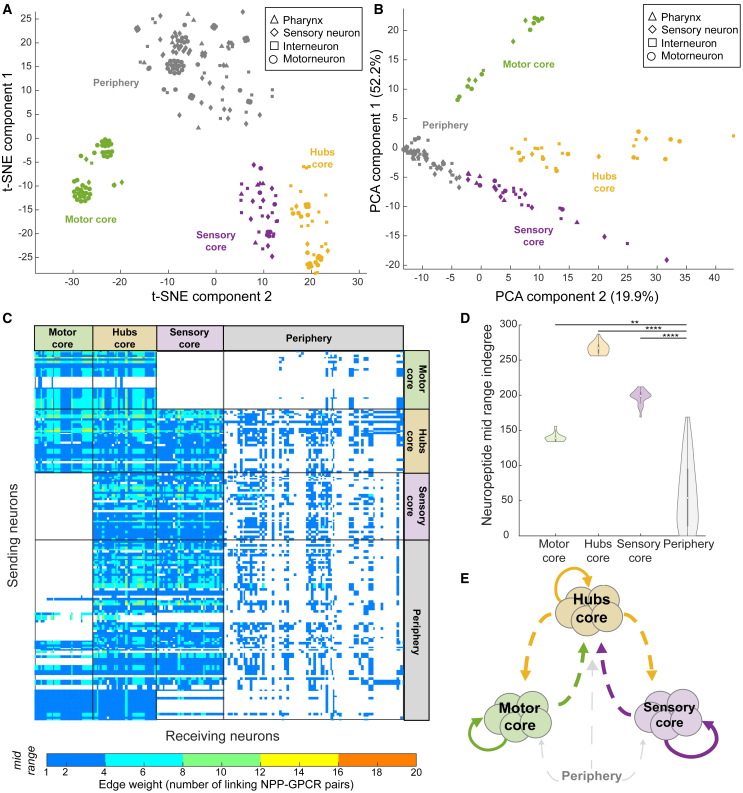
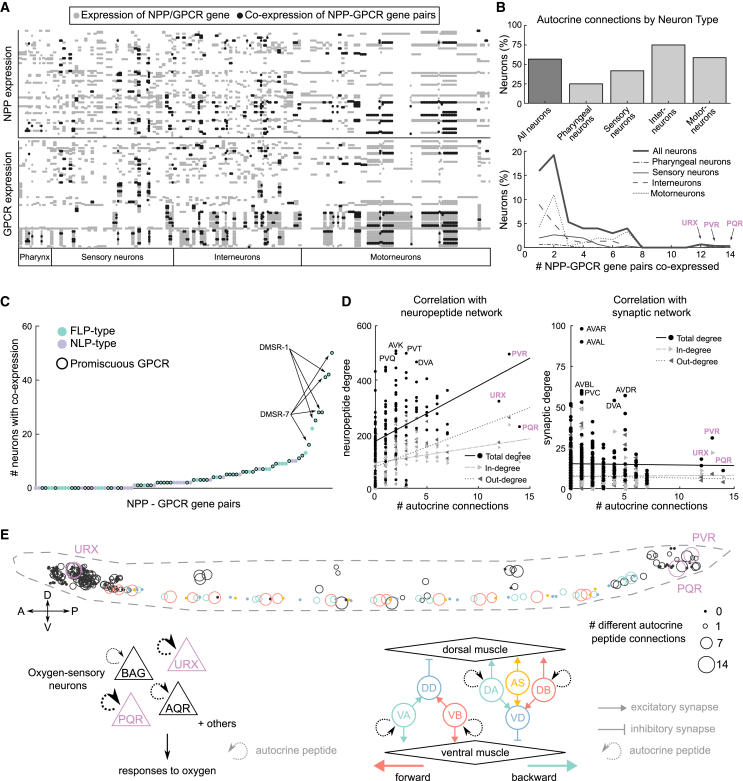
Efforts are ongoing to map synaptic wiring diagrams, or connectomes, to understand the neural basis of brain function. However, chemical synapses represent only one type of functionally important neuronal connection; in particular, extrasynaptic, "wireless" signaling by neuropeptides is widespread and plays essential roles in all nervous systems. By integrating single-cell anatomical and gene-expression datasets with biochemical analysis of receptor-ligand interactions, we have generated a draft connectome of neuropeptide signaling in the C. elegans nervous system. This network is characterized by high connection density, extended signaling cascades, autocrine foci, and a decentralized topology, with a large, highly interconnected core containing three constituent communities sharing similar patterns of input connectivity. Intriguingly, several key network hubs are little-studied neurons that appear specialized for peptidergic neuromodulation. We anticipate that the C. elegans neuropeptidergic connectome will serve as a prototype to understand how networks of neuromodulatory signaling are organized.

Keywords: C. elegans; connectomics; networks; neuromodulation; neuropeptides.


Conflict of interest statement

Declaration of interests The authors declare no competing interests.

Figures

None
Graphical abstract
Figure 1
Figure 1
Construction of the neuropeptidergic connectome (A) Datasets used to build the network, including neuropeptide-GPCR interaction data, nervous system anatomy, and single-neuron expression data. (B) Graphical representation of the resulting neuropeptide connectome; all neurons form a single connected network.
Figure 2
Figure 2
Assessment of gene expression thresholds using single-copy knockin reporters GFP-positive neurons were identified using the NeuroPAL multicolor transgene. Segments showing neuronal expression are pictured; individual neurons are labeled. Scale bars represent 10 μm. (A) Strategy for neuron identification. Reporter expression is overlaid with the multicolor NeuroPAL expression pattern, allowing neuron identification. (B) Reporters for representative NPP genes nlp-45 (left) and flp-20 (right). (C) Reporters for representative GPCR genes tkr-1 (above) and dmsr-6 (below). Images for the complete set of 17 NPP and nine GPCR reporters are in Figure S1.
Figure 3
Figure 3
Assessment of the spatial scale of neuropeptide signaling (A) Anatomical overview of the C. elegans hermaphrodite nervous system. Neuronal bundles are represented in red and the pharynx in green. (B) Details of assessed diffusion models. Contact interactions are defined as occurring between neurons with processes in the same nerve ring stratum, or small process bundle. Short-range connections include interactions within the same neuronal bundle. Mid-range connections occur between different bundles within the same body region, i.e., head, midbody, or tail. Long-range connections are between neurons in different body regions. (C) Expression matrix for 23 GPCRs, activated by a single ligand that activates no other receptor. Columns indicate neurons, sorted by type; each row indicates a GPCR. Colors indicate the diffusion range required for communication with at least one ligand-expressing neuron: blue indicates contact interactions within a nerve ring stratum (dark blue) or a thin neuronal bundle (light blue); mustard indicates short-range connections between nerve-ring strata; red indicates mid-range connections between neurons in different bundles. (D) Expression matrix for the 23 cognate neuropeptide precursor genes for the receptors in (C). Neurons are sorted by type on the x axis; neuropeptide genes are on the y axis. Colors indicate the diffusion range required for communication with a receptor-expressing neuron, as described above. GPCR and NPP identities are included in Figure S2.
Figure 4
Figure 4
Individual NPP-GPCR networks exhibit different topologies (A) Classification of individual peptidergic networks based on NPP and receptor expression domains. Bottom left: scatterplot showing the number of neurons expressing a particular GPCR versus the neurons expressing the corresponding NPP gene for each of 92 individual networks. Local networks show restricted NPP and GPCR expression (≤50 neurons). Pervasive networks have broad NPP and GPCR expression (>50 neurons), broadcaster networks show broad GPCR (˃50 neurons) but restricted NPP expression (≤50 neurons), and integrative networks display broad NPP (˃50 neurons) and restricted GPCR expression (≤50 neurons). Filled circles indicate receptor expression; empty circles indicate neuropeptide expression. Example graphs: local network CAPA-1/NMUR-1, pervasive network FLP-18/NPR-5, broadcaster network FLP-1/FRPR-7, and integrative network NLP-47/GNRR-1. (B) Examples of networks using common receptors with different topologies, depending on the peptide ligand. Graphs of all NPP-GPCR pairs are in Figure S4.
Figure 5
Figure 5
The aggregate neuropeptide connectome connects all neurons in a dense network Shown is the adjacency matrix of the aggregate network using short-range (color) and mid-range (gray) diffusion models. Histograms on the axes represent numbers of NPP and GPCR genes per neuron. Edge weights (range: 1–18) indicate the number of different NPP-GPCR pathways connecting a neuron pair in a given direction. 5% of all connections are putative autocrine connections.
Figure 6
Figure 6
Analysis of peptidergic network degree highlights hubs and a large rich club (A) Network graph representation highlighting nodes (neurons), edges (connections), degree (connection number), hub (highly connected neurons), and rich club (hubs overconnected to each other). (B–E) Degree distributions of C. elegans neural networks. In each case, degree (incoming plus outgoing connections) is shown in green, in-degree (incoming connections) in blue and out-degree (outgoing connections) in yellow. The 10 highest-degree hubs in each network are indicated. (F) Rich club analysis. The rich club coefficient Φ(k) for the real C. elegans neuropeptidergic network is shown in black; the averaged rich club curves Φrandom(k) of 100 randomized networks preserving degree distribution is in gray; the red curve is the normalized coefficient (error bars indicate standard deviation). Gray shading indicates the onset of the rich club; for the short-range peptidergic network, this consists of 156 neurons (166 for mid-range, Figure S7). (G) Correlation between synaptic and neuropeptidergic degrees. A positive correlation was observed (r = 0.54, p = 3.1 e−14); red dots indicate neurons in the neuropeptidergic rich club; synaptic and peptidergic hubs are highlighted.
Figure 7
Figure 7
Mesoscale structure of the neuropeptide connectome (A and B) Shown are t-SNE (A) and PCA (B) plots of the adjacency matrix of the mid-range aggregate network (Euclidean distance, perplexity 30). Hubs and core clusters encompassing 112 of 166 neuropeptide rich club neurons, as well as loosely clustered periphery, are indicated by color; datapoint markers represent neuronal classification. (C) Adjacency matrix for the mid-range neuropeptidergic network sorted in both dimensions based on neuronal clusters defined in (A) and (B). (D) Violin plots showing indegree values for the three clusters and the periphery. Median indegree values: motor core, 139; hubs, 267; sensory core, 198; periphery, 54. Indegrees for the four groups were significantly different according to the Kruskal-Wallis test followed by Tukey-Kramer test for multiple comparisons (∗∗p < 0.01; ∗∗∗∗p < 0.0001). (E) Diagram showing connections between clusters. Neurons of the motor core connect with the periphery and with the hubs; the hubs connect to almost every other neuron; the sensory core connects to the hubs and the periphery but not the motor core.
Figure 8
Figure 8
Co-expression between GPCRs and their ligands potentiates autocrine and paracrine signaling (A) Neuronal expression matrix for NPP and GPCR genes of the 92 NPP-GPCR pairs. Gray dots represent expression of only the NPP (upper panel) or GPCR (lower panel), black dots indicate co-expression. (B) Percentage of each neuron type showing peptide autocrine connections (upper panel). The number of different NPP-GPCR pairs co-expressed in each neuron type is shown in the bottom panel. (C) Scatter plot showing the number of neurons with co-expression for each of the 92 NPP-GPCRs. (D) Correlation between number of autocrine connections and neuropeptide (left) or synaptic (right) degree for each neuron. Point shapes indicate degree (round), in-degree (incoming arrow), and out-degree (outgoing arrow). (E) Locations of autocrine connections in the worm. Cell body size indicates the number of autocrine NPP-GPCR pairs expressed in that neuron. Colored neurons (including those of the oxygen-sensing and locomotor circuits, diagrammed below) exhibit the largest number of autocrine connections. Arrow size indicates number of NPP-GPCR pairs.

References

    1. Scheffer L.K., Xu C.S., Januszewski M., Lu Z., Takemura S.Y., Hayworth K.J., Huang G.B., Shinomiya K., Maitlin-Shepard J., Berg S., et al. A connectome and analysis of the adult Drosophila central brain. eLife. 2020;9 doi: 10.7554/eLife.57443. - DOI - PMC - PubMed
    1. Csaba V., Sanja J., Martin G., Réza S., Nobuo U., James David B., Sara M., Konrad H., Luis Alberto B.-C., Elizabeth W., et al. Whole-animal connectome and cell-type complement of the three-segmented Platynereis dumerilii larva. bioRxiv. 2020 doi: 10.1101/2020.08.21.260984. - DOI
    1. Ryan K., Lu Z., Meinertzhagen I.A. The CNS connectome of a tadpole larva of Ciona intestinalis (L.) highlights sidedness in the brain of a chordate sibling. eLife. 2016;5 doi: 10.7554/eLife.16962. - DOI - PMC - PubMed
    1. Kunst M., Laurell E., Mokayes N., Kramer A., Kubo F., Fernandes A.M., Förster D., Dal Maschio M., Baier H. A cellular-resolution atlas of the larval zebrafish brain. Neuron. 2019;103:21–38.e5. doi: 10.1016/j.neuron.2019.04.034. - DOI - PubMed
    1. Oh S.W., Harris J.A., Ng L., Winslow B., Cain N., Mihalas S., Wang Q., Lau C., Kuan L., Henry A.M., et al. A mesoscale connectome of the mouse brain. Nature. 2014;508:207–214. doi: 10.1038/nature13186. - DOI - PMC - PubMed

Publication types

LinkOut - more resources