Randomized Controlled Trial
. 2023 Nov 21;4(11):101283.
doi: 10.1016/j.xcrm.2023.101283. Epub 2023 Nov 7.

Feasibility and impact of ketogenic dietary interventions in polycystic kidney disease: KETO-ADPKD-a randomized controlled trial

Affiliations
Randomized Controlled Trial

Feasibility and impact of ketogenic dietary interventions in polycystic kidney disease: KETO-ADPKD-a randomized controlled trial

Sadrija Cukoski et al. Cell Rep Med. .

Abstract

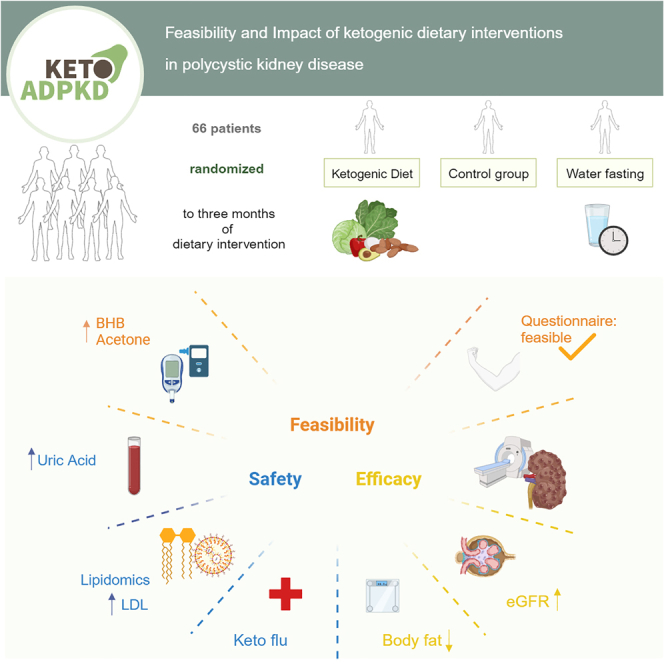
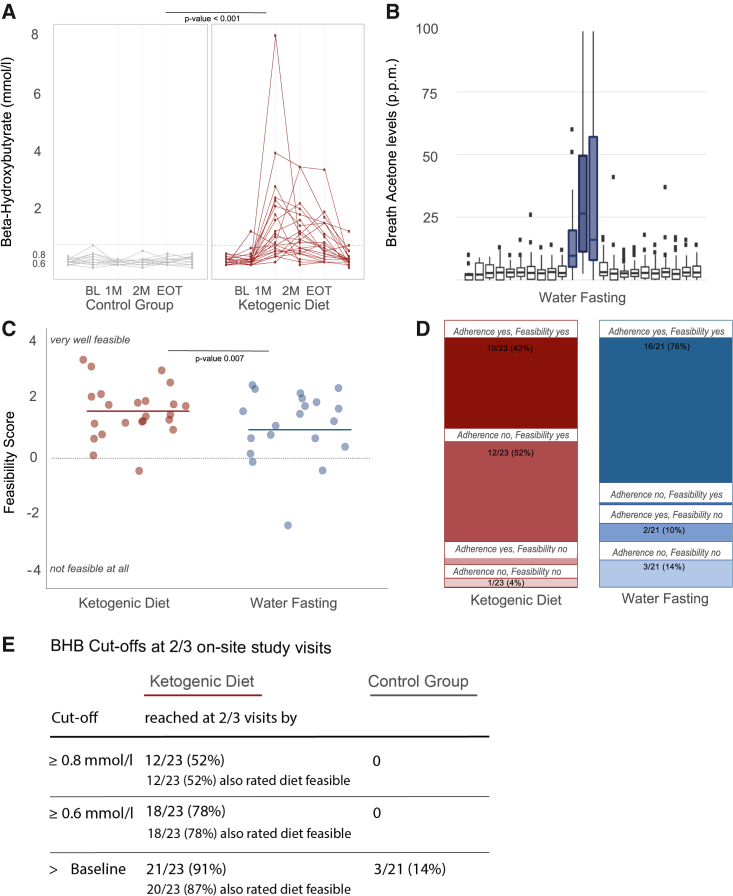
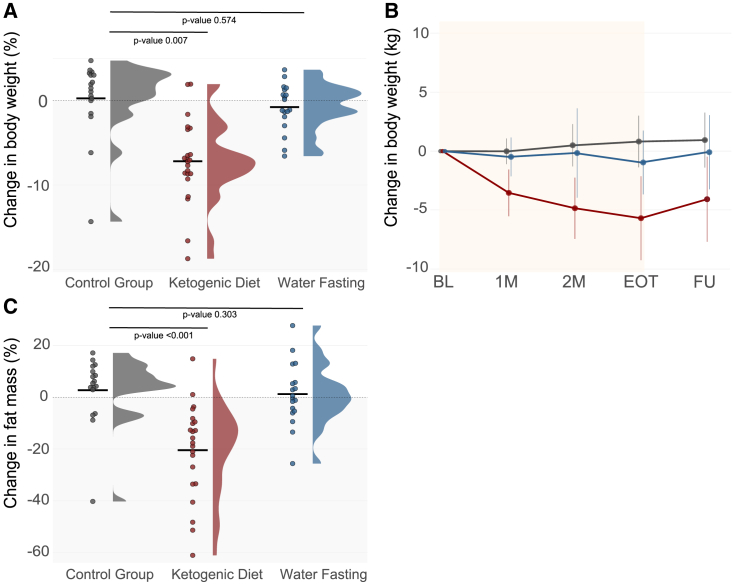
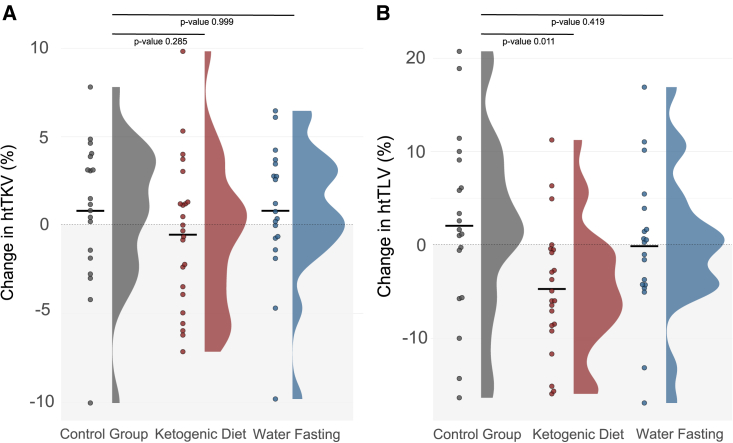
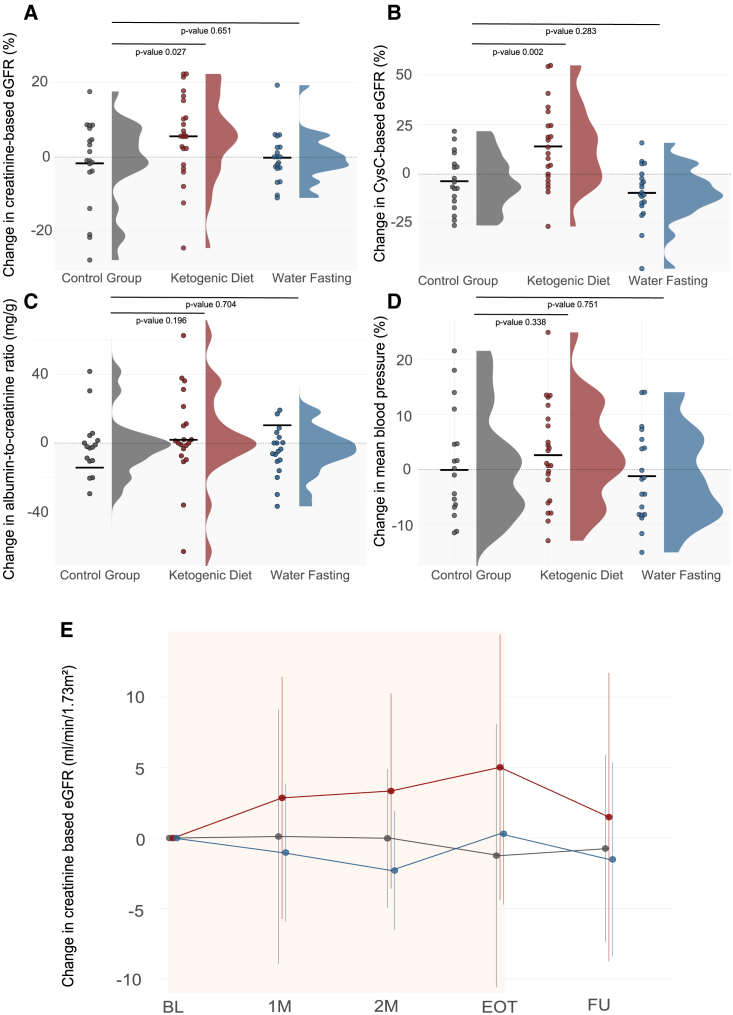
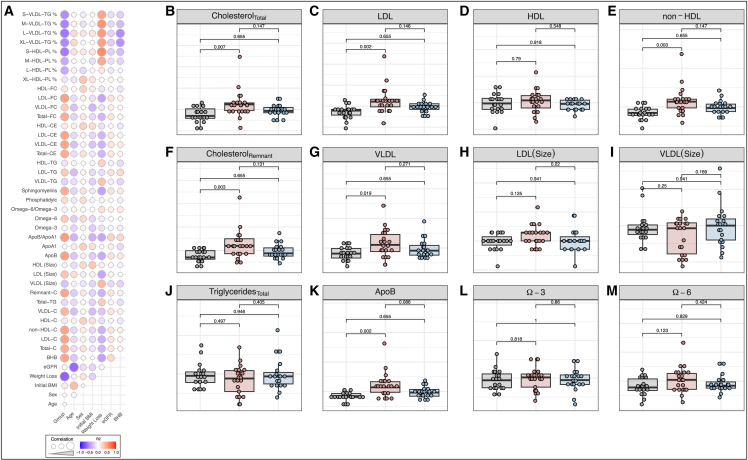
Ketogenic dietary interventions (KDIs) are beneficial in animal models of autosomal-dominant polycystic kidney disease (ADPKD). KETO-ADPKD, an exploratory, randomized, controlled trial, is intended to provide clinical translation of these findings (NCT04680780). Sixty-six patients were randomized to a KDI arm (ketogenic diet [KD] or water fasting [WF]) or the control group. Both interventions induce significant ketogenesis on the basis of blood and breath acetone measurements. Ninety-five percent (KD) and 85% (WF) report the diet as feasible. KD leads to significant reductions in body fat and liver volume. Additionally, KD is associated with reduced kidney volume (not reaching statistical significance). Interestingly, the KD group exhibits improved kidney function at the end of treatment, while the control and WF groups show a progressive decline, as is typical in ADPKD. Safety-relevant events are largely mild, expected (initial flu-like symptoms associated with KD), and transient. Safety assessment is complemented by nuclear magnetic resonance (NMR) lipid profile analyses.

Keywords: ADPKD; cholesterol; ketogenic diet; ketosis; kidney; lipids; low carb; nutrition; polycystic kidney disease; water fasting.


Conflict of interest statement

Declaration of interests R.-U.M. is a member of the scientific advisory board of Santa Barbara Nutrients and chair of the working group “Genes&Kidney” of the European Renal Association (ERA). T.W. is an inventor on issued and pending patents filed by the University of California, Santa Barbara related to the topic of this article. T.W. is a shareholder of Santa Barbara Nutrients, Inc., and holds a managerial position. T.W. is a scientific advisor and shareholder of Chinook Therapeutics and received research funding from Chinook Therapeutics. The Department II of Internal Medicine (University Hospital Cologne) received research funding from Otsuka Pharmaceuticals not directly related to the study at hand.

Figures

None
Graphical abstract
Figure 1
Figure 1
Ketogenic dietary interventions potently induced ketosis Readouts of metabolic efficacy and feasibility are shown (n = 63). p values are provided for the comparison between the control and each intervention group. (A) Measurements of BHB levels for patients in the KD group and the control group show significantly higher values in the KD group (p < 0.001). The threshold of 0.8 mmol/L at 3 of 3 visits was reached by 9 of 23 patients. 18 of 23 KD patients had higher BHB levels at 3 of 3 visits during the diet compared with BL. The horizontal gray dotted lines mark BHB threshold of 0.8 mmol/L. The vertical lines mark visits during the intervention phase. (B) Breath acetone levels during the course of water fasting periods for patients in the WF group show higher values during the 3 days of fasting compared with days of ad libitum diet. Daily mean values of acetone levels are shown. (C) Average feasibility scores of each diet group are displayed, queried with a dedicated feasibility questionnaire. Twenty-three questions assessed feasibility from −4 (not feasible at all) to +4 (very well feasible). Patients with an average score over all visits during the dietary intervention of ≥0 were counted for the feasibility endpoint, this included 22 of 23 patients in the KD group and 17 of 21 in the WF group. Mean score was 1.59 ± 0.95 in the KD group and 0.86 ± 1.70 in the WF group and is indicated by the horizontal lines. For the 2 patients who terminated the diet and left the trial we used a score of −4 for all following visits. (D) Overview of patients that reached both adherence and feasibility (KD, 10 of 23; WF, 16 of 21), only feasibility (KD, 11 of 23; WF, 0 of 21), only adherence (KD, 1 of 23; WF, 2 of 21), and neither adherence nor feasibility (KD, 1 of 23; WF, 3 of 21). (E) Analysis of exploratory BHB thresholds reached at 2 of 3 visits and their overlap with patient-reported feasibility (see also Figure S3). 1M, 1 month; 2M, 2 months; BL, baseline; BHB, beta-Hydroxybutyrate; CG, control group; EOT, end of treatment; htTKV, height-adjusted total kidney volume; htTLV, height-adjusted total liver volume; KD, ketogenic diet; WF, water fasting; p.p.m., parts per million
Figure 2
Figure 2
Ketogenic dietary interventions potently induce weight loss and primarily reduce body fat mass Changes in weight and fat mass are shown (n = 63). Black horizontal lines indicate means. p values are provided for the comparison between the control and each intervention group. (A) Relative changes in body weight from BL to EOT: CG, +0.27%; KD, −7.2%; WF, −0.77%; CG, n = 18; KD, n = 23; WF, n = 19. (B) Course of body weight for all groups and visits; CG, n = 18; KD, n = 23; WF, n = 19. Mean weight loss CG: 1M, −0.01 ± 1.09 kg; 2M, +0.51 ± 1.72; 3M, +0.32 ± 1.82 kg; KD: 1M, −3.54 ± 1.98 kg; 2M, −1.30 ± 1.31 kg; 3M, −0.84 ± 1.31 kg; WF: 1M, −0.48 ± 1.65 kg; 2M, +0.3 ± 3.01 kg; 3M, −0.8 ± 2.69 kg. (C) Relative changes in body fat from BL to EOT: CG, +2.64%; KD, −20.5%; WF, +1.15%; CG, n = 17; KD, n = 22; WF, n = 18. 4 patients (2 control, 1 KD, 1 WF) were excluded from the body composition analysis because of missing data. 1M, 1 month; 2M, 2 months; BL, baseline; CG, control group; EOT, end of treatment; KD, ketogenic diet group; WF, water fasting group.
Figure 3
Figure 3
Ketogenic dietary interventions show a signal toward decrease in htTKV and htTLV Relative changes of htTKV and htTLV from BL to EOT are displayed (n = 61). One patient in the KD group was excluded from htTLV assessment because of failure of the imaging software to upload the axial images for volumetry. p values are provided for the comparison between control and each intervention group. (A) Difference in htTKV: CG, +0.79%; KD, −0.55%; WF, 0.8%; CG, n = 19; KD, n = 23; WF, n = 19. (B) Difference in htTLV: CG, +2.04%; KD, −4.73%; WF, −0.15%; CG, n = 19; KD, n = 22; WF, n = 19. BL, baseline; CG, control group; EOT, end of treatment; htTKV, height-adjusted total kidney volume; htTLV, height-adjusted total liver volume; KD, ketogenic diet group; WF, water fasting group.
Figure 4
Figure 4
Ketogenic dietary interventions have a significant impact on eGFR Absolute and relative changes of eGFR throughout the study are displayed (n = 63). Black horizontal lines indicate means. The p values indicate the strength of evidence for a true underlying difference between the control and the two intervention groups; CG, n = 19; KD, n = 23; WF, n = 19. (A) Mean difference in creatinine-based eGFR from BL to EOT: CG, −1.74%; KD, +5.51%; WF, −0.22%. (B) Mean difference in cystatin C-based eGFR from BL to EOT: CG, −3.62%; KD, +13.9%; WF, −6.21%. (C) Mean difference of albumin-to-creatinine ratio from BL to EOT: CG, −14.32 mg/g; KD, 1.83 mg/g; WF, 10.30 mg/g. Two patients in the control group who showed a relative difference of 440% and 911%, two patients in the KD group with a relative difference of 457% and 780% and one patient in the WF group, showing 924% difference were removed from the plot but included in calculating the mean and for statistical testing. (D) Mean difference in blood pressure from BL to EOT, analyzed from average MAP values of 3 measurements per visit: CG, −0.61%; KD, +2.35%; WF, −1.63%. One patient in the control group who showed a relative difference of −23.5% is not displayed in the plot but was included in calculating the mean and for statistical testing. (E) Line graph showing evolution of absolute changes in creatinine-based eGFR at all visits from BL to FU. Mean change BL to EOT was CG, −1.25 ± 9.35 mL/m; KD, 5.03 ± 9.45 mL/m; WF, +0.31 ± 5.02 mL/m. Mean change between BL and FU was CG, −0.74 ± 1.89 mL/m; KD, +1.49 ± 0.9510.3 mL/m; WF, −1.52 ± 6.91 mL/m. 1M, 1 month; 2M, 2 months; BL, baseline; CG, control group; FU, follow-up; eGFR, estimated glomerular filtration rate; EOT, end of treatment; htTKV, height-adjusted total kidney volume; htTLV, height-adjusted total liver volume; KD, ketogenic diet group; MAP, mean arterial pressure; WF, water fasting group.
Figure 5
Figure 5
Ketogenic diet in patients with ADPKD induces significant changes in the serum lipid profile NMR analyses of changes in lipid profiles from BL to EOT are shown (n = 63). (A) Correlation plot showing the relationship between the change of different lipid parameters of serum samples including total cholesterol, LDL, HDL, non-HDL, remnant cholesterol, VLDL, size of LDL particles, size of VLDL particles, total triglycerides, ApoB, omega-3, and omega-6 with clinical parameters including assignment to the KD group vs. control, gender, BMI, weight loss, and eGFR. The correlations were calculated using Pearson’s correlation coefficient. The color coding indicates either a positive (red) or negative (blue) correlation, while the size of the circles in the scatterplot indicates the strength of the relationship. (B–M) Bar plots showing the log2 fold change (BL vs. EOT) of different lipid parameters in all three groups (control, KD, and WF). (B) Total cholesterol, (C) LDL, (D) HDL, (E) non-HDL, (F) remnant cholesterol, (G) VLDL, (H) size of LDL particles, (I) size of VLDL particles, (J) total triglycerides, (K) ApoB, (L) omega 3, and (M) omega 6. Statistical testing was performed using a model correcting for Mayo class, BMI, gender, and age. BL, baseline; CTRL, control group; EOT, end of treatment; KD, ketogenic diet group; WF, water fasting group; ApoB, apolipoprotein B; HDL, high-density lipoprotein, LDL, low-density lipoprotein; NMR, nuclear magnetic resonance spectroscopy; VLDL, very low-density lipoprotein.

References

    1. Lanktree M.B., Haghighi A., Guiard E., Iliuta I.-A., Song X., Harris P.C., Paterson A.D., Pei Y. Prevalence Estimates of Polycystic Kidney and Liver Disease by Population Sequencing. J. Am. Soc. Nephrol. 2018;29:2593–2600. doi: 10.1681/ASN.2018050493. - DOI - PMC - PubMed
    1. Bergmann C., Guay-Woodford L.M., Harris P.C., Horie S., Peters D.J.M., Torres V.E. Polycystic kidney disease. Nat. Rev. Dis. Prim. 2018;4:50. doi: 10.1038/s41572-018-0047-y. - DOI - PMC - PubMed
    1. Cornec-Le Gall E., Alam A., Perrone R.D. Autosomal dominant polycystic kidney disease. Lancet. 2019;393:919–935. doi: 10.1016/S0140-6736(18)32782-X. - DOI - PubMed
    1. Chebib F.T., Torres V.E. Autosomal Dominant Polycystic Kidney Disease: Core Curriculum 2016. Am. J. Kidney Dis. 2016;67:792–810. doi: 10.1053/j.ajkd.2015.07.037. - DOI - PMC - PubMed
    1. Müller R.U., Haas C.S., Sayer J.A. Practical approaches to the management of autosomal dominant polycystic kidney disease patients in the era of tolvaptan. Clin. Kidney J. 2018;11:62–69. doi: 10.1093/ckj/sfx071. - DOI - PMC - PubMed

Publication types

MeSH terms

Associated data