. 2023 Nov 7;14(1):6947.
doi: 10.1038/s41467-023-41954-8.

Transcriptional reprogramming by mutated IRF4 in lymphoma

Affiliations

Transcriptional reprogramming by mutated IRF4 in lymphoma

Nikolai Schleussner et al. Nat Commun. .

Abstract

Disease-causing mutations in genes encoding transcription factors (TFs) can affect TF interactions with their cognate DNA-binding motifs. Whether and how TF mutations impact upon the binding to TF composite elements (CE) and the interaction with other TFs is unclear. Here, we report a distinct mechanism of TF alteration in human lymphomas with perturbed B cell identity, in particular classic Hodgkin lymphoma. It is caused by a recurrent somatic missense mutation c.295 T > C (p.Cys99Arg; p.C99R) targeting the center of the DNA-binding domain of Interferon Regulatory Factor 4 (IRF4), a key TF in immune cells. IRF4-C99R fundamentally alters IRF4 DNA-binding, with loss-of-binding to canonical IRF motifs and neomorphic gain-of-binding to canonical and non-canonical IRF CEs. IRF4-C99R thoroughly modifies IRF4 function by blocking IRF4-dependent plasma cell induction, and up-regulates disease-specific genes in a non-canonical Activator Protein-1 (AP-1)-IRF-CE (AICE)-dependent manner. Our data explain how a single mutation causes a complex switch of TF specificity and gene regulation and open the perspective to specifically block the neomorphic DNA-binding activities of a mutant TF.


Conflict of interest statement

The authors declare no competing interests.

Figures

Fig. 1
Fig. 1. Characterization of IRF4-C99R functionality and fundamental DNA-binding alterations.
a Top, scheme of IRF4 with indication of p.Cys99Arg within the DBD. Bottom, IRF4 Sanger sequencing reads of L428 DNA (left) and cDNA (right). DBD DNA-binding domain, LD linker domain, IAD IRF association domain. b EMSA using ISRE probe and nuclear extracts of HEK293 cells transfected with IRF4-WT or mutants thereof. M, Mock control; C99A, R98A, and R98AC99A, loss-of-function mutants. Red arrow, IRF4–DNA complex. ss, supershift. ns nonspecific. Data are representative of at least three independent experiments. c BJAB cells were analyzed for gene expression changes following tet-induction of the respective IRF4 variants for the indicated times. Hierarchical clustering of 348 differentially expressed genes that change expression in either IRF4-WT or IRF4-C99R vs. Mock (M) cells. Dox doxycycline. Log2 fold changes (FC) of at least twofold are indicated in the heatmap. Experiments were performed in biologically independent duplicates and log2 FC values are from two averaged replicates per condition. d Nuclear extracts of HEK293 cells transfected with JUNB and BATF and increasing amounts of IRF4 variants were analyzed by EMSA for binding at AICE1 (AICE1 (Ctla4) and AICE1 (IL12Rb)) and AICE2 (AICE (Bcl11b)) probes. BP binding pattern. Red and blue arrows mark positions of IRF4-JUNB/BATF-DNA and JUNB/BATF-DNA complexes, respectively. EMSA of SP1 is shown as a control. Data are representative of at least three independent experiments. e EMSAs using wild-type AICE2 (BCL11b) probe (left) or variants thereof with reverse complement IRF motif (center left, AICE2FLIP), or IRF motifs positioned 3′ relative the AP-1 motif (center right and right). Extracts and complex positions are as in (d). Data are representative of at least three independent experiments. f Binding of JUNB/BATF together with increasing amounts of IRF4-WT or IRF4-C99R to AICE2 (Bcl11b) with a T > C mutant thereof at position -4 relative to the IRF motif. Extracts and complex positions are as in (d). Data are representative of at least three independent experiments. g IRF4-C99R docking to ISRE. This modeling is based on the previous crystal structure of IRF4-WT:ISRE DNA (PDB: 7JM4), in which C99 was substituted with R. ISRE-sequence is shown underneath; numbered bases of the upper strand shown in the image above. Blue/slate, IRF4 (both WT and C99R); orange, DNA phosphate backbone; pale green, dA and dT; gray, dG and dC. Source data for (b, df) are provided in the Source Data file.
Fig. 2
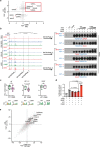
Fig. 2. IRF4-C99R is associated with genome-wide increased and distinct DNA-binding patterns at canonical and non-canonical AICE2 sites in C99R mutation-positive lymphoma cells.
a Digital genomic footprinting (DGF) analyses showing occupancy at AICE2, AICE2FLIP, AICE2-4T, and AICE2-4C sites (horizontal) in L428IRF4-C99R HL cells, KM-H2IRF4-WT HL and REH non-Hodgkin cells (vertical). Red and blue lines represent the forward and reverse strands. b Correlation between L428IRF4-C99R/KM-H2IRF4-C99R DNaseI-Seq fold change defining three classes of elements, designated groups 1–3, (left) and log2 gene expression fold change (right). c Motif frequencies in DHSs defined in (b). d HOMER de novo motif discovery in specific DHSs defined in (b). e Heatmap showing Spearman′s correlation clustering from IRF4 and JUNB ChIP-Seq experiments on the union of IRF4 peaks from L428IRF4-C99R, KM-H2IRF4-WT and GM12878 cells. f Venn diagram-overlaps between IRF4 and JUNB ChIP peaks in GM12878, KM-H2IRF4-WT and L428IRF4-C99R cells. g L428/KM-H2 IRF4 ChIP peak fold change analyses (left) showing corresponding JUNB ChIP peaks (center), DHSs (right) as well as gene expression fold changes (far right). h Motif frequencies in KM-H2IRF4-WT-, shared and L428IRF4-C99R-specific ChIP peaks. i De novo motif discovery in specific ChIP-seq datasets using ExplaiNN. Motifs are ranked by their importance (left). When more than one motif of the same class was identified, the rank of the displayed motif is underlined. Only motifs that could be annotated with a biological representation are shown. All DGF/DNase-Seq/ChIP-Seq/RNA-Seq values are from two averaged replicates per condition. P values were determined by two-tailed unpaired t test without adjustment for multiple comparisons.
Fig. 3
Fig. 3. IRF4-C99R blocks IRF4-dependent plasma cell induction and regulates less but distinct genes compared to IRF4-WT.
a Following culture with LPS + IL-4, C57BL/6 mouse splenic B cells were transduced with MIG control retrovirus (MIG-ctrl; Mock), IRF4-WT, IRF4-C99R or, as a further control, IRF4-R98AC99A. Transduced GFP+ cells were analyzed by flow cytometry for expression of CD138 and B220. Top left panels, the indication of the percentage of living transduced cells in representative FACS profiles. Bottom left panels, analysis of CD138 and B220 in gated GFP+ cells. The percentage of CD138highB220low cells is indicated. Right, the mean ± SEM of n = 4 independent experiments is shown. P values were determined by two-tailed unpaired Student′s t test; ns, not significant. bf Isolated murine splenic B cells transduced with IRF4-WT, IRF4-C99R, IRF4-R98AC99A, or MIG control (Mock) were analyzed by RNA-Seq. Experiments were performed in biologically independent triplicates (n = 3). b Spearman correlation of the various samples. Note, that the Mock and the IRF4-R98AC99A-LOF transduced cells cluster together, and that IRF4-C99R clusters in between these and IRF4-WT samples. c Volcano plots of genes differentially regulated between IRF4-WT versus Mock and IRF4-C99R versus Mock (MIG-ctrl). Note, that IRF4-C99R regulates less genes compared to IRF4-WT. d IRF4-C99R and IRF-WT regulated genes show only low overlap, as shown in UpSet plots for overall differentially regulated genes (left, top panel) and upregulated genes (left, bottom panel), as well as in overall comparisons of complete transcriptomes (right panel). e Differentially regulated genes by IRF4-C99R were compared to gene expression of lymphoid and myeloid cell types. Note, that the IRF4-C99R-dowregulated genes correspond to genes expressed in plasma cells or IRF4-WT-induced genes (green rectangle), whereas the IRF4-C99R-upregulated genes show specific expression in myeloid cells (red rectangle). GMP granulocyte/monocyte progenitor, BM bone marrow, PC plasma cell. f Comparison of IRF4-C99R fold change with ratio of gene expression from plasma cells and monocytes. The Spearman correlation between the log2 fold changes of plasma cells/blood monocytes versus C99R/WT was –0.39, with a P value less than 10−5. The number of genes compared was 12642. Source data for figure part 3a, right are provided in the Source Data file.
Fig. 4
Fig. 4. IRF4-C99R upregulated genes encompass cHL hallmark genes in a non-canonical AICE2-dependent manner.
a Comparison of fold changes between IRF4-C99R-induced genes in mouse splenic B cells with differentially expressed genes of Hodgkin and non-Hodgkin cell lines based on microarray gene expression analyses. The Spearman correlation between the log2 fold changes of cHL (L428, L1236, KM-H2, HDLM-2)/non-cHL (REH, NAMALWA, SU-DHL-4) cell lines versus C99R/MIG was –0.25, with a P value less than 10−5. The number of genes compared was 434, comprising the most differentially expressed genes from microarray analyses between cHL and non-cHL cell lines. Note, that IRF4-C99R-induced genes include the known HL-hallmark genes GATA3, CCL5 (RANTES), and TNFRSF8 (CD30) (red rectangle). b Left, UCSC Genome Browser screenshot of REH, GM12878, KM-H2IRF4-WT and L428IRF4-C99R DHSs (red) as well as IRF4 (blue) and JUNB (green) ChIP peaks at the GATA3 gene locus. L428IRF4-C99R-specific ChIP peaks used for EMSA analyses are indicated by gray bars and designated as GATA3Peak_1, GATA3Peak_2, and GATA3Peak_3. Right, HEK293 cells were control transfected (–), or transfected with IRF4-WT, IRF4-C99R, JUNB and BATF, or combinations thereof, as indicated. Nuclear extracts were analyzed for DNA-binding activity at WT and ISRE-mutated GATA3Peak_1, GATA3Peak_2 and GATA3Peak_3 sites. EMSA data show one out of three independent experiments. c Information content (in bits; y axis) of half-ISRE motifs within motifs identified in the ChIP-seq data of L428IRF4-C99R (purple) or KM-H2IRF4-WT (green) cells present in any motif (i.e., all; left, WT n = 8; C99R n = 10), or annotated as AICE BP1−3 (center, WT n = 4; C99R n = 6) or ISRE (right, WT n = 4, C99R n = 4). The logos underneath of each plot represent the summary of the half-ISRE motif for each condition. All ChIP-Seq values are from two averaged replicates per condition. All box-whisker blots represent the median (central line), 25th–75th percentile (bounds of the box) and minimum–maximum (whiskers). Statistical significance was computed using the Welch′s t test (one-tailed). d HEK293 cells were transfected with reporter construct encompassing GATA3Peak_1 together with AP-1 (JUNB and BATF) and IRF4 variants. Luciferase activity is shown as fold activation compared to that of control transfected cells (far left), which is set as 1. Statistics were derived from n = 3 independent transfections, the mean ± SEM is shown. P values were determined by two-tailed unpaired Student′s t test. One out of three independent experiments is shown. e Comparison of gene expression changes between cell lines harboring C99R mutation (C99R/WT cHL) versus fold change between HL and non-Hodgkin cell lines based on RNA-seq analyses. The Spearman correlation between the log2 fold changes of cHL/non-cHL versus C99R cHL/WT cHL was 0.88, with a P value of less than 10−5. C99R-containing cHL cell lines were L428 and U-HO1, while the WT cell lines were L1236, KM-H2, HDLM-2 and L540Cy. Non-cHL cell lines were REH, NAMALWA, SU-DHL−4 and BJAB. Source data for (bd) are provided in the Source Data file.

References

    1. Brady SW, et al. The genomic landscape of pediatric acute lymphoblastic leukemia. Nat. Genet. 2022;54:1376–1389. doi: 10.1038/s41588-022-01159-z. - DOI - PMC - PubMed
    1. Rosenbauer F, Tenen DG. Transcription factors in myeloid development: balancing differentiation with transformation. Nat. Rev. Immunol. 2007;7:105–117. doi: 10.1038/nri2024. - DOI - PubMed
    1. Rui L, Schmitz R, Ceribelli M, Staudt LM. Malignant pirates of the immune system. Nat. Immunol. 2011;12:933–940. doi: 10.1038/ni.2094. - DOI - PubMed
    1. Roos-Weil D, et al. A recurrent activating missense mutation in Waldenström macroglobulinemia affects the DNA binding of the ETS transcription factor SPI1 and enhances proliferation. Cancer Discov. 2019;9:796–811. doi: 10.1158/2159-8290.CD-18-0873. - DOI - PubMed
    1. Lazarian G, et al. A hotspot mutation in transcription factor IKZF3 drives B cell neoplasia via transcriptional dysregulation. Cancer Cell. 2021;39:380–393.e8. doi: 10.1016/j.ccell.2021.02.003. - DOI - PMC - PubMed

Publication types