. 2023 Nov 7;9(1):110.
doi: 10.1038/s41421-023-00602-7.

SGF29 nuclear condensates reinforce cellular aging

Affiliations

SGF29 nuclear condensates reinforce cellular aging

Kaowen Yan et al. Cell Discov. .

Erratum in

Abstract

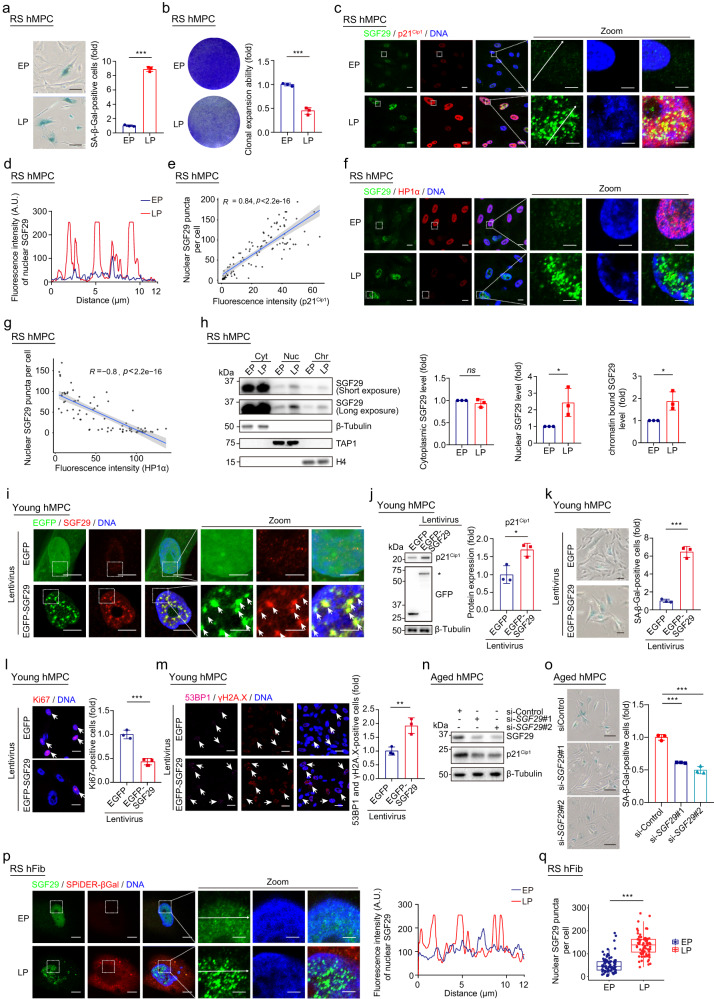
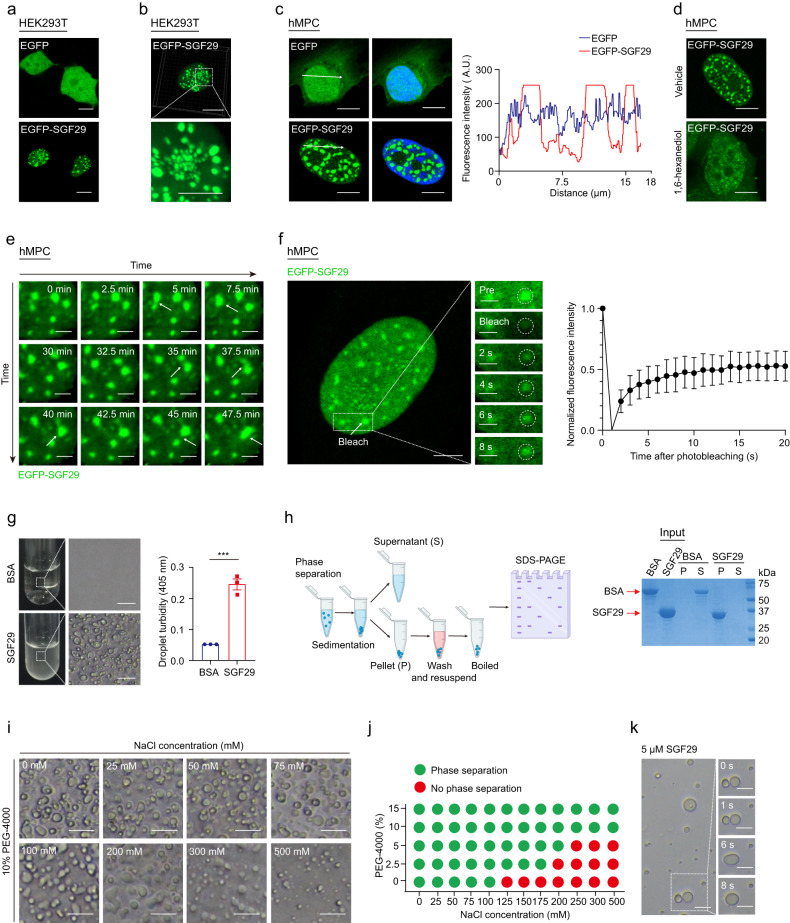
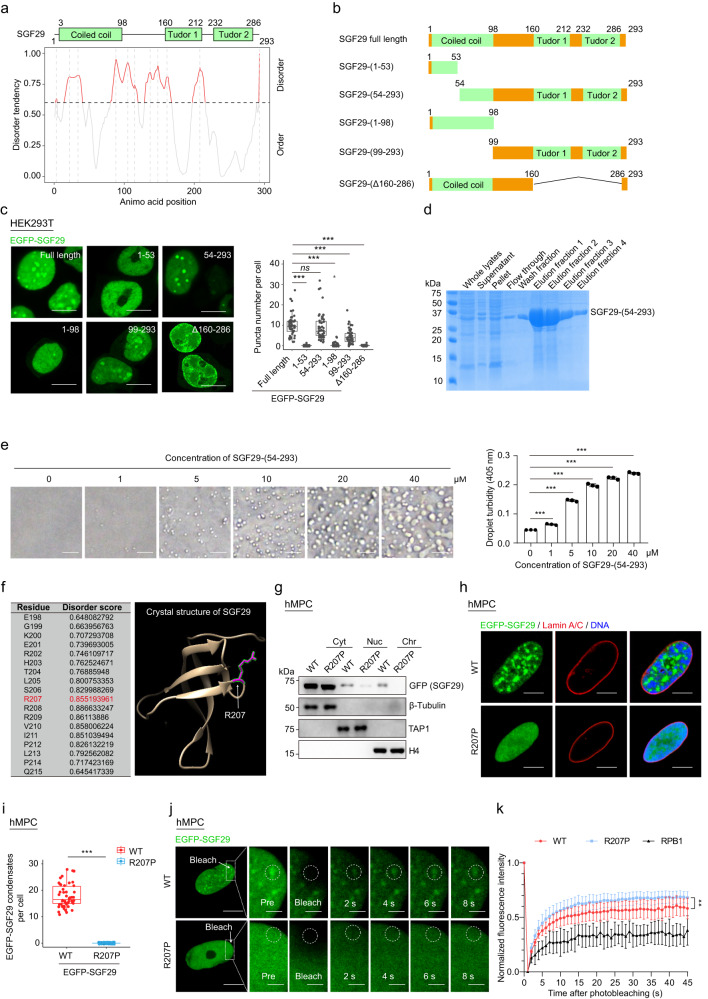
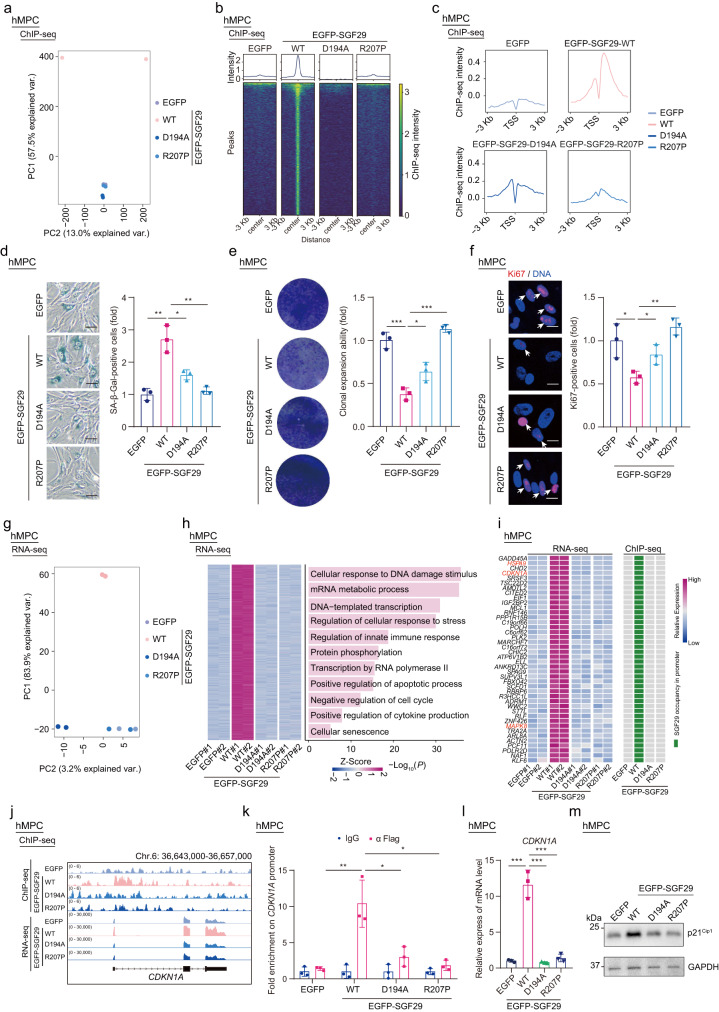
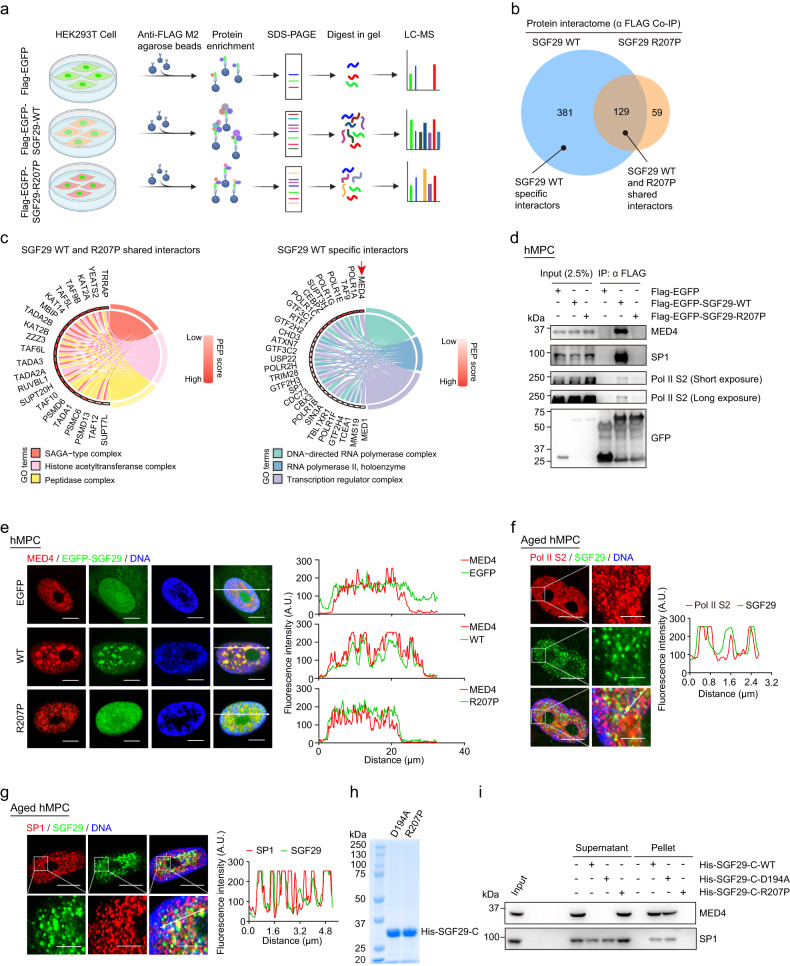
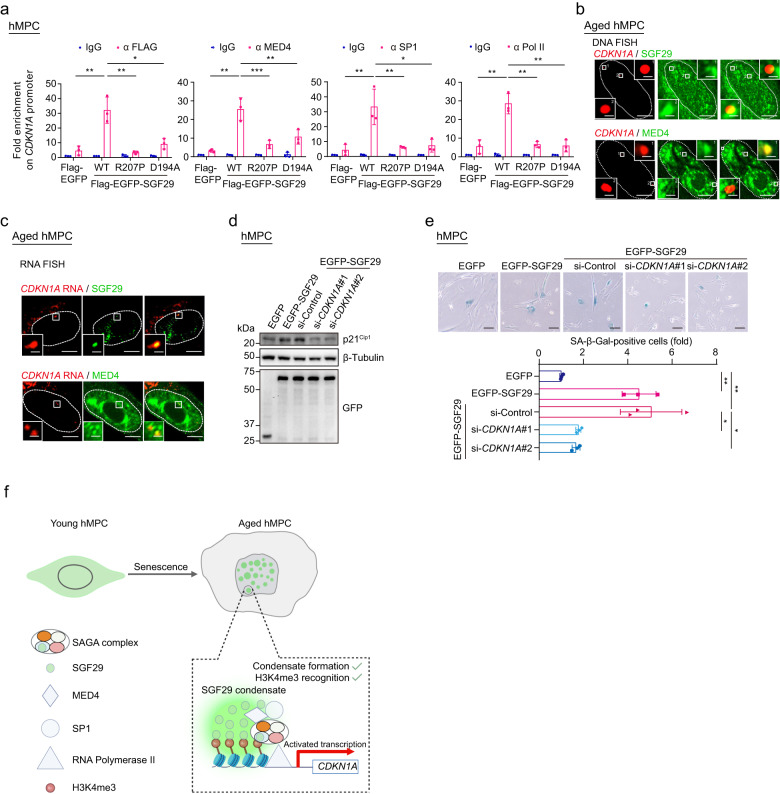
Phase separation, a biophysical segregation of subcellular milieus referred as condensates, is known to regulate transcription, but its impacts on physiological processes are less clear. Here, we demonstrate the formation of liquid-like nuclear condensates by SGF29, a component of the SAGA transcriptional coactivator complex, during cellular senescence in human mesenchymal progenitor cells (hMPCs) and fibroblasts. The Arg 207 within the intrinsically disordered region is identified as the key amino acid residue for SGF29 to form phase separation. Through epigenomic and transcriptomic analysis, our data indicated that both condensate formation and H3K4me3 binding of SGF29 are essential for establishing its precise chromatin location, recruiting transcriptional factors and co-activators to target specific genomic loci, and initiating the expression of genes associated with senescence, such as CDKN1A. The formation of SGF29 condensates alone, however, may not be sufficient to drive H3K4me3 binding or achieve transactivation functions. Our study establishes a link between phase separation and aging regulation, highlighting nuclear condensates as a functional unit that facilitate shaping transcriptional landscapes in aging.


Conflict of interest statement

The authors declare no competing financial interests.

Figures

Fig. 1
Fig. 1. SGF29 forms nuclear condensate in senescent cells and its overexpression promotes cellular aging in hMPCs.
a SA-β-Gal staining of WT hMPCs at early passage (EP, P5) and late passage (LP, P16). Left, representative images of SA-β-Gal staining. Scale bars, 50 μm. Right, quantitation of the relative percentages of SA-β-Gal-positive cells. Data are presented as the mean ± SEM. n = 3 biological replicates. Over 100 cells were quantified in each replicate. ***P < 0.001 (t-test). b Clonal expansion assay in WT hMPCs at EP (P5) and LP (P16). Left, representative images of crystal violet staining. Right, quantification of the relative clonal expansion ability of EP and LP hMPCs. Data are presented as the mean ± SEM. n = 3 biological replicates. ***P < 0.001 (t-test). c Immunofluorescence staining of p21Cip1 and SGF29 in hMPCs at EP (P5) and LP (P16). Scale bars, 10 μm and 2.5 μm (zoomed-in image). d Quantification of the fluorescence intensity along the inset arrows in (c) following the arrow direction. e Correlation between the fluorescence intensity of p21Cip1 and the number of nuclear SGF29 puncta. n = 100 hMPCs. Each dot represents one cell. The SGF29 condensate with a size greater than 0.196 μm2 (area) was quantified as a SGF29 punctum. f Immunofluorescence staining of HP1α and SGF29 in hMPCs at EP (P5) and LP (P16). Scale bars, 10 μm and 2.5 μm (zoomed-in image). g Correlation between the fluorescence intensity of HP1α and the number of nuclear SGF29 puncta. n = 100 hMPCs. Each dot represents one cell. The SGF29 condensate with a size greater than 0.196 μm2 (area) was quantified as a SGF29 punctum. h Western blot analysis of the abundance of SGF29 in the cytoplasmic (Cyt), nuclear soluble (Nuc) and chromatin-associated (Chr) fractions in hMPCs at EP (P5) and LP (P16). β-Tubulin, TAP1, and H4 were used as the loading control for indicated fraction, respectively. Left, representative images of western blotting. Right, quantification of the relative protein levels of SGF29 in indicated fractions. n =3 independent experiments. Data are presented as the means ± SEM. ns, not significant; *P < 0.05 (t-test). i Immunofluorescence staining of SGF29 in EP WT hMPCs (P5, young hMPCs) transduced with lentiviruses expressing either EGFP or EGFP-SGF29. The white arrowheads denote the SGF29 puncta. Scale bars, 10 μm and 2.5 μm (zoomed-in image). j Western blot analysis of p21Cip1 in EP WT hMPCs (P5, young hMPCs) transduced with lentiviruses expressing either EGFP or EGFP-SGF29. Left, representative images of western blotting. The band of exogenous EGFP-SGF29 protein is marked with *. β-Tubulin was used as the loading control. Right, quantitation of the relative protein levels of p21Cip1. Data are presented as the means ± SEM. n = 3 biological replicates. *P < 0.05 (t-test). k SA-β-Gal staining of EP WT hMPCs (P5, young hMPCs) transduced with lentiviruses expressing either EGFP or EGFP-SGF29. Left, representative images of SA-β-Gal staining. Scale bars, 20 μm. Right, quantitation of the relative percentages of SA-β-Gal-positive cells. Data are presented as the mean ± SEM. n = 3 biological replicates. Over 100 cells were quantified in each replicate. ***P < 0.001 (t-test). l Immunofluorescence staining of Ki67 in EP WT hMPCs (P5, young hMPCs) transduced with lentiviruses expressing either EGFP or EGFP-SGF29. Left, representative images of Ki67 immunofluorescence. The white arrowheads denote the Ki67-positive cells. Scale bars, 20 μm. Right, quantification of the relative percentages of Ki67-positive cells. Data are presented as the mean ± SEM. n = 3 biological replicates. Over 100 cells were quantified in each replicate. ***P < 0.001 (t-test). m Immunofluorescence staining of γH2A.X and 53BP1 in EP WT hMPCs (P5, young hMPCs) transduced with lentiviruses expressing either EGFP or EGFP-SGF29. Left, representative images of γH2A.X and 53BP1 immunofluorescence. The white arrowheads denote the γH2A.X and 53BP1-positive cells. Scale bars, 20 μm. Right, quantification of the relative percentages of γH2A.X and 53BP1-positive cells. Data are presented as the mean ± SEM. n = 3 biological replicates. Over 100 cells were quantified in each replicate. **P < 0.01 (t-test). n Western blot analysis of SGF29 in LP WT hMPCs (P16, aged hMPCs) after treatment with si-Control or si-SGF29. β-Tubulin was used as the loading control. o SA-β-Gal staining of LP WT hMPCs (P16, aged hMPCs) after treatment with si-Control or si-SGF29. Left, representative images of SA-β-Gal staining. Scale bars, 50 μm. Right, quantitation of the relative percentages of SA-β-Gal-positive cells. Data are presented as the mean ± SEM. n = 3 biological replicates. Over 100 cells were quantified in each replicate; ***P < 0.001 (t-test). p Immunofluorescence staining of SPIDER-βGal and SGF29 in human fibroblasts (hFib) at EP (P13) and LP (P23). Left, representative images of SPIDER-βGal and SGF29 immunofluorescence. Right, quantification of the fluorescence intensity along the line embedded in the zoomed-in images following the arrow direction. Scale bars, 10 μm and 2.5 μm (zoomed-in image). q Quantification of the number of SGF29 puncta in human fibroblasts at EP (P13) and LP (P23) in Fig. 1p. n = 80 hFib cells. Data are shown as means ± SEM. ***P < 0.001 (t-test).
Fig. 2
Fig. 2. SGF29 spontaneously and reversibly assembles into liquid droplets.
a Representative images of the HEK293T cells overexpressing either EGFP or EGFP-SGF29. Scale bars, 10 μm. b Representative 3D-reconstructed confocal images of the HEK293T cells overexpressing EGFP-SGF29. Scale bars, 10 μm and 5 μm (zoomed-in image). c Representative images of hMPCs overexpressing either EGFP or EGFP-SGF29. Quantification of the fluorescence intensity along the line embedded in images following the arrow direction is on the right. Scale bars, 10 μm. d Representative images of hMPCs before and after treatment with 10% v/v 1, 6-hexanediol (1, 6-HD) for 1 min. Scale bars, 10 μm. e Time-lapse images taken with a confocal microscopy, along with magnified illustrations, showing two adjacent EGFP-SGF29 aggregates fusing in hMPCs at the time point of 47.5-min. Scale bars, 2.5 μm. f Live-cell images of fluorescence recovery after photobleaching (FRAP) experiments in hMPCs expressing EGFP-SGF29. Left, representative time-lapse FRAP images of EGFP-SGF29 in hMPCs. Right, quantification of fluorescence intensity during FRAP assay. n = 7 hMPCs. Scale bars, 5 μm and 2.5 μm (zoomed-in image). g Differential interference contrast (DIC) microscopy analysis of test tube containing 5 μM BAS or 5 μM SGF29 at 25 °C. Left, representative DIC images. Scale bars, 50 μm. Right, quantification of the indicated droplet turbidity. Data are presented as the mean ± SEM. n = 3 biological replicates. ***P < 0.001 (t-test). h Sedimentation assay for SGF29. Left, diagram of the sedimentation assay which separates the condensed liquid phase and the aqueous phase for SDS-PAGE and Coomassie blue staining assays. Right, the BSA and SGF29 levels of the input, the solution (Supernatant, S) and separated droplets (Pellet, P) were assessed. i Formation of SGF29 droplets in 10% PEG-4000 solution containing different NaCl concentrations at 25 °C. Scale bars, 50 μm. j Diagram showing the formation of SGF29 droplets in buffers containing different NaCl concentrations and PEG-4000 concentrations. k The time-lapse images displaying fusion of SGF29 droplets in vitro. Scale bars, 50 μm.
Fig. 3
Fig. 3. Tudor domains and Arginine 207 are necessary for SGF29 phase separation.
a Protein sequence and disorder prediction (PONDR) of the SGF29. The number on the top represents the position of amino acids (aa). b Schematic diagram for EGFP-SGF29 truncation mutants. c Immunofluorescence images of EGFP-SGF29 truncation mutants in HEK293T cells. Left, representative immunofluorescence images. Right, quantification for the condensate numbers of EGFP-SGF29 truncation mutants in HEK293T cells. Data are shown as means ± SEM. n = 50 HEK293T cells. Scale bars, 10 μm. ns, not significant; ***P < 0.001 (t-test). d Coomassie blue staining of purified recombinant SGF29-(54-293) after being resolved on SDS-PAGE. e Formation of phase-separated condensates of purified recombinant SGF29 (54–293aa) forms phase-separated condensates at the indicated concentrations. Left, representative phase images for SGF29-(54–293) droplets. Scale bars, 50 μm. Right, quantification for the turbidity of SGF29-(54–293) droplet. Data are presented as the mean ± SEM. n = 3 biological replicates; ***P < 0.001 (t-test). f The PONDR and the crystal structure of SGF29. The white arrowheads indicate the position of Arg 207 residue in the crystal structure of SGF29. g Subcellular fractionation of exogenous EGFP-SGF29 in the cytoplasmic (Cyt), nuclear soluble (Nuc) and chromatin-associated (Chr) fractions in EP WT hMPCs (P5, young hMPCs) transduced with lentiviruses expressing EGFP-SGF29-WT (WT) or EGFP-SGF29-R207P (R207P). β-Tubulin, TAP1, and H4 were used as the loading control, respectively. h Representative images of hMPCs transduced with lentiviruses expressing either EGFP-SGF29-WT (WT) or EGFP-SGF29-R207P (R207P). Scale bars, 10 μm. i Quantification of SGF29 puncta number per cell in hMPCs transduced with lentiviruses expressing either EGFP-SGF29-WT (WT) or EGFP-SGF29-R207P (R207P). n = 50 hMPCs. Data are presented as the mean ± SEM. ***P < 0.001 (t-test). j Representative time-lapse FRAP images acquired in hMPCs transduced with lentiviruses expressing either EGFP-SGF29-WT (WT) or SGF29-R207P (R207P) with magnified insets showing the pre-bleach and recovery signals of EGFP-SGF29-WT (WT), EGFP-SGF29-R207P (R207P), respectively. Scale bars, 10 μm and 2.5 μm (zoomed-in image). k The curve showing the quantification of fluorescence intensity in FRAP recovery assay indicated in Fig. 3j and Supplementary Fig. S5c. EGFP-RPB1 was used as the slow recovery control. n = 7 hMPCs. **P < 0.01 (t-test).
Fig. 4
Fig. 4. SGF29 phase separation directs a transcriptional program favorable to senescence.
a Principal Component Analysis (PCA) of SGF29 ChIP-seq data in hMPCs (P13) with CRISPR/Cas9-mediated knockdown of endogenous SGF29 followed by overexpression of EGFP, EGFP-SGF29-WT (WT), EGFP-SGF29-D194A (D194A) and EGFP-SGF29-R207P (R207P) variants, respectively. b Heatmap showing the chromatin occupancy profiles of SGF29 in hMPCs (P13) with CRISPR/Cas9-mediated knockdown of endogenous SGF29 followed by expression of EGFP, EGFP-SGF29-WT (WT), EGFP-SGF29-D194A (D194A) and EGFP-SGF29-R207P (R207P) variants, respectively. Peaks identified in hMPCs with CRISPR/Cas9-mediated knockdown of endogenous SGF29 followed by overexpression of EGFP-SGF29-WT (n = 2890) were used for comparison in all groups. c Metaplots showing the enriched levels of SGF29 occupancies surrounding the TSS regions for protein-coding genes in hMPCs (P13) with CRISPR/Cas9-mediated knockdown of endogenous SGF29 followed by overexpression of EGFP, EGFP-SGF29-WT (WT), EGFP-SGF29-D194A (D194A) and EGFP-SGF29-R207P (R207P) variants, respectively. d SA-β-Gal staining of hMPCs (P13) with CRISPR/Cas9-mediated knockdown of endogenous SGF29 followed by expression of EGFP, EGFP-SGF29-WT (WT), EGFP-SGF29-D194A (D194A) and EGFP-SGF29-R207P (R207P) variants, respectively. Left, representative images of SA-β-Gal staining. Scale bars, 50 μm. Right, quantitation of the relative percentages of SA-β-Gal-positive cells. Data are presented as the mean ± SEM. n = 3 biological replicates. Over 100 cells were quantified in each replicate. *P < 0.05; **P < 0.01 (t-test). e Clonal expansion assay in hMPCs (P13) with CRISPR/Cas9-mediated knockdown of endogenous SGF29 followed by overexpression of EGFP, EGFP-SGF29-WT (WT), EGFP-SGF29-D194A (D194A) and EGFP-SGF29-R207P (R207P) variants, respectively. Left, representative images of crystal violet staining. Right, quantification of the relative clonal expansion ability. Data are presented as the mean ± SEM. n = 3 biological replicates. *P < 0.05, ***P < 0.001 (t-test). f Immunofluorescence staining of Ki67 in hMPCs (P13) with CRISPR/Cas9-mediated knockdown of endogenous SGF29 followed by overexpression of EGFP, EGFP-SGF29-WT (WT), EGFP-SGF29-D194A (D194A) and EGFP-SGF29-R207P (R207P) variants, respectively. Left, representative images of Ki67 immunofluorescence staining. Scale bars, 20 μm. Right, quantification of the relative percentages of Ki67-positive cells. Data are presented as the mean ± SEM. n = 3 biological replicates. Over 100 cells were quantified in each replicate. *P < 0.05; **P < 0.01 (t-test). g PCA of transcriptomic profiles in hMPCs (P13) with CRISPR/Cas9-mediated knockdown of endogenous SGF29 followed by overexpression of EGFP, EGFP-SGF29-WT (WT), EGFP-SGF29-D194A (D194A) and EGFP-SGF29-R207P (R207P) variants, respectively. h Heatmap showing the relative expression of indicated genes, which were activated in hMPCs expressing EGFP-SGF29-WT (WT) but remained silent in hMPCs expressing EGFP-SGF29-D194A (D194A) and EGFP-SGF29-R207P (R207P) mutants, in all groups. Representative Gene Ontology (GO) terms are shown on the right. i Heatmaps showing the relative transcriptional levels and SGF29 occupancies surrounding the TSS regions of 42 genes, which were activated in hMPCs expressing SGF29-WT but remained silent in hMPCs expressing EGFP, or D194A and R207P mutants. j Integrative Genome Viewer tracks of the ChIP-seq and RNA-seq signals at CDKN1A locus in hMPCs (P13) with CRISPR/Cas9-mediated knockdown of endogenous SGF29 followed by overexpression of EGFP, EGFP-SGF29-WT (WT), EGFP-SGF29-D194A (D194A) and EGFP-SGF29-R207P (R207P) variants, respectively. k Bar plot showing the ChIP-qPCR detection of the SGF29 enrichment at CDKN1A promoter in hMPCs (P13) with CRISPR/Cas9-mediated knockdown of endogenous SGF29 followed by overexpression of EGFP, EGFP-SGF29-WT (WT), EGFP-SGF29-D194A (D194A) and EGFP-SGF29-R207P (R207P) variants, respectively. Data are presented as the mean ± SEM. n = 3 biological replicates. *P < 0.05; **P < 0.01 (t-test). l Bar plot showing the qPCR detection of the mRNA levels of CDKN1A in hMPCs (P13) with CRISPR/Cas9-mediated knockdown of endogenous SGF29 followed by expression of EGFP, EGFP-SGF29-WT (WT), EGFP-SGF29-D194A (D194A) and EGFP-SGF29-R207P (R207P) variants, respectively. Data are presented as the mean ± SEM. n = 3 biological replicates. ***P < 0.001 (t-test). m Western blotting detected the protein expression of p21Cip1 in hMPCs (P13) with CRISPR/Cas9-mediated knockdown of endogenous SGF29 followed by expression of EGFP, EGFP-SGF29-WT (WT), EGFP-SGF29-D194A (D194A) and EGFP-SGF29-R207P (R207P) variants, respectively.
Fig. 5
Fig. 5. Identification of SGF29 interacting proteins sensitive to condensate perturbation.
a Flow chart of the mass spectrometry strategy for the identification of EGFP-SGF29-WT (WT) and EGFP-SGF29-R207P (R207P) interacting proteins. Flag-EGFP was used as a control. b Shared and specific interacting proteins of EGFP-SGF29-WT (WT) and EGFP-SGF29-R207P (R207P) identified by mass spectrometry. c Chord diagrams showing the enriched pathways of shared interaction partners of EGFP-SGF29-WT (WT) and EGFP-SGF29-R207P (R207P) (left) and those of specific protein interaction partners of EGFP-SGF29-WT (right). d Co-IP analysis showing the interaction between indicated proteins and EGFP-SGF29-WT (WT) and EGFP-SGF29-R207P (R207P) in hMPCs. e Immunofluorescence staining of MED4 in hMPCs transduced with lentiviruses expressing either EGFP, EGFP-SGF29-WT (WT) or EGFP-SGF29-R207P (R207P). Left, representative images. Scale bar, 10 μm. Right, quantification of the fluorescence intensity along the line embedded the image following the arrow direction. f Immunofluorescence staining of Pol II S2 and SGF29 in senescent hMPCs. Left, representative images. Scale bars, 10 μm and 5 μm (zoomed-in image). Right, quantification of the fluorescence intensity along the line embedded the image following the arrow direction. g Immunofluorescence staining of SP1 and SGF29 in senescent hMPCs. Left, representative images. Scale bars, 10 μm and 5 μm (zoomed-in image). Right, quantification of the fluorescence intensity along the line embedded the image following the arrow direction. h Coomassie blue staining of purified recombinant SGF29-C-D194A and SGF29-C-R207P after being resolved on SDS-PAGE. i Pelleting assay show that SGF29-C-D194A and SGF29-C-R207P interact with MED4 and SP1.
Fig. 6
Fig. 6. SGF29 and coactivators form condensates at the CDKN1A promoter to accelerate cell senescence.
a Bar plot showing the enrichment of indicated proteins at the promoter of CDKN1A in hMPCs transduced with lentiviruses expressing either Flag-EGFP, Flag-EGFP-SGF29-WT (WT), Flag-EGFP-SGF29-R207P (R207P) or Flag-EGFP-SGF29-D194A (D194A). Data are presented as the mean ± SEM. n = 3 biological replicates. **P < 0.01, *P < 0.05 (t-test). b Immunofluorescence images of senescent hMPCs showing that SGF29 (green) colocalizes with CDKN1A gene (red) at the SGF29 or MED4 droplets. Scale bars, 10 μm and 1 μm (zoomed-in image). c Immunofluorescence images of senescent hMPC showing that MED4 (green) colocalizes with CDKN1A RNA (red) at the SGF29 or MED4 droples. Scale bars, 10 μm and 1 μm (zoomed-in image). d Western blot analysis for GFP and p21Cip1 in hMPCs transduced with lentiviruses expressing EGFP-SGF29 followed by knockdown of CDKN1A (p21Cip1) using siRNA. β-tubulin was used as the loading control. e SA-β-Gal staining of hMPCs transduced with lentiviruses expressing EGFP-SGF29 followed by knockdown of CDKN1A (p21Cip1) using siRNA. Top, representative images of SA-β-Gal staining. Scale bars, 50 μm. Bottom, quantification of the relative percentages of SA-β-Gal-positive cells. Data are presented as the mean ± SEM. n = 3 biological replicates. Over 100 cells were quantified in each replicate. **P < 0.01 (t-test). f The proposed model illustrates the pivotal role of SGF29 condensates in facilitating promoter-binding of SGF29 and recruitment of transcriptional factor and co-activators to target specific genomic loci, thereby initiating expression of senescence-related genes, such as CDKN1A.

References

    1. Cai, Y. et al. The landscape of aging. Sci. China Life Sci.65, 2354–2454 (2022). - PMC - PubMed
    1. Partridge, L., Deelen, J. & Slagboom, P. E. Facing up to the global challenges of ageing. Nature561, 45–56 (2018). - PubMed
    1. Aging Biomarker Consortium, et al. Biomarkers of aging. Sci. China Life Sci.66, 893–1066 (2023). - PMC - PubMed
    1. Lopez-Otin, C., Blasco, M. A., Partridge, L., Serrano, M. & Kroemer, G. Hallmarks of aging: an expanding universe. Cell186, 243–278 (2022). - PubMed
    1. Zhao, D. et al. Failures at every level: breakdown of the epigenetic machinery of aging. Life Med. 1, 81–83 (2022). - PMC - PubMed