. 2023 Nov 7;13(1):19317.
doi: 10.1038/s41598-023-46032-z.

Environmental pressures and pesticide exposure associated with an increase in the share of plant-based foods in the diet

Affiliations

Environmental pressures and pesticide exposure associated with an increase in the share of plant-based foods in the diet

Emmanuelle Kesse-Guyot et al. Sci Rep. .

Abstract

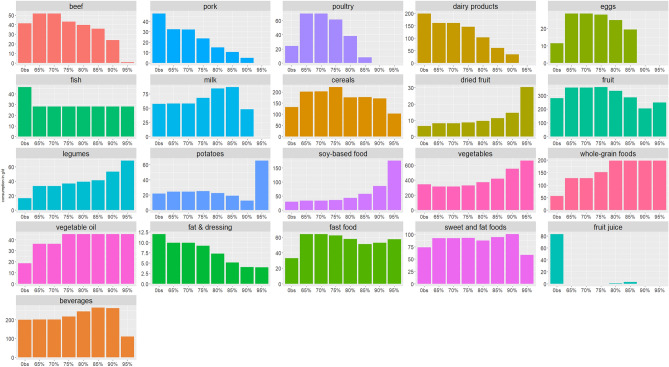
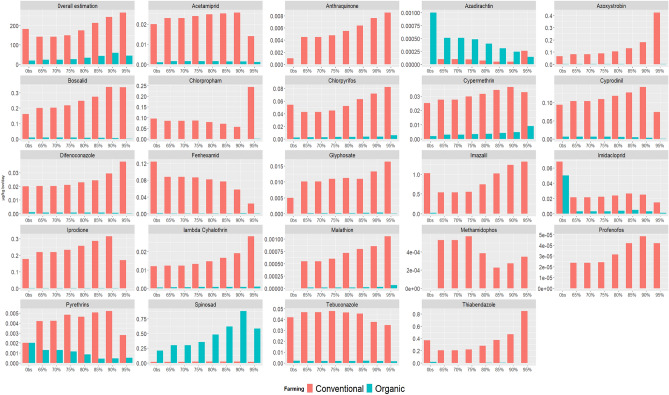
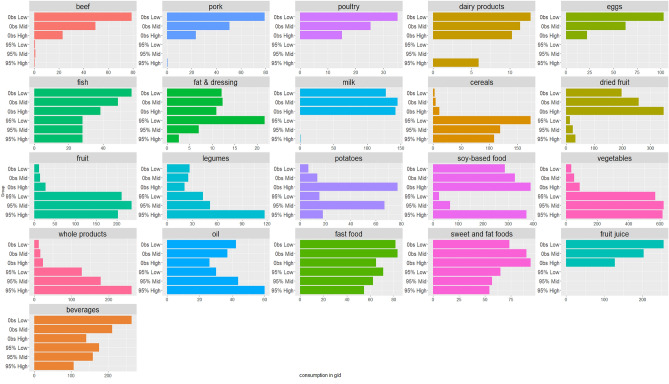
Diets rich in plant-based foods are encouraged for human health and to preserve resources and the environment but the nutritional quality and safety of such diets is debated. This study aimed to model nutritionally adequate diets with increasing plant food content and to characterise the derived diets using a multicriteria approach including, nutrients intake, environmental pressures and exposure to pesticides. Using data of the NutriNet-Santé cohort (N = 29,413), we implemented stepwise optimization models to identified maximum plant-food content under nutritional constraints. Environmental indicators at the production level were derived from the DIALECTE database, and exposure to pesticide residues from plant food consumption was estimated using a contamination database. Plant-based foods contributed to 64.3% (SD = 10.6%) of energy intake in observed diets and may reach up to 95% in modelled diets without jeopardizing nutritional status. Compared to the observed situation, an increase in plant-based foods in the diets led to increases in soy-based products (+ 480%), dried fruits (+ 370%), legumes (+ 317%), whole grains (+ 251%), oils (+ 144%) and vegetables (+ 93%). Animal products decreased progressively until total eviction, except for beef (- 98%). Dietary quality (estimated using the Diet Quality Index Based on the Probability of Adequate Nutrient Intake) was improved (up to 17%) as well as GHGe (up to - 65%), energy demand (up to - 48%), and land occupation (- 56%) for production. Exposures to pesticides from plant-based foods were increased by 100% conventional production and to a much lesser extent by 100% organic production. This study shows that shifting to nutritionally-adequate plant-based diets requires an in-depth rearrangement of food groups' consumption but allows a drastic reduction environmental impact. Increase exposure to pesticide residues and related risks can be mitigated by consuming foods produced with low pesticide input.


Conflict of interest statement

The authors declare no competing interests.

Figures

Figure 1
Figure 1
Composition (g/d) of the observed and optimized scenarios modelling modelled diets with gradual increase in the proportion of energy intake from plant-based foods1,2. Abbreviations: Obs, observed diet. 1Food group consumption (g/d) in the observed diets and in the modelled diets being nutritionally, culturally and environmentally optimized so as to ensure gradual increase in the proportion of energy intake from plant-based foods. The basal scenario (65%) correspond to the modelled diet when the proportion of energy intake from plant-based foods is set at the observed value of proportion of energy intake from plant-based foods under nutritional, fish consumption limitation and coproducts constraints. Next scenarios increase plant-based foods energy from 65 up to 95%. 2Vegetables include all vegetables and soups, fruit include fresh fruit, fruit in syrup and compote, dried fruit and seeds, fish include seafood, dairy product include yogurts, fresh cheese and cheese, potatoes include other tubers, cereals include breakfast cereal low in sugar, bread semolina, rice and pasta, sweet and fat foods include croissants, pastries, chocolate, biscuits, milky dessert, ice cream, honey and marmalade, cakes, chips, salted oilseeds, salted biscuits, beverages include fruit nectar, syrup, soda (with or without sugar), plant-based beverages (except soy-based), milk consumed with tea/coffee, fast-food include sandwich, prepared foods such as pizza, hamburger, ravioli, panini, salted pancake, etc., soy-based food include tofu, soy meat substitute and vegetable patties, soy yogurt, soy milk, and fats include fresh cream and butter.
Figure 2
Figure 2
Estimated daily exposure to pesticide residues (μg/kg bw/day), in observed and modelled diets with gradual increase in proportion of energy intake from plant-based foods, according to 100%-conventional and 100%-organic modelling1,2,3. Abbreviations: ADI: acceptable daily intake; Obs, observed diet. 1 The basal scenario (65%) correspond to the modelled diet when the proportion of energy intake from plant-based foods is set at the observed value of proportion of energy intake from plant-based foods under nutritional, fish consumption limitation and coproducts constraints. Next scenarios increase plant-based foods energy from 65% up to 95%. 2 The overall estimation is calculated as the sum of individual exposure weighted by 1/DJA (without anthraquinone which has no ADI). 3 Natural pyrethrins and Spinosad are authorized in certified organic production.
Figure 3
Figure 3
Variations in the composition (g/d) of the observed diet and 95% energy from plant food modelled diets according to observed level of plant food consumption1,2. Abbreviations: Obs, observed diet. SFF, sweet and fat foods. “Obs Low” corresponds to observed consumption in the group with at least 50% of energy from plant food at baseline. “Obs Mid” corresponds to observed consumption in the group with at least 65% of energy from plant food at baseline. “Obs High” corresponds to observed consumption in the group with at least 80% of energy from plant food at baseline. “95% Low” corresponds to the final scenario in the group with at least 50% of energy from plant food at baseline. “95% Mid” corresponds to the final scenario in the group with at least 65% of energy from plant food at baseline. “95% High” corresponds to the final scenario in the group with at least 80% of energy from plant food at baseline. 1Food group consumption (g/d) in the observed diets and in the 95%PE model according initial %PE. 2Vegetables include all vegetables and soups, fruit include fresh fruit, fruit in syrup and compote, dried fruit and seeds, fish include seafood, dairy product include yogurts, fresh cheese and cheese, potatoes include other tubers, cereals include breakfast cereal low in sugar, bread semolina, rice and pasta, sweet and fat foods include croissants, pastries, chocolate, biscuits, milky dessert, ice cream, honey and marmalade, cakes, chips, salted oilseeds, salted biscuits, beverages include fruit nectar, syrup, soda (with or without sugar), plant-based beverages (except soy-based), milk consumed with tea/coffee, fast-food include sandwich, prepared foods such as pizza, hamburger, ravioli, panini, salted pancake, etc., soy-based foods include tofu, soy meat substitute and soy yogurt, soy milk, and fats include fresh cream and butter.

References

    1. Burlingame, B. Sustainable diets and biodiversity - Directions and solutions for policy research and action. in Proceedings of the International Scientific Symposium Biodiversity and Sustainable Diets United Against Hunger. (FAO, 2012).
    1. Willett W, et al. Food in the Anthropocene: The EAT-Lancet Commission on healthy diets from sustainable food systems. Lancet. 2019;393:447–492. doi: 10.1016/S0140-6736(18)31788-4. - DOI - PubMed
    1. Jayedi A, Soltani S, Abdolshahi A, Shab-Bidar S. Healthy and unhealthy dietary patterns and the risk of chronic disease: An umbrella review of meta-analyses of prospective cohort studies. Br. J. Nutr. 2020;124:1133–1144. doi: 10.1017/S0007114520002330. - DOI - PubMed
    1. The Future of Food and Agriculture: Trends and Challenges. (Food and Agriculture Organization of the United Nations, 2017).
    1. Horrigan L, Lawrence RS, Walker P. How sustainable agriculture can address the environmental and human health harms of industrial agriculture. Environ. Health Perspect. 2002;110:445–456. doi: 10.1289/ehp.02110445. - DOI - PMC - PubMed

Publication types