

Landscape genomics reveals adaptive genetic differentiation driven by multiple environmental variables in naked barley on the Qinghai-Tibetan Plateau
- PMID: 37935814
- PMCID: PMC10673939
- DOI: 10.1038/s41437-023-00647-0
Landscape genomics reveals adaptive genetic differentiation driven by multiple environmental variables in naked barley on the Qinghai-Tibetan Plateau
Abstract
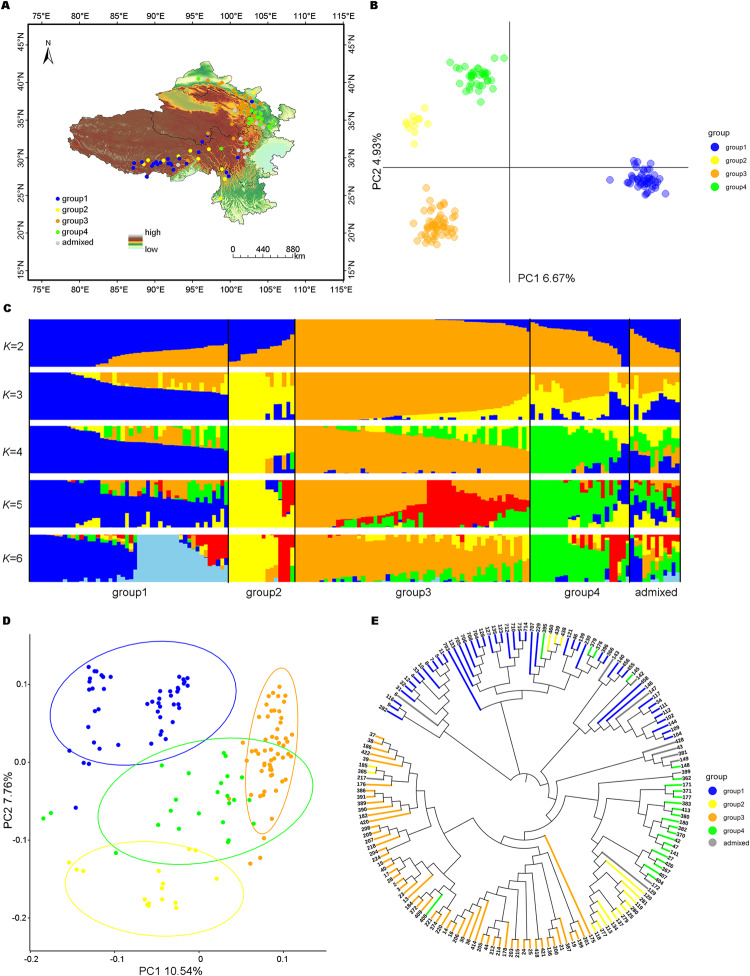
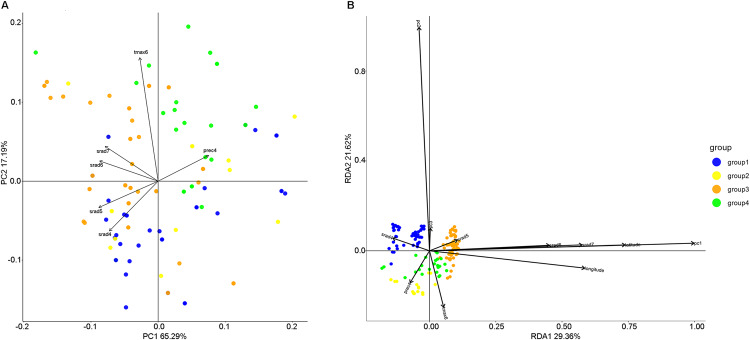
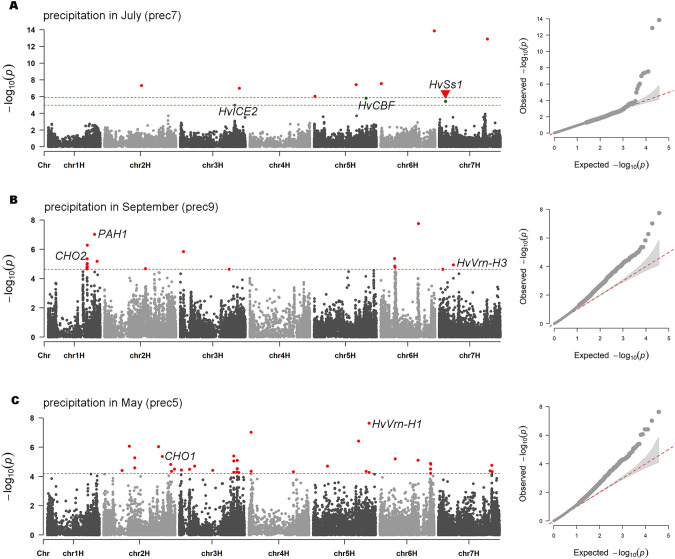
Understanding the local adaptation of crops has long been a concern of evolutionary biologists and molecular ecologists. Identifying the adaptive genetic variability in the genome is crucial not only to provide insights into the genetic mechanism of local adaptation but also to explore the adaptation potential of crops. This study aimed to identify the climatic drivers of naked barley landraces and putative adaptive loci driving local adaptation on the Qinghai-Tibetan Plateau (QTP). To this end, a total of 157 diverse naked barley accessions were genotyped using the genotyping-by-sequencing approach, which yielded 3123 high-quality SNPs for population structure analysis and partial redundancy analysis, and 37,636 SNPs for outlier analysis. The population structure analysis indicated that naked barley landraces could be divided into four groups. We found that the genomic diversity of naked barley landraces could be partly traced back to the geographical and environmental diversity of the landscape. In total, 136 signatures associated with temperature, precipitation, and ultraviolet radiation were identified, of which 13 had pleiotropic effects. We mapped 447 genes, including a known gene HvSs1. Some genes involved in cold stress and regulation of flowering time were detected near eight signatures. Taken together, these results highlight the existence of putative adaptive loci in naked barley on QTP and thus improve our current understanding of the genetic basis of local adaptation.
© 2023. The Author(s).
Conflict of interest statement
The authors declare no competing interests.
Figures

Similar articles
-
Characterization of Genetic Diversity and Genome-Wide Association Mapping of Three Agronomic Traits in Qingke Barley (Hordeum Vulgare L.) in the Qinghai-Tibet Plateau.Front Genet. 2020 Jul 3;11:638. doi: 10.3389/fgene.2020.00638. eCollection 2020. Front Genet. 2020. PMID: 32719715 Free PMC article.
-
Landscape genomics reveal signatures of local adaptation in barley (Hordeum vulgare L.).Front Plant Sci. 2015 Oct 2;6:813. doi: 10.3389/fpls.2015.00813. eCollection 2015. Front Plant Sci. 2015. PMID: 26483825 Free PMC article.
-
The draft genome of Tibetan hulless barley reveals adaptive patterns to the high stressful Tibetan Plateau.Proc Natl Acad Sci U S A. 2015 Jan 27;112(4):1095-100. doi: 10.1073/pnas.1423628112. Epub 2015 Jan 12. Proc Natl Acad Sci U S A. 2015. PMID: 25583503 Free PMC article.
-
History and future perspectives of barley genomics.DNA Res. 2020 Aug 1;27(4):dsaa023. doi: 10.1093/dnares/dsaa023. DNA Res. 2020. PMID: 32979265 Free PMC article. Review.
-
Ecological genomics of natural plant populations: the Israeli perspective.Methods Mol Biol. 2009;513:321-44. doi: 10.1007/978-1-59745-427-8_17. Methods Mol Biol. 2009. PMID: 19347652 Review.
Cited by
-
Development of Loop-Mediated Isothermal Amplification for the Detection of Prototheca bovis Directly from Milk Samples of Dairy Cattle.Mycopathologia. 2024 Jan 13;189(1):1. doi: 10.1007/s11046-023-00806-1. Mycopathologia. 2024. PMID: 38217777
-
Agricultural landscape genomics to increase crop resilience.Plant Commun. 2025 Feb 10;6(2):101260. doi: 10.1016/j.xplc.2025.101260. Epub 2025 Jan 22. Plant Commun. 2025. PMID: 39849843 Free PMC article. Review.
References
-
- Allendorf FW, Hohenlohe PA, Luikart G. Genomics and the future of conservation genetics. Nat Rev Genet. 2010;11:697–709. - PubMed
-
- Badr A, Müller K, Schäfer-Pregl R, El Rabey H, Effgen S, Ibrahim HH, et al. On the origin and domestication history of barley (Hordeum vulgare) Mol Biol Evol. 2000;17:499–510. - PubMed
-
- Barley AJ, Monnahan PJ, Thomson RC, Grismer LL, Brown RM. Sun skink landscape genomics: assessing the roles of micro-evolutionary processes in shaping genetic and phenotypic diversity across a heterogeneous and fragmented landscape. Mol Ecol. 2015;24:1696–1712. - PubMed
Publication types
MeSH terms
Grants and funding
LinkOut - more resources
Full Text Sources
