. 2023 Nov 7;6(1):1129.
doi: 10.1038/s42003-023-05519-1.

Nascent ribosomal RNA act as surfactant that suppresses growth of fibrillar centers in nucleolus

Affiliations

Nascent ribosomal RNA act as surfactant that suppresses growth of fibrillar centers in nucleolus

Tetsuya Yamamoto et al. Commun Biol. .

Abstract

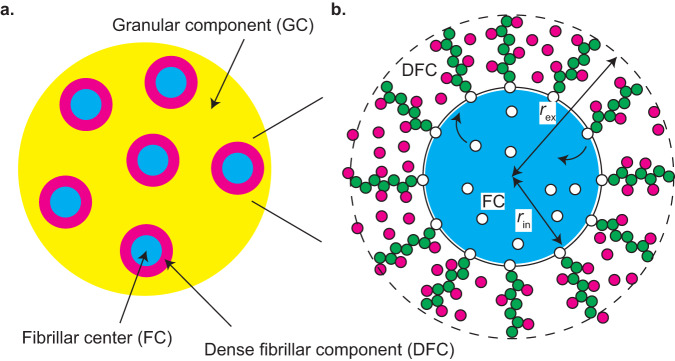
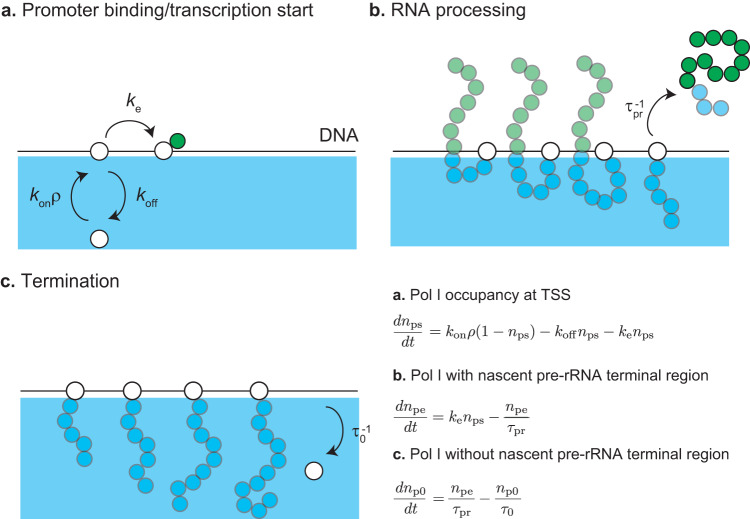
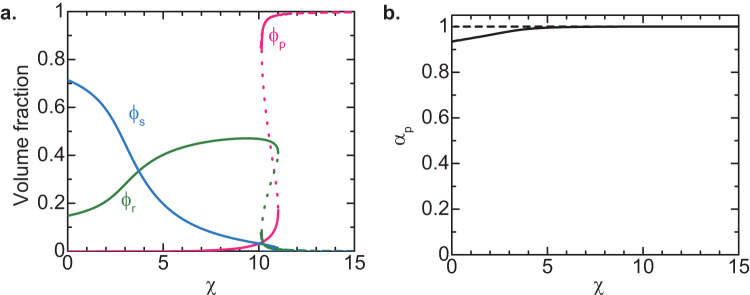
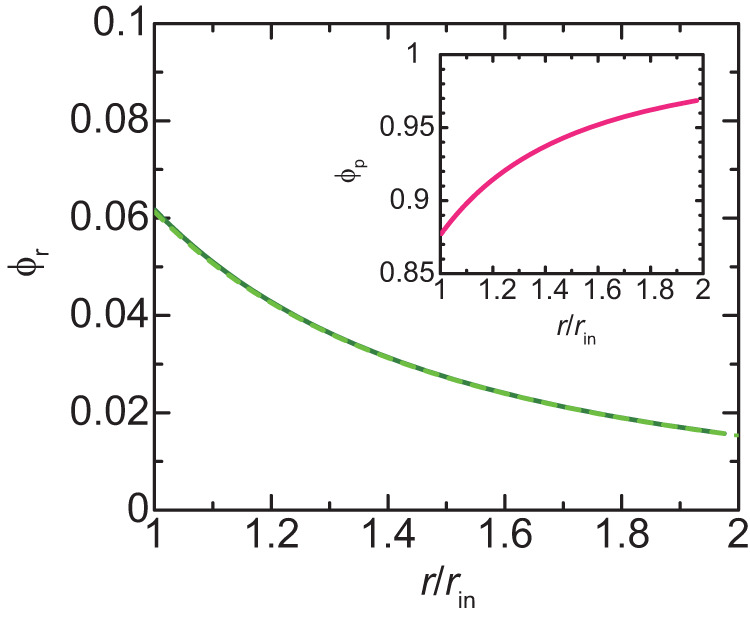
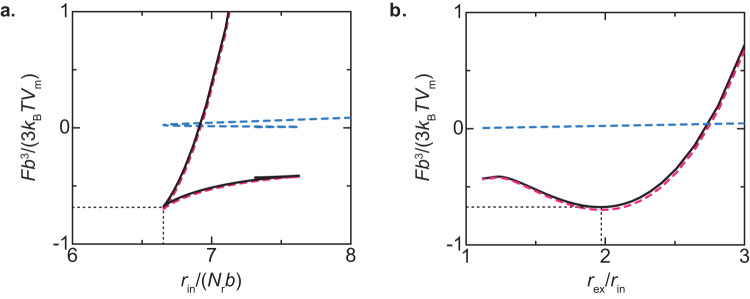
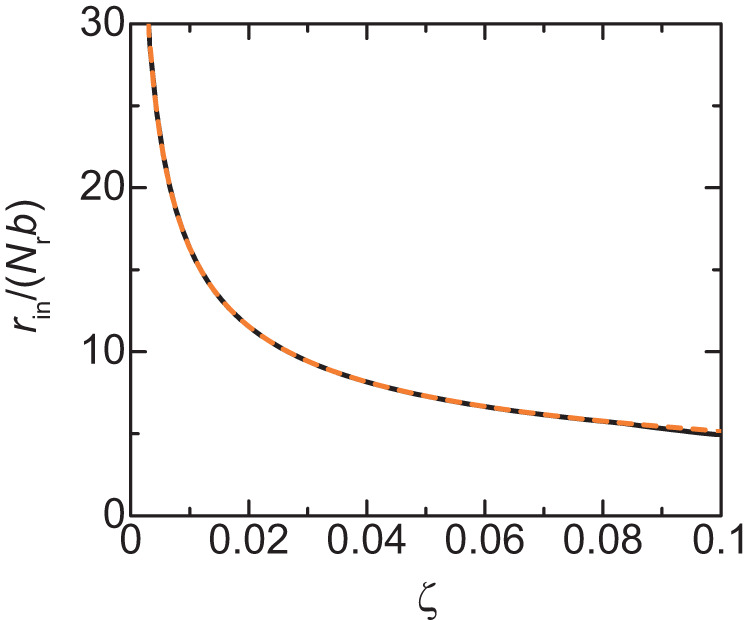
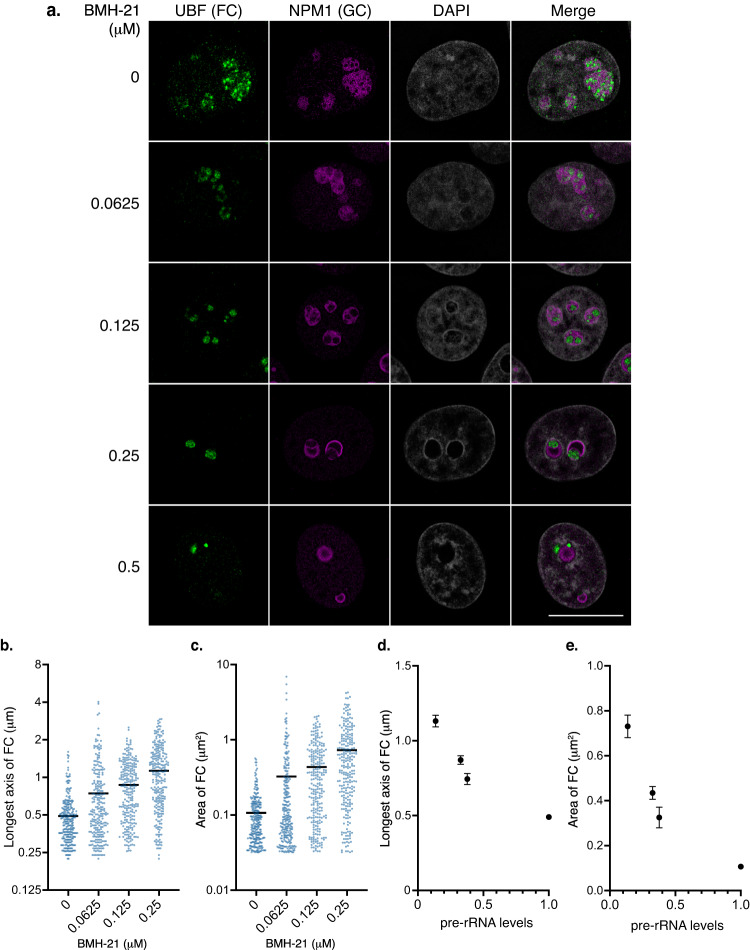
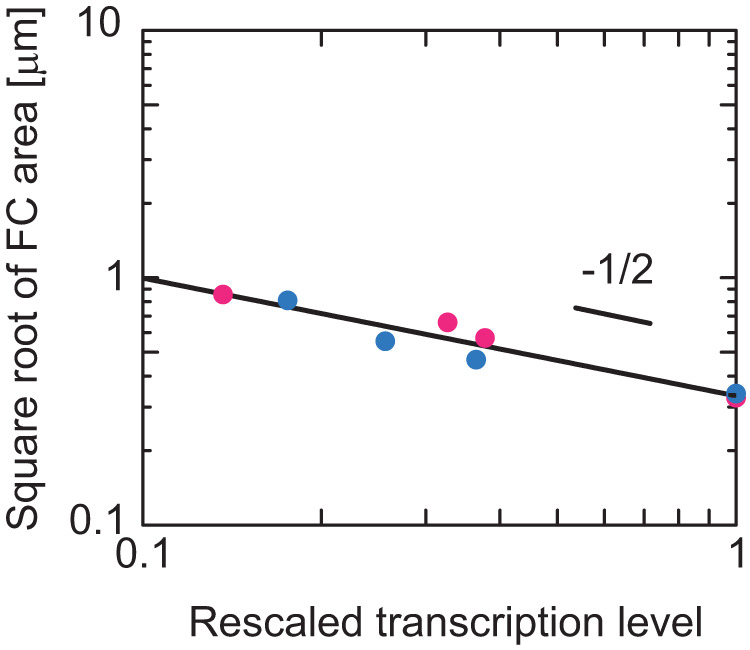
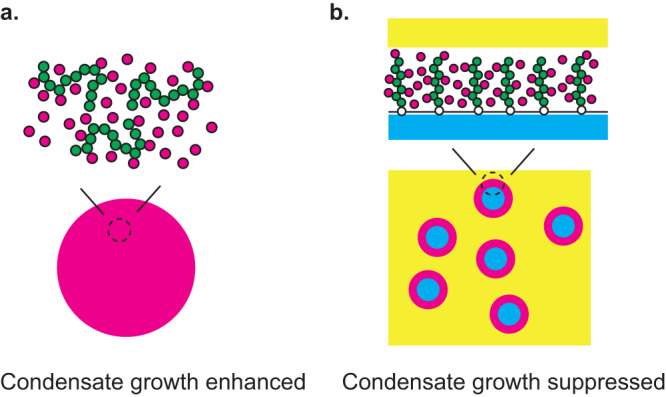
Liquid-liquid phase separation (LLPS) has been thought to be the biophysical principle governing the assembly of the multiphase structures of nucleoli, the site of ribosomal biogenesis. Condensates assembled through LLPS increase their sizes to minimize the surface energy as far as their components are available. However, multiple microphases, fibrillar centers (FCs), dispersed in a nucleolus are stable and their sizes do not grow unless the transcription of pre-ribosomal RNA (pre-rRNA) is inhibited. To understand the mechanism of the suppression of the FC growth, we here construct a minimal theoretical model by taking into account nascent pre-rRNAs tethered to FC surfaces by RNA polymerase I. The prediction of this theory was supported by our experiments that quantitatively measure the dependence of the size of FCs on the transcription level. This work sheds light on the role of nascent RNAs in controlling the size of nuclear bodies.


Conflict of interest statement

The authors declare no competing interests.

Figures

Fig. 1
Fig. 1. Multiphase structure of a nucleolus.
a A nucleolus is composed of multiple fibrillar centers (FC) microphases in the sea of the granular component (GC). There is a layer of dense fibrillar component (DFC) between each FC and GC. b RNA polymerase I (Pol I) molecules (white particles) are entrapped in FC microphases (light blue) and the active rDNA units (black line) are localized at the surfaces of microphases. Nascent pre-rRNAs (green particles) are thus at the surfaces of the microphase and form a DFC layer with RNA-binding proteins (magenta particles). The interface between FC and DFC is located at a distance rin from the center and the interface between DFC and GC is located at a distance rex.
Fig. 2
Fig. 2. Model of transcription dynamics.
DNA (black solid line) is localized at the surface of an FC (cyan). a RNA polymerase I (Pol I) in a microphase binds to the transcription starting site (TSS) of an active rDNA repeat unit. The bound Pol I starts transcription with the rate ke or returns to the microphase without starting transcription. b During the transcription, Pol I migrates uni-directionally towards the transcription terminating site (TTS) while polymerizing a nascent pre-rRNA. The terminal region of the nascent pre-ribosomal RNA (pre-rRNA), to which FBL binds, are cleaved by the co-transcriptional RNA processing with the rate τpr1. The terminal region is released to GC. c After the cleavage of the terminal region, Pol I continues transcription until it reaches the TTS. At the TTS, Pol I is releaed to the FC with the rate τ01.
Fig. 3
Fig. 3. Composition of planer DFC layer vs. interaction parameter χ.
a The volume fraction ϕr of pre-rRNA units (green), the volume fraction ϕp of freely diffusing RBPs (magenta), the volume fraction ϕs of solvent molecules (cyan) in a DFC layer are shown as functions of the interaction parameter χ. b The occupancy αp of pre-rRNA terminal region by RBPs is shown as a function of the interaction parameter χ. We used μp/(kBT)=10.0, ϵ=12.0, σinb2=0.05, and Πexb3/(kBT)=0.0 for the calculations, see also Table 1. The solid lines are derived by numerically solving Supplementary Equations (S15), (S16), and (S20). The broken lines are derived by using Supplementary Equation (S47) (shown for χ>10.1).
Fig. 4
Fig. 4. Profile of volume fraction ϕr of pre-rRNA units in DFC layer.
The volume fraction of nascent pre-rRNA units is shown as a function of the position r in the DFC layer (rin<r<rex). The solid dark green line is derived by numerically calculating Supplementary Equations (S13), (S15), and (S16) for ζ=0.06 with the condition that the volume fraction of solvent is zero and the occupancy of the terminal regions of pre-rRNAs by RBPs is unity. The values of other parameters are summarized in Table 1. The broken light green line is derived by using Supplementary Equation (S59) with ϕex=0.0157 and rex=1.98 (which were derived from the numerical calculation to obtain the light green line). The volume fraction of freely diffusing RBPs is shown in the inset.
Fig. 5
Fig. 5. Free energy F of nucleolus.
The free energy F of the system is shown as a function of the radius rin of FCs (a) and the ratio rex/rin of the external radius to the internal radius (b). The black solid line is the total free energy, including the free energy of DFC layers (shown by the magenta broken line, the first term of Eq. (2)) and the surface free energy (shown by the cyan broken line, the second and third terms of Eq. (2)) for ζ=0.06. The values of other parameters are summarized in Table 1.
Fig. 6
Fig. 6. Radius rin of FCs vs. rescaled transcription rate ζ.
The radius rin of FCs at the free-energy minimum is shown as a function of rescaled transcription rate ζ. The solid dark green line is derived by numerically calculating Supplementary equations (S13), (S15), and (S16) with the condition that the volume fraction of solvent is zero and the occupancy of the terminal regions of pre-rRNAs by RBPs is unity. The orange broken line is derived by using Eq. 5. The parameters used for the calculations are summarized in Table 1.
Fig. 7
Fig. 7. Mild Pol I inhibition by BMH-21 increases the size of FCs.
a Immunofluorescence of UBF (FC) and NPM1 (GC) in HeLa cells with or without BMH-21 treatments. Scale bar, 10 μm. b, c Quantification of the longest axis (b) and area (c) of the FCs in cells under indicated conditions. Each scatter dot plot shows the mean (black line). Dots indicate all points of quantified data (n = 250). Mean longest axes of the FCs is shown below: 0 μM: 0.4907 μm, 0.0625 μM: 0.7440 μm, 0.125 μM: 0.8710 μm, 0.25 μM: 1.131 μm. Mean areas of the FCs are shown below: 0 μM: 0.170 μm2, 0.0625 μM: 0.3255 μm2, 0.125 μM: 0.4347 μm2, 0.25 μM: 0.7312 μm2. Statistical analyses using the Kruskal–Wallis test with Dunn’s multiple comparison test were performed and the results are shown as follows. b 0 μM vs. 0.0625 μM: P < 0.0001, 0 μM vs. 0.125 μM: P < 0.0001, 0 μM vs. 0.25 μM: P < 0.0001, 0.0625 μM vs. 0.125 μM: P < 0.0001, 0.0625 μM vs. 0.25 μM: P < 0.0001, 0.125 μM vs. 0.25 μM: P = 0.0008. c 0 μM vs. 0.0625 μM: P = 0.0003, 0 μM vs. 0.125 μM: P < 0.0001, 0 μM vs. 0.25 μM: P < 0.0001, 0.0625 μM vs. 0.125 μM: P < 0.0001, 0.0625 μM vs. 0.25 μM: P < 0.0001, 0.125 μM vs, 0.25 μM: P = 0.0010. d and e Graphs showing the mean longest axis (d) and area (e) of the FCs with SEM vs. pre-rRNA expression levels. The pre-rRNA expression level in untreated cells is defined as 1.
Fig. 8
Fig. 8. Exponent that accounts for the dependence of the size of FCs on pre-rRNA expression level.
The data in Fig. 7e was shown in the double-logarithm plot and fitted with a power function. The magenta and cyan dots are the results of suppressing the Pol I transcription by using BMH-21 and CX-5461. The slope of the double-logarithm plot is the exponent that accounts for the dependence of the radius of FCs on the transcription level. The curve fitting shows that the exponent is –0.49 for the case of the BMH-21 treatment, –0.46 for the case of the CX-5461, and –0.48 if both data are fitted.
Fig. 9
Fig. 9. Summary of results.
RNP complexes enhance or suppress the growth of condensates depending on whether the RNP complexes are mobile in the interior or tethered to the surfaces of the condensates. a The multivalent interaction between the RNP complexes enhances the growth of the condensates if these condensates are assembled by the RNP complexes. b The multivalent interaction between the RNP complexes suppresses the growth of the condensates if these complexes are tethered to the surfaces of the condensates assembled by other RNAs and proteins.

References

    1. Klinge S, Woolford J., Jr Ribosome assembly coming into focus. Nat. Rev. Mol. Cell Biol. 2019;20:116–131. doi: 10.1038/s41580-018-0078-y. - DOI - PMC - PubMed
    1. McStay B, Grummt I. The epigenetics of rRNA genes: from molecular to chromosome biology. Annu. Rev. Cell Dev. Biol. 2008;24:131–157. doi: 10.1146/annurev.cellbio.24.110707.175259. - DOI - PubMed
    1. Lafontaine D, Riback J, Bascetin R, Brangwynne C. The nucleolus as a multiphase liquid condensate. Nat. Rev. Mol. Cell Biol. 2021;22:165–182. doi: 10.1038/s41580-020-0272-6. - DOI - PubMed
    1. Berry J, Weber S, Vaidya N, Haataja M, Brangwynne C. RNA transcription modulates phase transition driven nuclear body assembly. Proc. Natl Acad. Sci. USA. 2015;112:E5237–E5245. doi: 10.1073/pnas.1509317112. - DOI - PMC - PubMed
    1. Cioce M, Lamond AI. Cajal bodies: a long history of discovery. Annu. Rev. Cell Dev. Biol. 2005;21:105–131. doi: 10.1146/annurev.cellbio.20.010403.103738. - DOI - PubMed

Publication types