

The estimated annual financial impact of gene therapy in the United States
- PMID: 37935855
- PMCID: PMC10678302
- DOI: 10.1038/s41434-023-00419-9
The estimated annual financial impact of gene therapy in the United States
Abstract
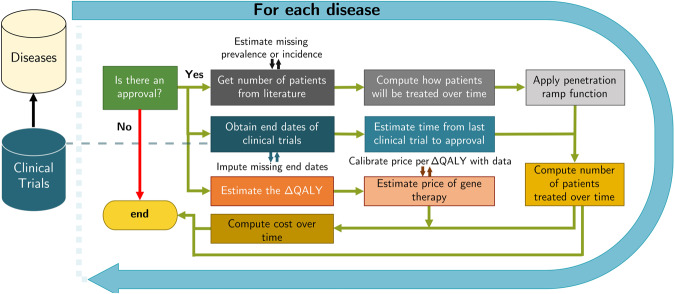
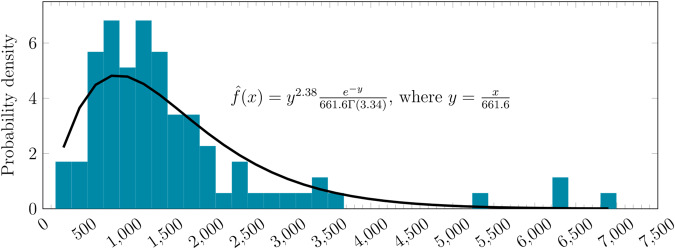
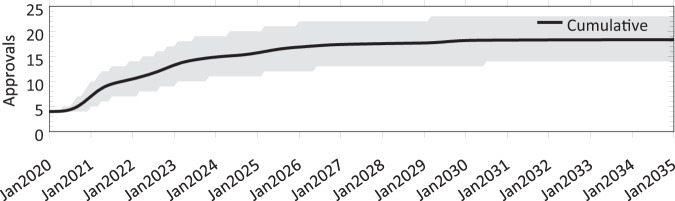
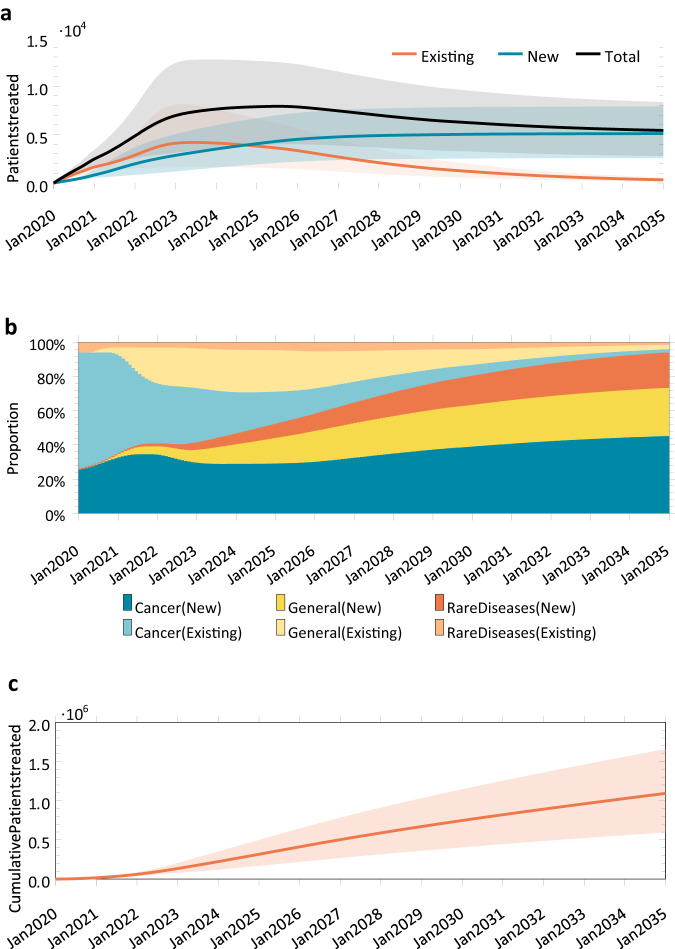
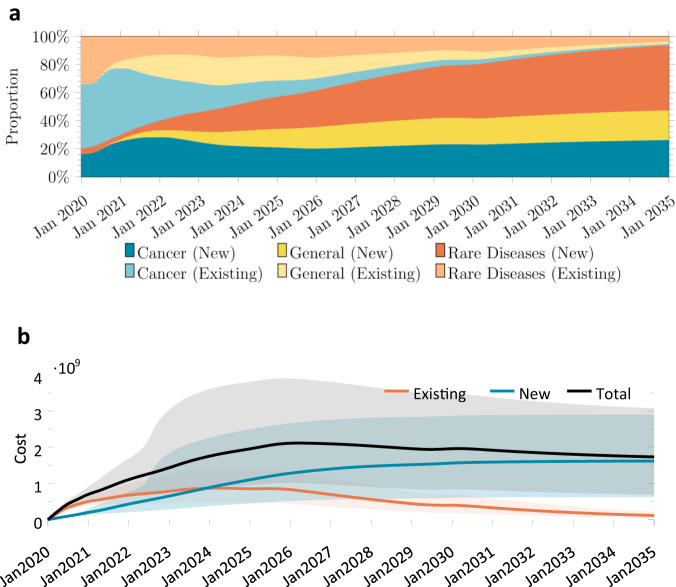
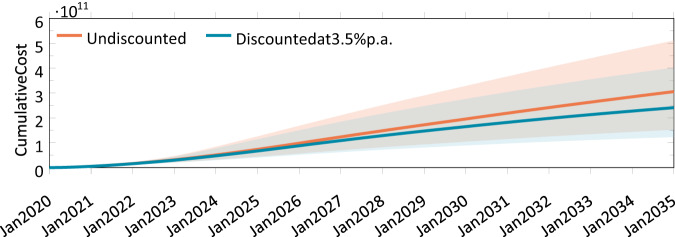
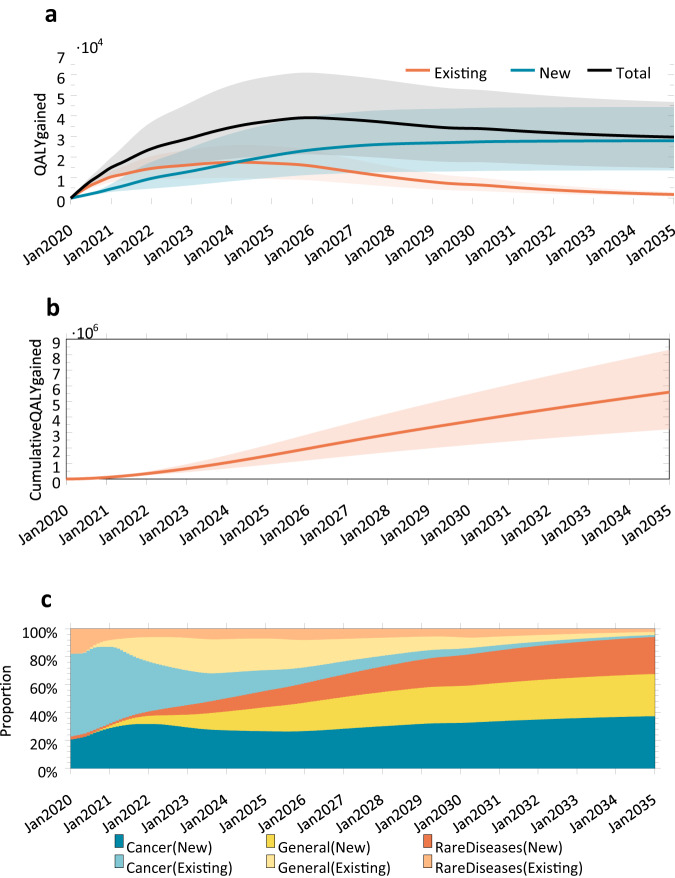
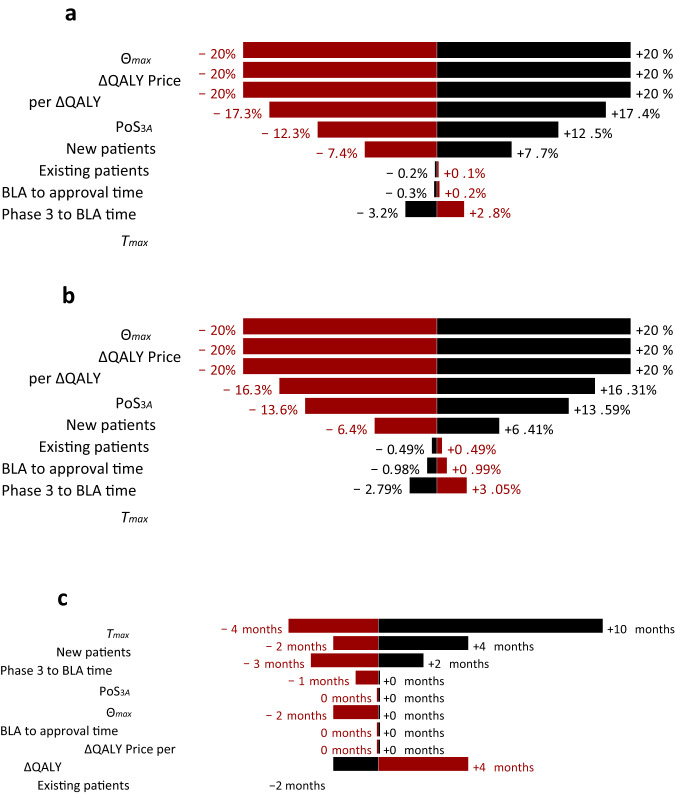
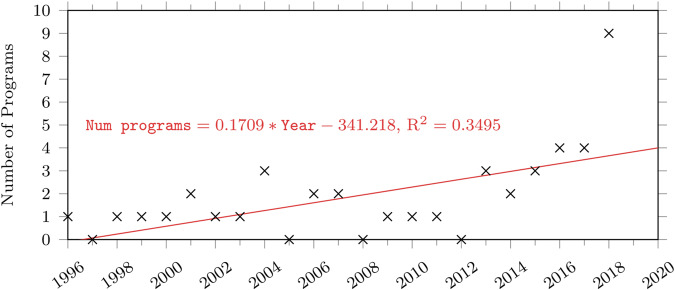
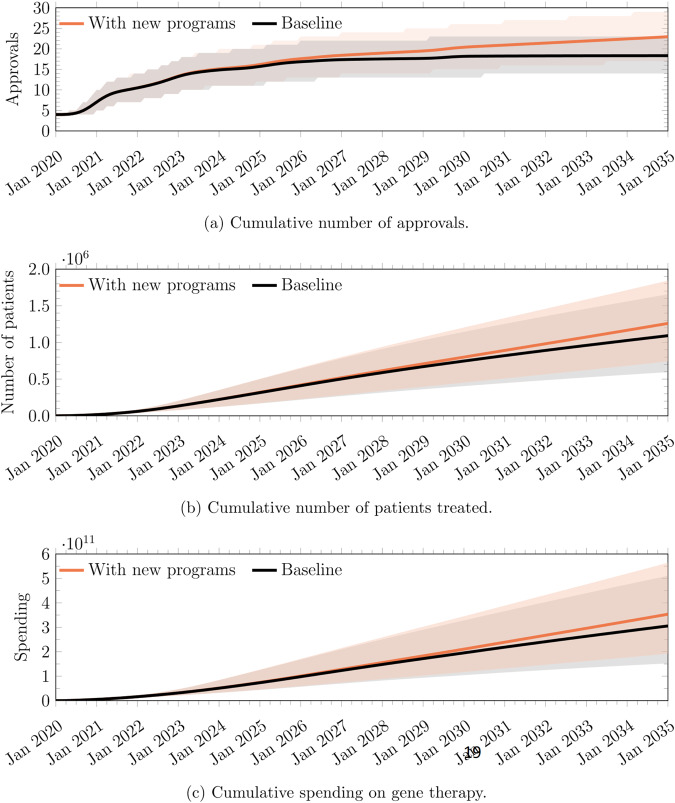
Gene therapy is a new class of medical treatment that alters part of a patient's genome through the replacement, deletion, or insertion of genetic material. While still in its infancy, gene therapy has demonstrated immense potential to treat and even cure previously intractable diseases. Nevertheless, existing gene therapy prices are high, raising concerns about its affordability for U.S. payers and its availability to patients. We assess the potential financial impact of novel gene therapies by developing and implementing an original simulation model which entails the following steps: identifying the 109 late-stage gene therapy clinical trials underway before January 2020, estimating the prevalence and incidence of their corresponding diseases, applying a model of the increase in quality-adjusted life years for each therapy, and simulating the launch prices and expected spending of all available gene therapies annually. The results of our simulation suggest that annual spending on gene therapies will be approximately $20.4 billion, under conservative assumptions. We decompose the estimated spending by treated age group as a proxy for insurance type, finding that approximately one-half of annual spending will on the use of gene therapies to treat non-Medicare-insured adults and children. We conduct multiple sensitivity analyses regarding our assumptions and model parameters. We conclude by considering the tradeoffs of different payment methods and policies that intend to ensure patient access to the expected benefits of gene therapy.
© 2023. The Author(s).
Conflict of interest statement
CW, DL, and NW report no conflicts. RMC has no conflicts of interest to declare. JG reports no conflicts. JG is a consultant for both the insurer Aetna, Inc. and for the biotech company Sarepta, Inc. During the most recent 6-month period JG has received compensation from Aetna, MacMillan Publishing, and Access Health, International. AL reports personal investments in private biotech companies, biotech venture capital funds, and mutual funds. AL is a co-founder and partner of QLS Advisors, a healthcare analytics and consulting company; an advisor to Apricity Health, Aracari Bio, BrightEdge Impact Fund, Enable Medicine, Inc, FINRA, Health at Scale, Lazard, MIT Proto Ventures, Quantile Health, Roivant Social Ventures, SalioGen Therapeutics, Swiss Finance Institute, Thalēs, and xCures; a director of AbCellera, Annual Reviews, Atomwise, BridgeBio Pharma, Uncommon Cures, and Vesalius. During the most recent six-year period (beginning 2017), AL received speaking/consulting fees, honoraria, or other forms of compensation from: AbCellera, AlphaSimplex Group, Annual Reviews, Apricity Health, Aracari Bio, Atomwise, Bernstein Fabozzi Jacobs Levy Award, BridgeBio, Cambridge Associates, Chicago Mercantile Exchange, Enable Medicine, Financial Times Prize, Harvard Kennedy School, IMF, Journal of Investment Management, Lazard, National Bank of Belgium, New Frontier Advisors/Markowitz Award, Oppenheimer, Princeton University Press, Q Group, QLS Advisors, Quantile Health, Research Affiliates, Roivant Sciences, SalioGen, Swiss Finance Institute, and WW Norton.
Figures
References
-
- Spinraza® and Onasemnogene abeparvovec-xioi ® for spinal muscular atrophy: Effectiveness and Value, Final Evidence Report [Internet]. Boston, MA: Institute for Clinical and Economic Review; 2019 Apr; [cited 2022 Dec 7]. Available from: https://icer.org/wp-content/uploads/2020/10/ICER_SMA_Final_Evidence_Repo...
-
- Voretigene Neparvovec for Biallelic RPE65-Mediated Retinal Disease: Effectiveness and Value, Final Evidence Report [Internet]. Boston, MA: Institute for Clinical and Economic Review; 2018 Feb [cited 2022 Dec 7]. Available from: https://icer.org/wp-content/uploads/2020/10/MWCEPAC_VORETIGENE_FINAL_EVI...
-
- Abrantes-Metz RM, Adams C, Metz AD. Pharmaceutical development phases: a duration analysis. J Pharm Finance Econ Policy. 2005;14:19–42. doi: 10.1300/J371v14n04_03. - DOI
Publication types
MeSH terms
Grants and funding
LinkOut - more resources
Full Text Sources
Medical
