. 2023 Dec;33(12):952-966.
doi: 10.1038/s41422-023-00887-z. Epub 2023 Nov 7.

NR5A2 connects zygotic genome activation to the first lineage segregation in totipotent embryos

Affiliations

NR5A2 connects zygotic genome activation to the first lineage segregation in totipotent embryos

Fangnong Lai et al. Cell Res. 2023 Dec.

Abstract

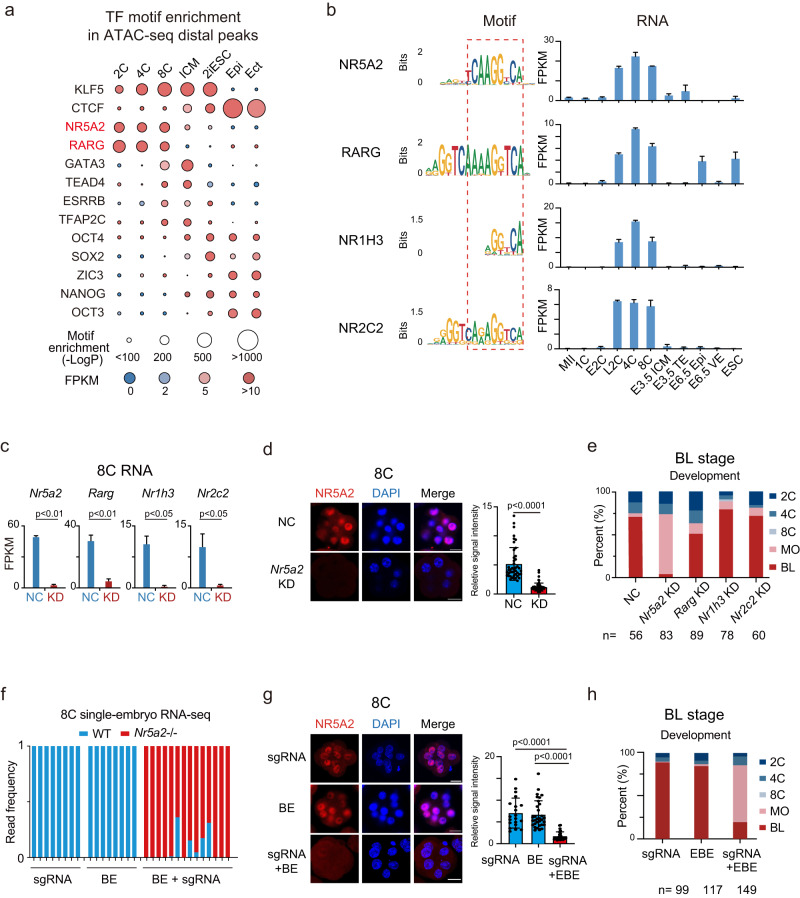
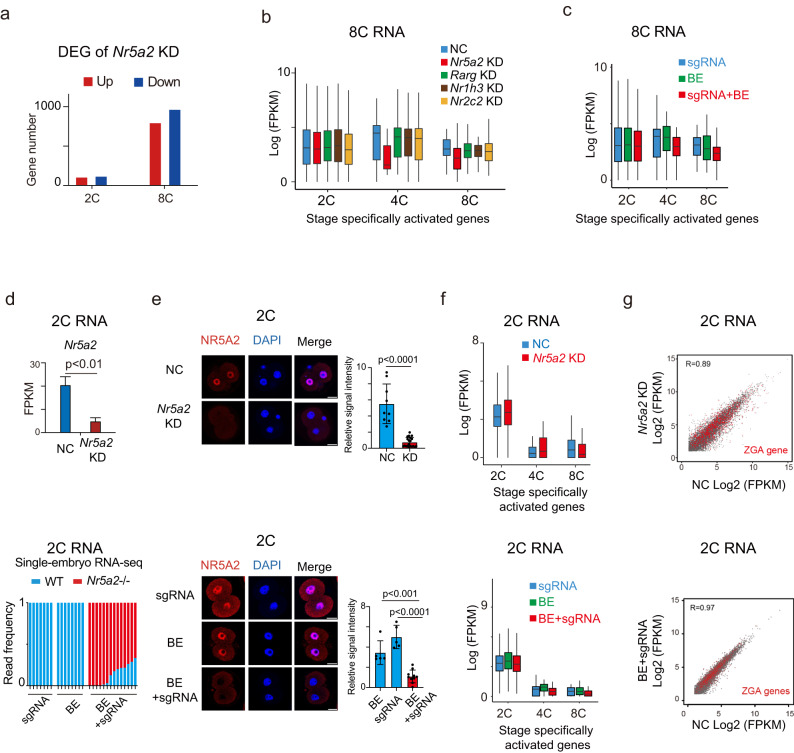
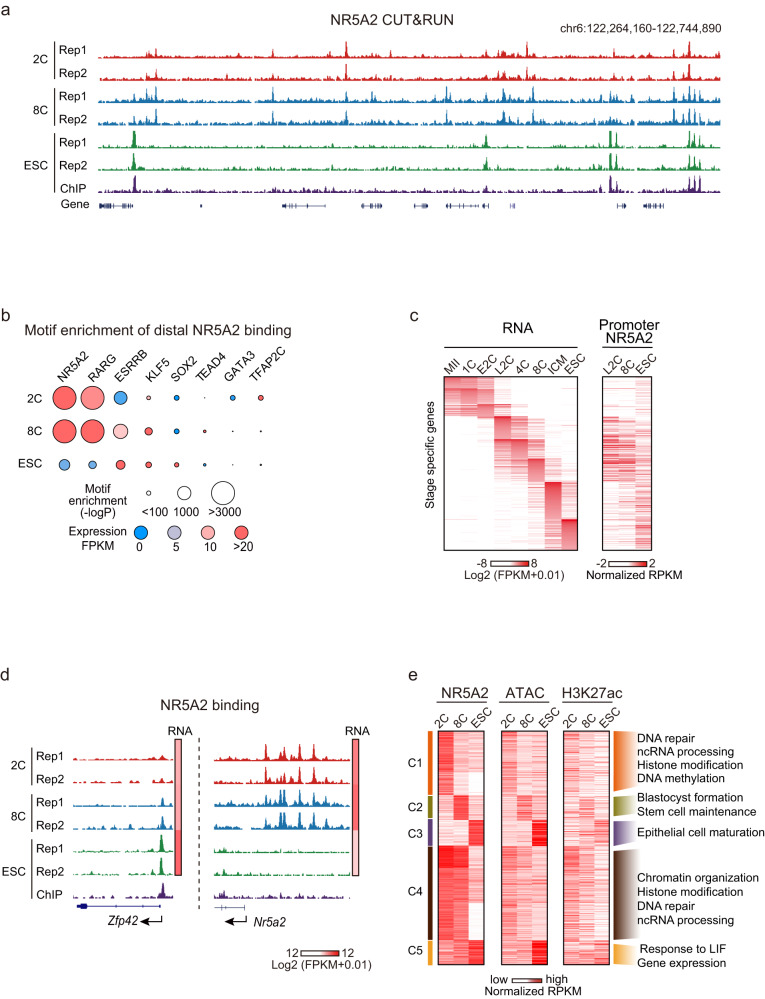
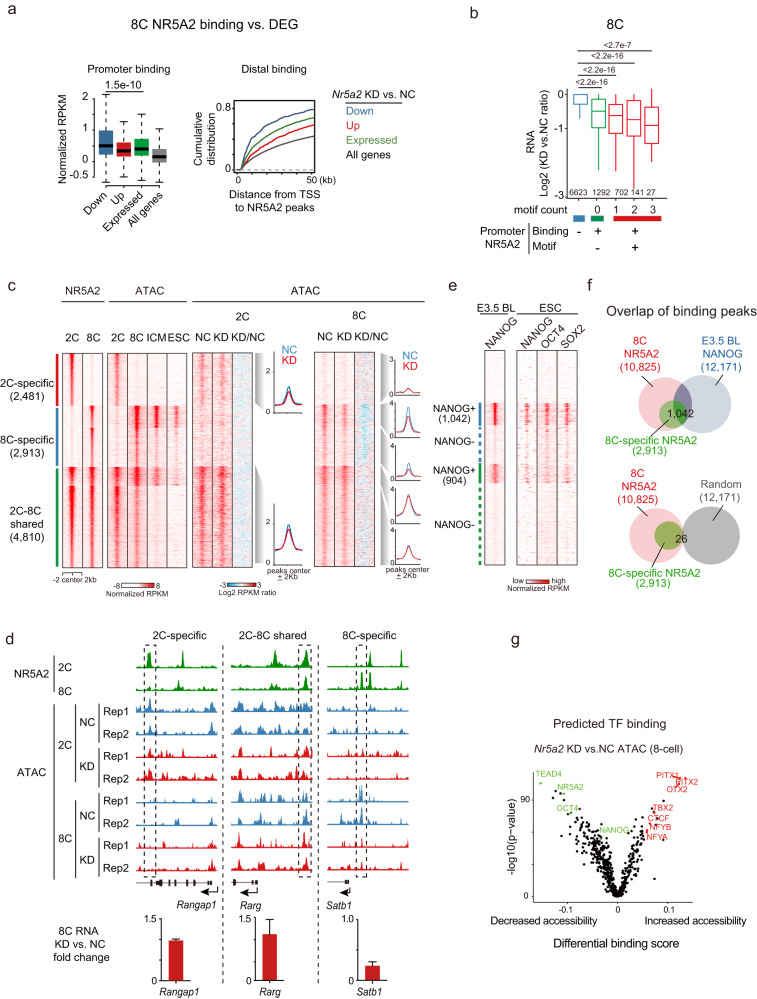
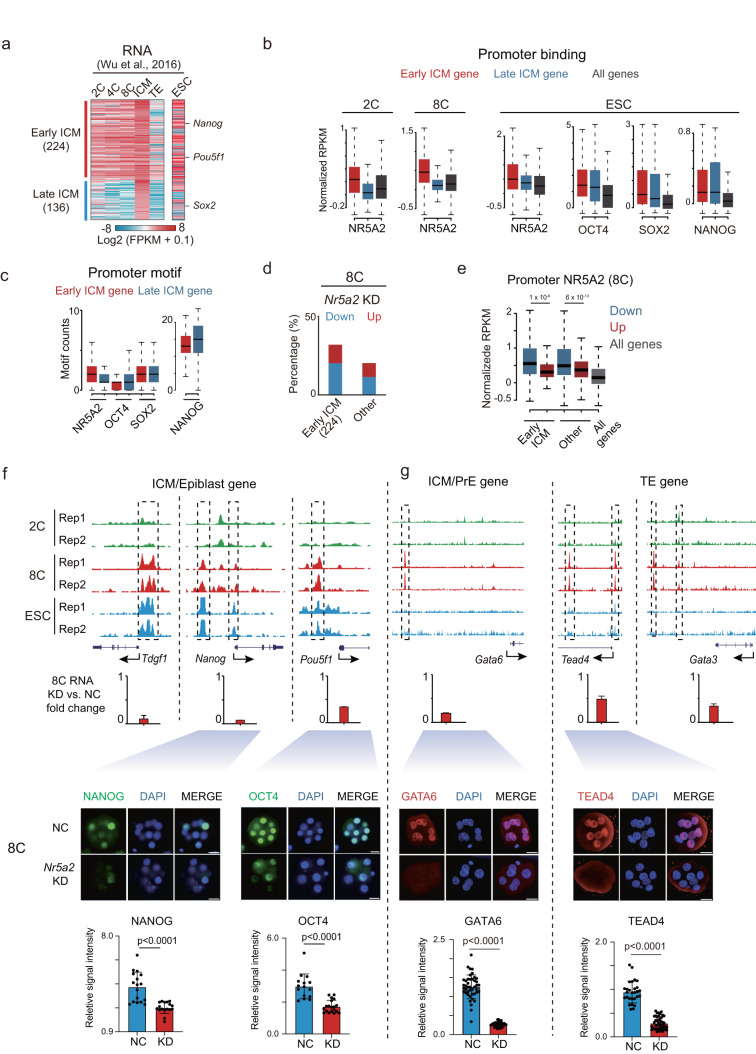
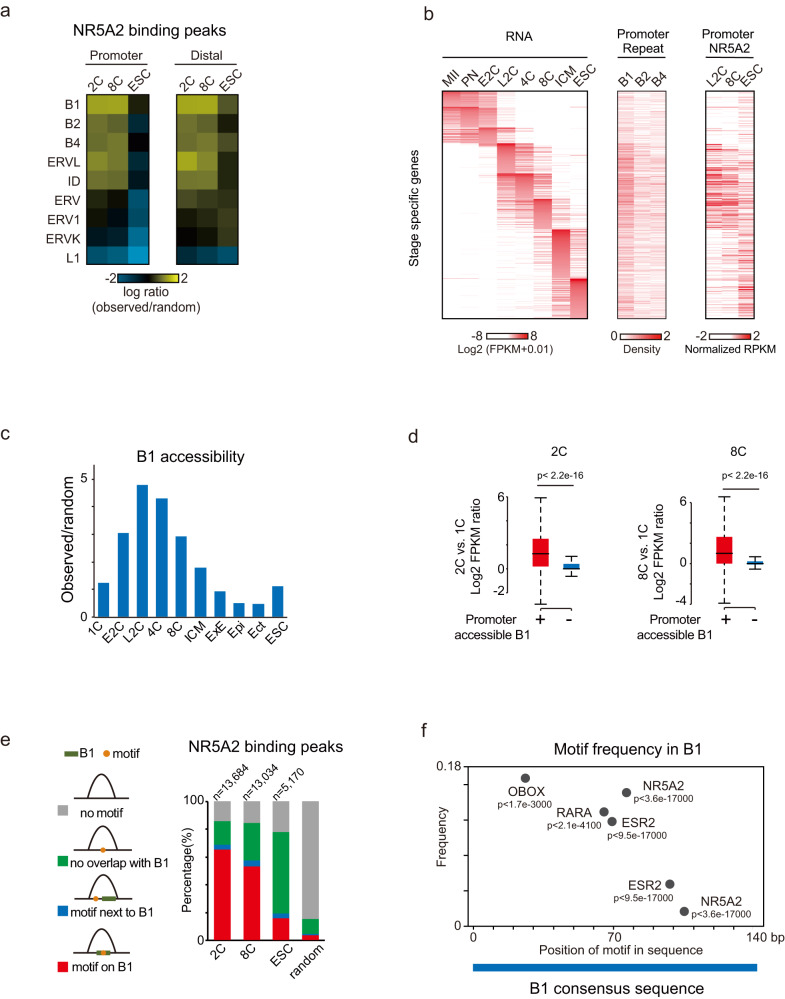
Zygotic genome activation (ZGA) marks the beginning of the embryonic program for a totipotent embryo, which gives rise to the inner cell mass (ICM) where pluripotent epiblast arises, and extraembryonic trophectoderm. However, how ZGA is connected to the first lineage segregation in mammalian embryos remains elusive. Here, we investigated the role of nuclear receptor (NR) transcription factors (TFs), whose motifs are highly enriched and accessible from the 2-cell (2C) to 8-cell (8C) stages in mouse embryos. We found that NR5A2, an NR TF strongly induced upon ZGA, was required for this connection. Upon Nr5a2 knockdown or knockout, embryos developed beyond 2C normally with the zygotic genome largely activated. However, 4-8C-specific gene activation was substantially impaired and Nr5a2-deficient embryos subsequently arrested at the morula stage. Genome-wide chromatin binding analysis showed that NR5A2-bound cis-regulatory elements in both 2C and 8C embryos are strongly enriched for B1 elements where its binding motif is embedded. NR5A2 was not required for the global opening of its binding sites in 2C embryos but was essential to the opening of its 8C-specific binding sites. These 8C-specific, but not 2C-specific, binding sites are enriched near genes involved in blastocyst and stem cell regulation, and are often bound by master pluripotency TFs in blastocysts and embryonic stem cells (ESCs). Importantly, NR5A2 regulated key pluripotency genes Nanog and Pou5f1/Oct4, and primitive endoderm regulatory genes including Gata6 among many early ICM genes, as well as key trophectoderm regulatory genes including Tead4 and Gata3 at the 8C stage. By contrast, master pluripotency TFs NANOG, SOX2, and OCT4 targeted both early and late ICM genes in mouse ESCs. Taken together, these data identify NR5A2 as a key regulator in totipotent embryos that bridges ZGA to the first lineage segregation during mouse early development.


Conflict of interest statement

The authors declare no competing interests.

Figures

Fig. 1
Fig. 1. Both KD and KO of Nr5a2 led to morula arrest.
a TF motifs identified from distal ATAC-seq peaks, in mouse early embryos. Sizes of circles indicate the –LogP value. Expression levels of TFs are color-coded. Epi, E6.5 Epiblast; Ect, E7.5 ectoderm. b Sequence logos of the binding motifs of NR5A2, RARG, NR1H3, and NR2C2 (left), and RNA expression (FPKM) of Nr5a2, Rarg, Nr1h3, and Nr2c2 (right). VE, visceral endoderm. The error bars denote the standard deviations of two biological replicates of RNA-seq. c Bar charts showing the expression of Nr5a2, Rarg, Nr1h3, and Nr2c2 in the negative control (NC) group (injected with negative control siRNA) and siRNA targeting group based on RNA-seq. The error bars denote the standard deviations of two biological replicates of RNA-seq. d Immunofluorescence of NR5A2 (red) and DAPI (blue) in mouse 8C embryos after KD of Nr5a2 (left). Scale bars: 20 μm. Quantification of NR5A2 signal intensity (relative to DAPI) and P values (t-test, two-sided) are shown (right, n = 12–13 embryos). Each dot represents a single blastomere. e Bar plots showing the developmental rates of NC group, Nr5a2 KD group, Rarg KD group, Nr1h3 KD group, and Nr2c2 KD group at the blastocyst stage (E4.5). MO, morula; BL, blastocyst. f Bar charts showing the percentage of WT Nr5a2 (blue) and base-edited Nr5a2 (red) reads from RNA-seq at the 8C stage after injection of Nr5a2 sgRNA only, base-editor (BE) mRNA only, and both sgRNA and BE mRNA. Each bar represents a single embryo. g Immunofluorescence of NR5A2 (red) and DAPI (blue) in mouse 8C embryos after injection of sgRNA only, BE mRNA only, and both sgRNA and BE mRNA (left). Scales bars: 20 μm. Quantification of NR5A2 signal intensity (relative to DAPI) and P values (t-test, two-sided) are shown (right, n = 6–8 embryos). Each dot represents a single blastomere. h Bar plots showing the developmental rates at the blastocyst stage (E4.5) after injection of sgRNA only, BE mRNA only, and both sgRNA and BE mRNA.
Fig. 2
Fig. 2. NR5A2 is largely dispensable for global ZGA but is required for 4–8C gene activation.
a Bar plot showing the numbers of upregulated (red) and downregulated (blue) genes after Nr5a2 KD in mouse 2C and 8C embryos. b Box plots showing the average expression levels of stage-specifically activated genes for NC groups (blue), Nr5a2 KD groups (red), Rarg KD groups (green), Nr1h3 KD groups (brown), and Nr2c2 KD groups (yellow) at the 8C stage. c Box plots showing the average expression levels of stage-specifically activated genes after injection of sgRNA only (blue), BE mRNA only (green), and both sgRNA and BE mRNA (red) at the 8C stage. d Bar charts showing the expression of Nr5a2 in NC and Nr5a2 KD group at the 2C stage (left), with P values (t-test, two-sided) indicated (top). Bar charts show the percentages of WT Nr5a2 (blue) and base edited Nr5a2 (red) reads from RNA-seq after injection of Nr5a2 sgRNA only, BE mRNA only, and both sgRNA and BE mRNA at the 2C stage (bottom). e Immunofluorescence of NR5A2 (red) and DAPI (blue) in mouse 2C embryos after Nr5a2 KD (top, left). Immunofluorescence of NR5A2 (red) and DAPI (blue) in mouse 2C embryos after injection of sgRNA only, BE mRNA only, and both sgRNA and BE mRNA (bottom, left). Scale bars: 20 μm. Quantification of NR5A2 signal intensity (relative to DAPI) in mouse 2C (n = 4–7 embryos) and 8C (n = 6–8 embryos) embryos and P values (t-test, two-sided) are shown (right). Each dot represents a single blastomere. f Box plots showing the average expression levels of stage specifically activated genes for NC groups (blue) and Nr5a2 KD groups (red) at the 2C stage (top). Box plots show the average expression levels of stage-specifically activated genes after injection of sgRNA only (blue), BE mRNA only (green), and both sgRNA and BE mRNA (red) at the 2C stage (bottom). g Scatter plot comparing gene expression of NC group and Nr5a2 KD group in mouse 2C embryos (top). Scatter plot comparing gene expression of NC group and Nr5a2 base edited group in mouse 2C embryos (bottom). ZGA genes are colored in red. The Pearson correlation coefficients are also shown.
Fig. 3
Fig. 3. NR5A2 binding dynamics in mouse early embryos.
a The UCSC browser view showing NR5A2 CUT&RUN signals in 2C embryos, 8C embryos, and mESCs (two biological replicates). NR5A2 ChIP-seq from a reference dataset is also shown. b TF motifs identified from NR5A2 distal binding peaks in 2C embryos, 8C embryos, and mESCs. Sizes of circles indicate –LogP value. Expression levels of TFs are color-coded. c Heat maps showing stage-specific gene expression based on a reference dataset and their promoter NR5A2 binding enrichment. d The UCSC browser views and heat maps showing NR5A2 enrichment and gene expression of representative genes, respectively. e Heatmaps showing the NR5A2 binding, ATAC, and H3K27ac signals at the stage-specific and shared NR5A2 binding peaks (left). The gene ontology (GO) terms are also shown for different clusters (right).
Fig. 4
Fig. 4. NR5A2 regulates the expression of its binding targets in early development.
a Box plots showing the average enrichment of NR5A2 binding signals at the promoters (TSS (transcription starting site) ± 2.5 kb) (in WT embryos) of downregulated, upregulated, expressed, and all genes identified in Nr5a2 KD 8C embryos (left), with P values (t-test, two-sided) indicated. The cumulative distributions of downregulated, upregulated, expressed, and all genes with defined distances (x-axis) between their TSSs and nearest distal 8C NR5A2 binding peaks are shown (right). b Box plots showing the fold changes of gene expression in Nr5a2 KD 8C embryos for all expressed genes based on the NR5A2 binding states and the numbers of motifs at promoters, with P values (t-test, two-sided) indicated. c Heatmap showing the NR5A2 binding, enrichment of ATAC-seq signals in WT reference, NC, Nr5a2 KD 2C and 8C embryos. Average plots show enrichment of ATAC-seq signals in NC and Nr5a2 KD 8C embryos at the 2C-specific, 8C-specific, and 2–8C shared NR5A2 distal binding peaks. d The UCSC browser views showing NR5A2 binding, ATAC-seq signals of representative genes in 2C and 8C NC, and Nr5a2 KD embryos (top). Bar plots shows the expression fold-changes of representative genes between Nr5a2 KD and control 8C embryos of two biological replicates of RNA-seq (bottom). e Heatmap showing NANOG binding in E3.5 blastocyst and NSO binding in mESC at 2C-specific, 8C-specific, and 2–8C shared NR5A2 distal binding peaks. f Venn diagrams showing the overlap among 8C NR5A2 binding peaks, 8C-specific NR5A2 binding peaks, and E3.5 blastocyst NANOG peaks (top). Random peaks shuffled from the genome with matched lengths are also shown (bottom). g Volcano plot showing the TF footprints in differentially accessible regions in ATAC-seq upon Nr5a2 KD at the 8C stage. Example footprints in regions with increasing and decreasing accessibilities are colored in red and green, respectively. P values for their enrichment are also shown on the y-axis.
Fig. 5
Fig. 5. NR5A2 regulates the early ICM, TE and PrE genes at the 8C stage.
a Heatmap showing the gene expression levels in 2C, 4C, and 8C embryos, E3.5 ICM, TE, and mESC for the early/late ICM genes. Early ICM gene: FPKM ≥ 1 in 8C embryos. Late ICM gene: FPKM < 1 in 8C embryos. b Box plots showing the average enrichment of NR5A2 and NSO binding signals at the promoters (TSS ± 2.5 kb) of early or late ICM genes at each stage. c Box plots showing the motif numbers of NR5A2 and NSO at the promoters (TSS ± 2.5 kb) of early or late ICM genes. d Bar plots showing the percentages of downreuglated and upregulated genes among early, late ICM, or other expressed genes in Nr5a2 KD 8C embryos. e Box plots showing the average enrichment of NR5A2 signals at the promoters (TSS ± 2.5 kb) (in WT embryos) of downregulated or upregulated genes identified in Nr5a2 KD 8C embryos for early ICM genes and other 8C-expressing genes, with P values indicated. All genes were similarly analyzed and are shown as controls. f, g  The UCSC browser views showing NR5A2 binding of representative ICM/epiblast (f) or ICM/PrE and TE genes (g) in WT embryos and mESCs (top). Bar plots show expression fold change (Nr5a2 KD/control) for representative genes in 8C embryos of two biological replicates of RNA-seq (middle). Immunofluorescence of DAPI, NANOG (n = 11–12 embryos), OCT4 (n = 9–12 embryos), GATA6 (n = 13–14 embryos) or TEAD4 (n = 12–14 embryos) in mouse 8C embryos after Nr5a2 KD (scale bars: 20 μm) and quantification of signal intensity (relative to DAPI) as well as P values (t-test, two-sided) are shown. Each dot represents a single blastomere.
Fig. 6
Fig. 6. NR5A2 binds B1 repeats at the 2–8C stage.
a Heat maps showing enrichment (observed number/expected number from randomized peaks) of each repeat family in promoter and distal NR5A2 binding peaks. b Heat maps showing the gene expression, repeat density, and NR5A2 binding enrichment at the promoters of stage-specific genes. E2C, early 2-cell; L2C, late 2-cell. c Bar plots showing the enrichment of accessible B1 repeats based on ATAC-seq and DHS-seq data relative to the background (observed number/expected number) in early embryos. ExE, extraembryonic ectoderm; Epi, epiblast; Ect, ectoderm. d Box plots showing expression activation levels (late 2C/1C (left) and 8C/1C (right)) for genes near accessible or inaccessible B1 at the 2C and 8C stages, with P values indicated. The error bars denote the standard deviations of two biological replicates of RNA-seq. e Bar charts showing percentages of NR5A2 binding peaks at each stage in four types: motif in B1 (red), motif next to B1 (blue), motif non-overlapping with B1 (green), and no motif (gray). f TF motif frequencies and relative positions in the B1 consensus sequence are shown, with P values indicated.
Fig. 7
Fig. 7. NR5A2 connects ZGA to the first lineage specification in early development.
During mouse early development, NR5A2, a NR TF highly induced during ZGA, predominantly binds B1 repeats. NR5A2 is not required for global ZGA and enhancer opening in 2C embryos, but critically regulates 4–8C transcription (mid-preimplantation gene activation) and enhancer opening in 8C embryos. In 8C embryos, its targets include not only key pluripotency genes such as Pou5f1 and Nanog, but also PrE genes such as Gata6,  and key TE genes such as Tead4, Gata3. For early ICM genes, NR5A2 opens regulatory regions at the 8C stage, which likely also provides binding sites for NSO at late stages (blastocyst and mESC). NSO bind and regulate both early and late ICM genes in mESCs. Therefore, NR5A2 functions in totipotent embryos to bridge ZGA to the first lineage specification.

Similar articles

Cited by

References

    1. Lee MT, Bonneau AR, Giraldez AJ. Zygotic genome activation during the maternal-to-zygotic transition. Annu. Rev. Cell Dev. Biol. 2014;30:581–613. doi: 10.1146/annurev-cellbio-100913-013027. - DOI - PMC - PubMed
    1. Schulz KN, Harrison MM. Mechanisms regulating zygotic genome activation. Nat. Rev. Genet. 2019;20:221–234. doi: 10.1038/s41576-018-0087-x. - DOI - PMC - PubMed
    1. Tadros W, Lipshitz HD. The maternal-to-zygotic transition: a play in two acts. Development. 2009;136:3033–3042. doi: 10.1242/dev.033183. - DOI - PubMed
    1. Rossant J. Postimplantation development of blastomeres isolated from 4- and 8-cell mouse eggs. J. Embryol. Exp. Morphol. 1976;36:283–290. - PubMed
    1. Williams CL, Teeling JL, Perry VH, Fleming TP. Mouse maternal systemic inflammation at the zygote stage causes blunted cytokine responsiveness in lipopolysaccharide-challenged adult offspring. BMC Biol. 2011;9:49. doi: 10.1186/1741-7007-9-49. - DOI - PMC - PubMed

Publication types

Substances