. 2023 Dec;72(12):2199-2219.
doi: 10.1007/s00011-023-01809-w. Epub 2023 Nov 8.

Mutant p53R211* ameliorates inflammatory arthritis in AIA rats via inhibition of TBK1-IRF3 innate immune response

Affiliations

Mutant p53R211* ameliorates inflammatory arthritis in AIA rats via inhibition of TBK1-IRF3 innate immune response

Yaling Zeng et al. Inflamm Res. 2023 Dec.

Abstract

Background: Rheumatoid arthritis (RA) is an autoimmune inflammation disease characterized by imbalance of immune homeostasis. p53 mutants are commonly described as the guardian of cancer cells by conferring them drug-resistance and immune evasion. Importantly, p53 mutations have also been identified in RA patients, and this prompts the investigation of its role in RA pathogenesis.

Methods: The cytotoxicity of disease-modifying anti-rheumatic drugs (DMARDs) against p53 wild-type (WT)/mutant-transfected RA fibroblast-like synoviocytes (RAFLSs) was evaluated by MTT assay. Adeno-associated virus (AAV) was employed to establish p53 WT/R211* adjuvant-induced arthritis (AIA) rat model. The arthritic condition of rats was assessed by various parameters such as micro-CT analysis. Knee joint samples were isolated for total RNA sequencing analysis. The expressions of cytokines and immune-related genes were examined by qPCR, ELISA assay and immunofluorescence. The mechanistic pathway was determined by immunoprecipitation and Western blotting in vitro and in vivo.

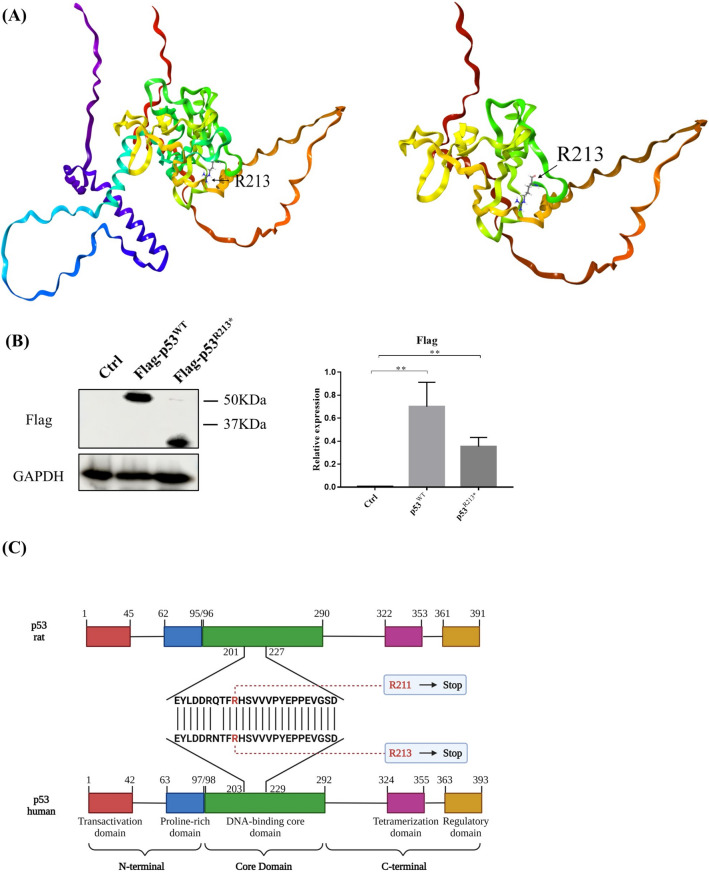
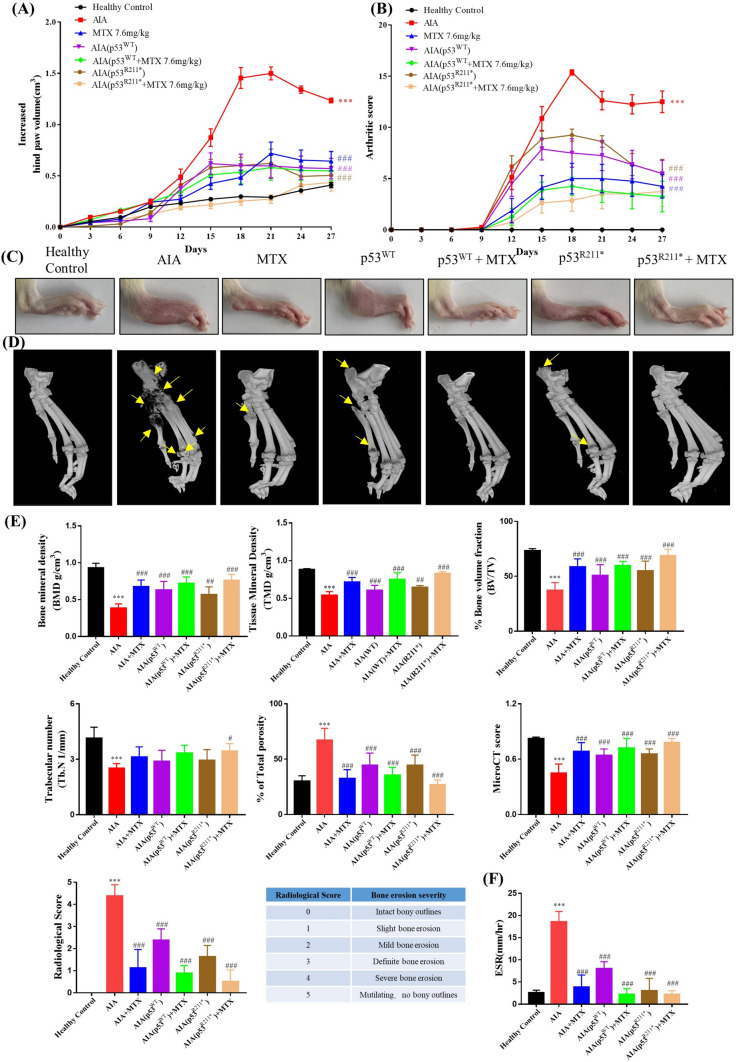
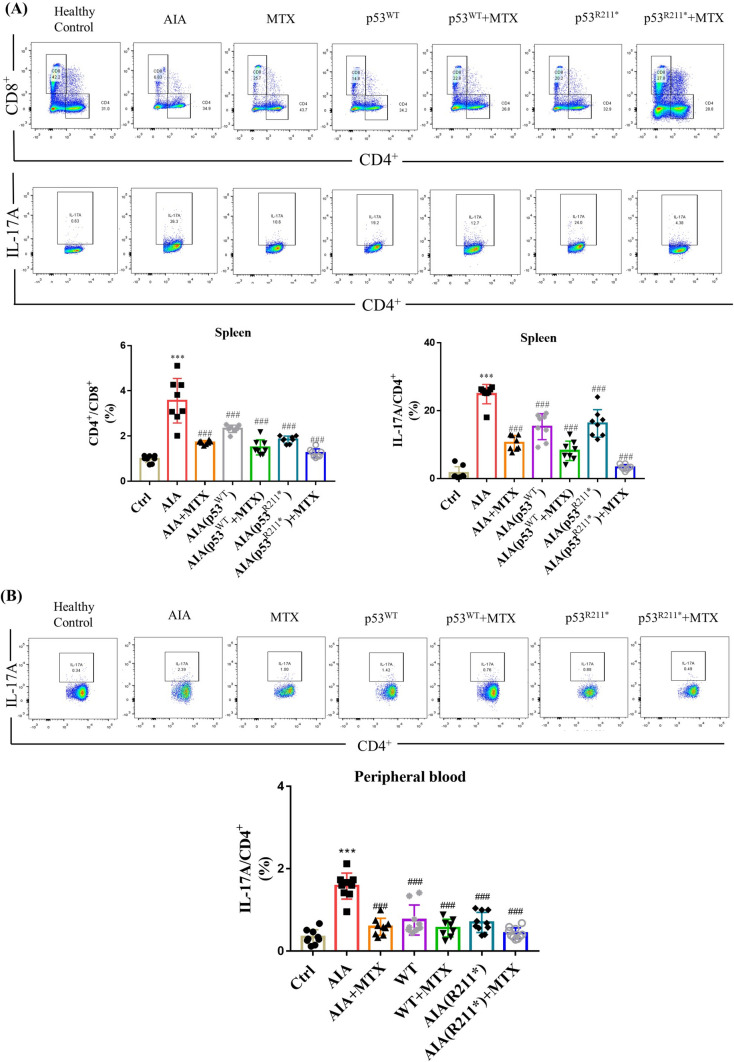
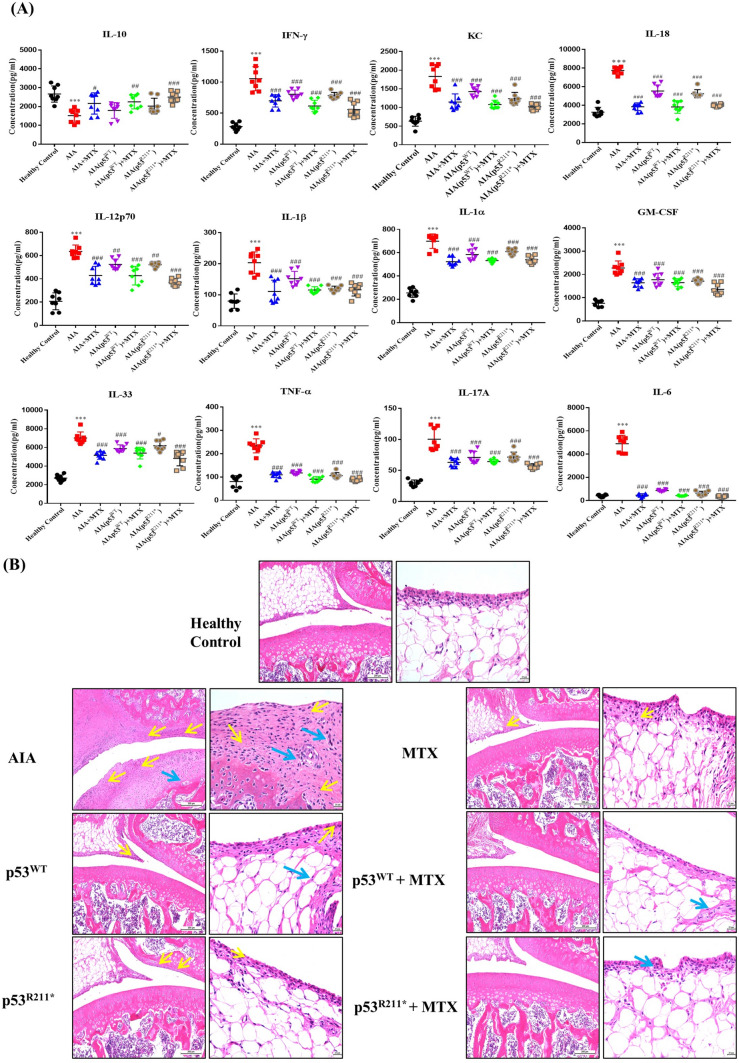
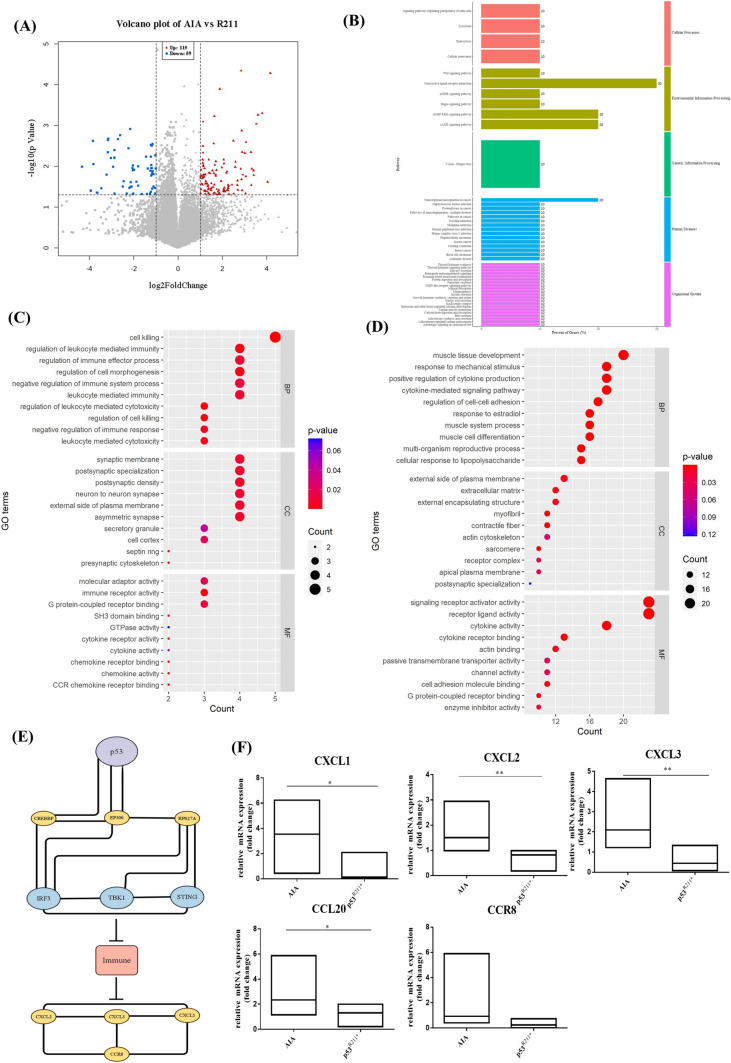
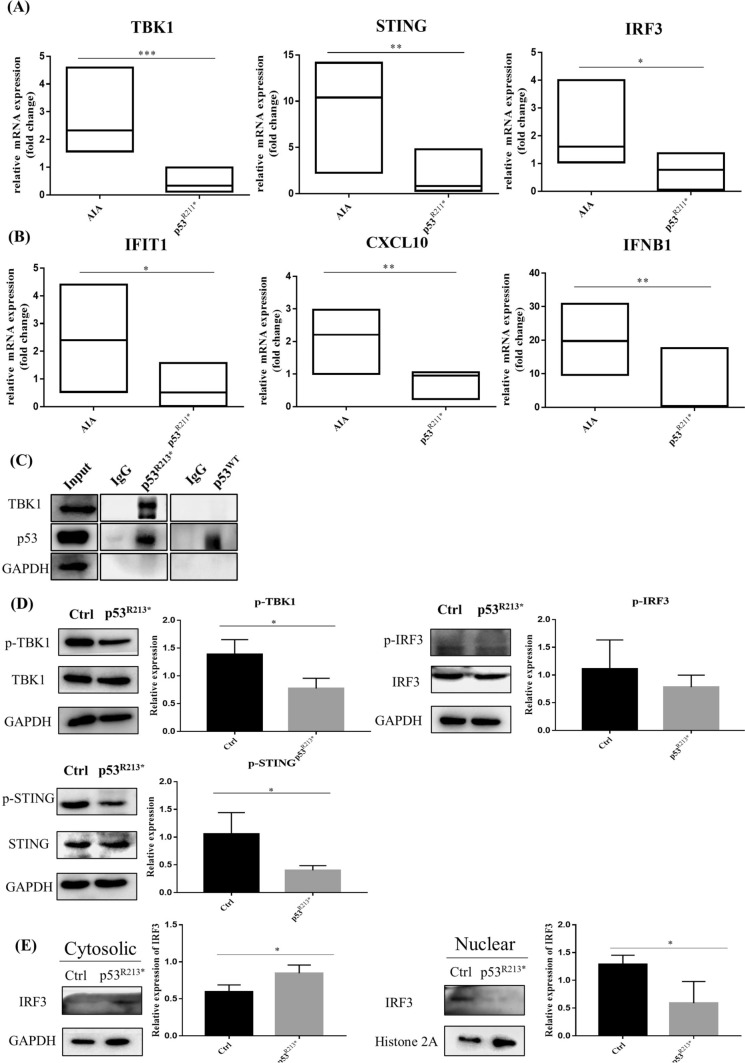
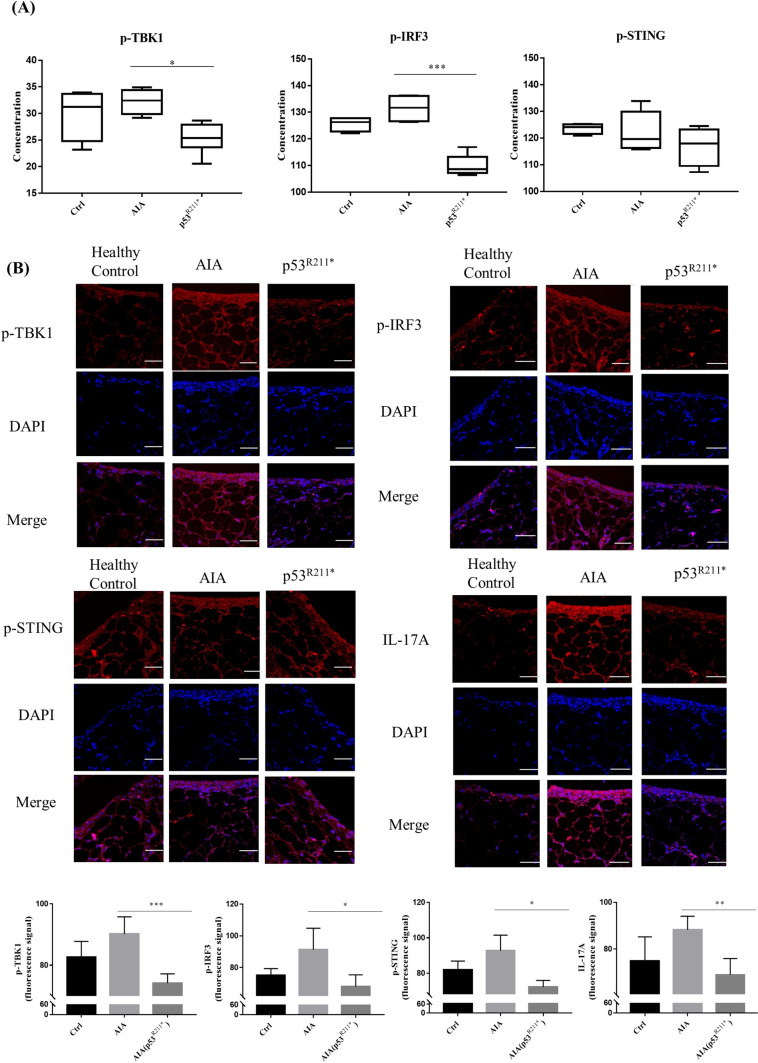
Results: Among p53 mutants, p53R213* exhibited remarkable DMARD-resistance in RAFLSs. However, AAV-induced p53R211* overexpression ameliorated inflammatory arthritis in AIA rats without Methotrexate (MTX)-resistance, and our results discovered the immunomodulatory effect of p53R211* via suppression of T-cell activation and T helper 17 cell (Th17) infiltration in rat joint, and finally downregulated expressions of pro-inflammatory cytokines. Total RNA sequencing analysis identified the correlation of p53R211* with immune-related pathways. Further mechanistic studies revealed that p53R213*/R211* instead of wild-type p53 interacted with TANK-binding kinase 1 (TBK1) and suppressed the innate immune TBK1-Interferon regulatory factor 3 (IRF3)-Stimulator of interferon genes (STING) cascade.

Conclusions: This study unravels the role of p53R213* mutant in RA pathogenesis, and identifies TBK1 as a potential anti-inflammatory target.

Keywords: IRF3; Rheumatoid arthritis; STING; TBK1; p53 mutant.


Conflict of interest statement

The authors declare no conflict of interest.

Figures

Fig. 1
Fig. 1
The general features of p53WT and p53R213*. A The discrepancy between p53WT and p53R213* structural proteins. The structure was downloaded from the AlphaFold Protein Structure Database and modified as WT (which is the original structure) and R213* structure and further prepared by Protein Preparation wizard [37, 38]. B Expression level of Flag in RAFLS transfected with p53WT or mutant p53R213* plasmid. Cell lysates were collected and analyzed by Western blotting using antibodies against Flag. The bar chart shows the quantitation of the target protein expression with respect to actin expression using ImageJ software. The data are expressed as the mean ± SEM. One-way ANOVA; **p < 0.01 compared with control. C The amino acid mutation spectrum of p53R213* in human and that of the corresponding p53R211* in rat. Structures of p53 wild-type gene in human and rat are shown with numbered domain, and the color represents different regions of DNA domains. Human p53 mutant R213 or its corresponding rat mutant R211 is located at the DNA-binding core domain (green) (color figure online)
Fig. 2
Fig. 2
The suppression effect of adeno-associated virus (AAV)-p53R211* in adjuvant-induced arthritis (AIA) rat model by single intra-articular knee injection. A, B The hind paw swelling and arthritic scores of AAV-p53R211*-injected AIA rat model. The AIA rats were either treated with the positive control drug, MTX (7.6 mg/kg), or articular knee injected with PBS, AAV-EGFP, AAV-p53WT and AAV-p53R211* (1 × 1011 PFU) with or without the co-treatment of MTX for 27 days. Hind paw volumes and arthritic scores were determined every 3 days. The data are expressed as mean ± SEM (n = 6–8). C Representative images of hind paw swelling on day 27 in AIA rats. D Representative micro-CT images of AIA rat hind paws (day 27) were reconstructed by using Inveon Research Workplace. The region of bone erosion was indicated by yellow arrows. E The micro-CT scores demonstrating the bone destruction condition of AIA rats were obtained from five disease-related indices: bone mineral density (BMD), tissue mineral density (TMD), % bone volume fraction (BV/TV), trabecular number (Tb. N), % of total porosity. Radiological scores were obtained by evaluating the bone erosion severity of rats with reference to the scoring table. The values are expressed as mean ± SEM (n = 6–8). F Erythrocyte sedimentation rate (ESR) in anticoagulated blood of all rat groups. WT: wild type, MTX: methotrexate. Two-way ANOVA; ###p < 0.001, ##p < 0.01, #p < 0.05 compared with AIA control group; ***p < 0.001 compared with healthy controls (color figure online)
Fig. 3
Fig. 3
The immunomodulatory effect of AAV-p53R211* in AIA rats by single intra-articular knee injection. A, B Immunological impact of articular knee injection of AAV-p53R211* in AIA model. The AIA rats from 6 model groups were articular knee injected with AAV-EGFP, AAV-p53WT or AAV-p53R211* (1 × 1011 PFU) with or without MTX treatment and monitored for 27 days. Peripheral blood and spleen lymphocytes were then harvested from these rats for flow cytometry analysis of T cell activation using fluorescent antibodies against CD45, CD3, CD4, CD8, Foxp3 and IL-17A. Representative scatter plot images displayed the CD4+ T cells under Th17 cell differentiation conditions. The quantitative bar charts show the percentage of CD8+ cells among CD4+ T lymphocytes and the percentage of IL-17A cells among CD4+ T lymphocytes. The data are expressed as mean ± SEM (n = 6–8) from three independent experiments. One-way ANOVA; ###p < 0.001 compared with AIA control group; ***p < 0.001 compared with healthy controls
Fig. 4
Fig. 4
The anti-inflammatory effects of AAV-p53R211* in AIA rats by single articular knee injection. A The T-helper-specific multiplex cytokine profile of rat blood sample. Serums were harvested from rat blood and analyzed by flow cytometry for the expression of inflammatory cytokines. B Representative histological sections of synovial membranes stained with H&E (scale bar: left 200 µm and right 20 µm). Representative images are shown with the same magnification. Yellow arrows indicate the synovial lining layer containing the hyperplasia of neutrophils, lymphocytes, plasma cells and other inflammatory cells; blue arrows indicate the proliferation of interstitial fibroblasts with neovascularization. Data are shown as mean ± SEM (n = 6–8). One-way AVOVA; #p < 0.05, ##p < 0.01, ###p < 0.001 compared with AIA control group, ***p < 0.001 compared with healthy controls (color figure online)
Fig. 5
Fig. 5
Differentially expressed genes (DEGs) for AAV-mediated overexpression of p53R211* in AIA rats are enriched in the autoimmune pathways as analyzed by RNA sequencing. A Volcanic map of differentially expressed mRNAs. Red dots represent significantly upregulated genes and blue dots represent significantly downregulated genes. B KEGG classification chart constructed from KEGG orthology (KO) databases using DEGs. Length of chart represent gene rations of DEGs participated in each of the pathway and labeled at the right of each chart. The color of the charts represents classification provided by KO analysis results. C, D Bubble diagram for the Gene Ontology (GO) analysis of DEGs. Biological processes are ranked on the enrichment fraction of each genome. The color of the bubbles represents p value. The size of the bubbles represents the gene enrichment ratio. E Protein–Protein interaction networks functional enrichment analysis analyzed by STRING and reorganized by Cytoscape (version 3.9.1). F Gene verification of the mRNA sequencing data by RT-qPCR. The 5 genes related to inflammatory chemokines, including CXCL1, CXCL2, CXCL3, CCL20 and CCR8, were selected for qPCR analysis. Gene expression was normalized to b-actin relative to the AIA vehicle control and analyzed using 2−ΔΔCT. Data are presented as mean ± SEM. One-way AVOVA; *p < 0.05, **p < 0.01, significantly different from AIA control group (color figure online)
Fig. 6
Fig. 6
Overexpression of p53R211* suppresses innate immunity via intervention of TBK1-IRF3-STING signaling cascade. A RT-qPCR analysis of innate immune-related genes (TBK1, STING and IRF3) in the synovium of AIA rats with or without AAV-p53R211* injection. B The mRNA expressions of various IRF3-controlled inflammatory cytokines (IFIT1, CXCL10 and IFNB1) in the synovium of AAV-p53R211*- and AAV-EGFP-injected AIA rats. C The interaction of human p53R213* mutant with TBK1 protein in RAFLS. The p53R213* and p53WT plasmid DNA were transfected into RAFLS cell line for 48 h and was immunoprecipitated from whole cell lysates. The cell lysates and immunoprecipitated proteins (IP) were then analyzed by Western blotting. D Overexpression of human p53R213* mutant suppressed the phosphorylation of TBK1, IRF3 and STING in RAFLS. RAFLS were transfected with p53R213* plasmid DNA for 48 h. Cell lysates were collected and analyzed by Western blotting using antibodies against p-TBK1, p-IRF3 and p-STING. The bar charts show the quantification of target protein expressions versus GAPDH expression from three independent experiments using ImageJ software. E Western blot analysis of IRF3 expression in cytoplasmic and nuclear fractions from RAFLS with or without the overexpression of p53R213* mutant. GAPDH and Histone 2A were used as loading controls for the cytoplasmic and nuclear fractions, respectively. *p < 0.05, **p < 0.01, ***p < 0.001 compared with AIA control group or mock transfected control cells
Fig. 7
Fig. 7
Overexpression of rat p53R211* mutant hinders TBK1-IRF3-STING trimeric complex formation and specifically reduces IL-17A expression in vivo. A Detection of p-TBK1, p-IRF3 and p-STING concentration in blood serum of the above treatment groups by ELISA assay. Blood serum was harvested from healthy controls, AAV-p53R211*- and AAV-EGFP-injected AIA rats. *p < 0.05, **p < 0.01, ***p < 0.0001 compared with AIA control group. B Representative immunofluorescence images (scale bar: 38.6 µm) demonstrate the synovial tissues from healthy controls, AAV-EGFP-injected and AAV-p53R211*-injected AIA rats (n = 5). Synovial tissues from five rats were sectioned and immune-stained with antibodies against p-TBK1, p-IRF3, p-STING and IL-17A prior to the treatment with anti-rabbit 2nd antibody conjugated with TRITC. The bar charts show the quantitative analysis of the immunofluorescent signals of the proteins by ImageJ software

Similar articles

Cited by

References

    1. Weyand CM, Goronzy JJ. The immunology of rheumatoid arthritis. Nat Immunol. 2021;22:10–18. - PMC - PubMed
    1. Komatsu N, Takayanagi H. Mechanisms of joint destruction in rheumatoid arthritis—immune cell–fibroblast–bone interactions. Nat Rev Rheumatol. 2022;18:415–429. - PubMed
    1. Takayanagi H. Osteoimmunology: shared mechanisms and crosstalk between the immune and bone systems. Nat Rev Immunol. 2007;7:292–304. - PubMed
    1. Firestein GS. Immunologic mechanisms in the pathogenesis of rheumatoid arthritis. JCR J Clin Rheumatol. 2005;11:S39–S44. - PubMed
    1. Wong VKW. Editorial overview: new technologies in 2020: drug resistance. Curr Opin Pharm. 2020;54:iii–vi. - PubMed