. 2024 Apr 5;26(4):625-639.
doi: 10.1093/neuonc/noad210.

Inhibition of ATR opposes glioblastoma invasion through disruption of cytoskeletal networks and integrin internalization via macropinocytosis

Affiliations

Inhibition of ATR opposes glioblastoma invasion through disruption of cytoskeletal networks and integrin internalization via macropinocytosis

Sarah J Derby et al. Neuro Oncol. .

Abstract

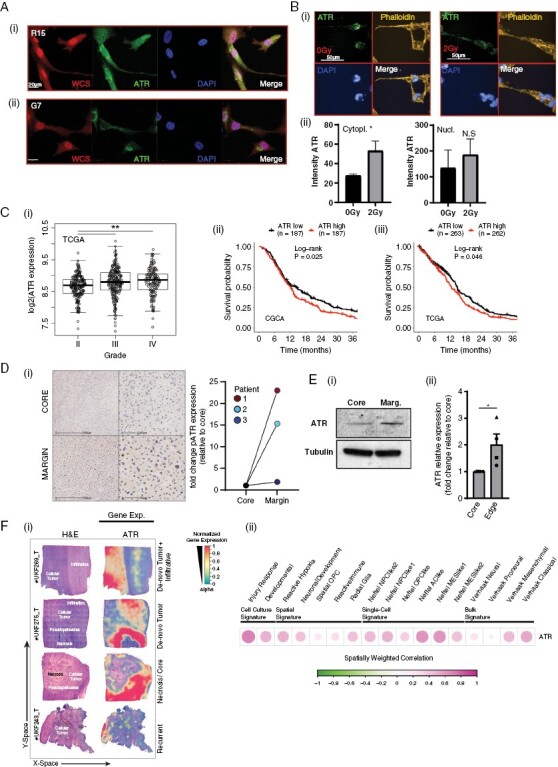
Background: Glioblastomas have highly infiltrative growth patterns that contribute to recurrence and poor survival. Despite infiltration being a critical therapeutic target, no clinically useful therapies exist that counter glioblastoma invasion. Here, we report that inhibition of ataxia telangiectasia and Rad 3 related kinase (ATR) reduces invasion of glioblastoma cells through dysregulation of cytoskeletal networks and subsequent integrin trafficking.

Methods: Glioblastoma motility and invasion were assessed in vitro and in vivo in response to ATR inhibition (ATRi) and ATR overexpression using time-lapse microscopy, two orthotopic glioblastoma models, and intravital imaging. Disruption to cytoskeleton networks and endocytic processing were investigated via high-throughput, super-resolution and intravital imaging.

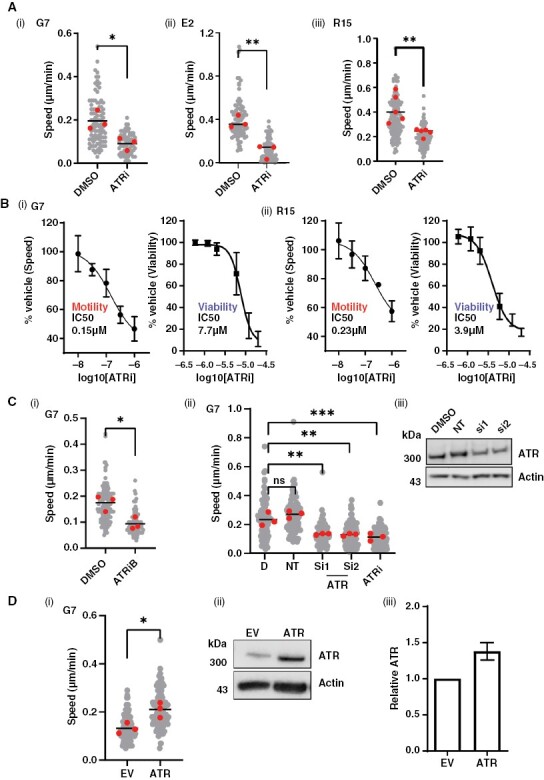
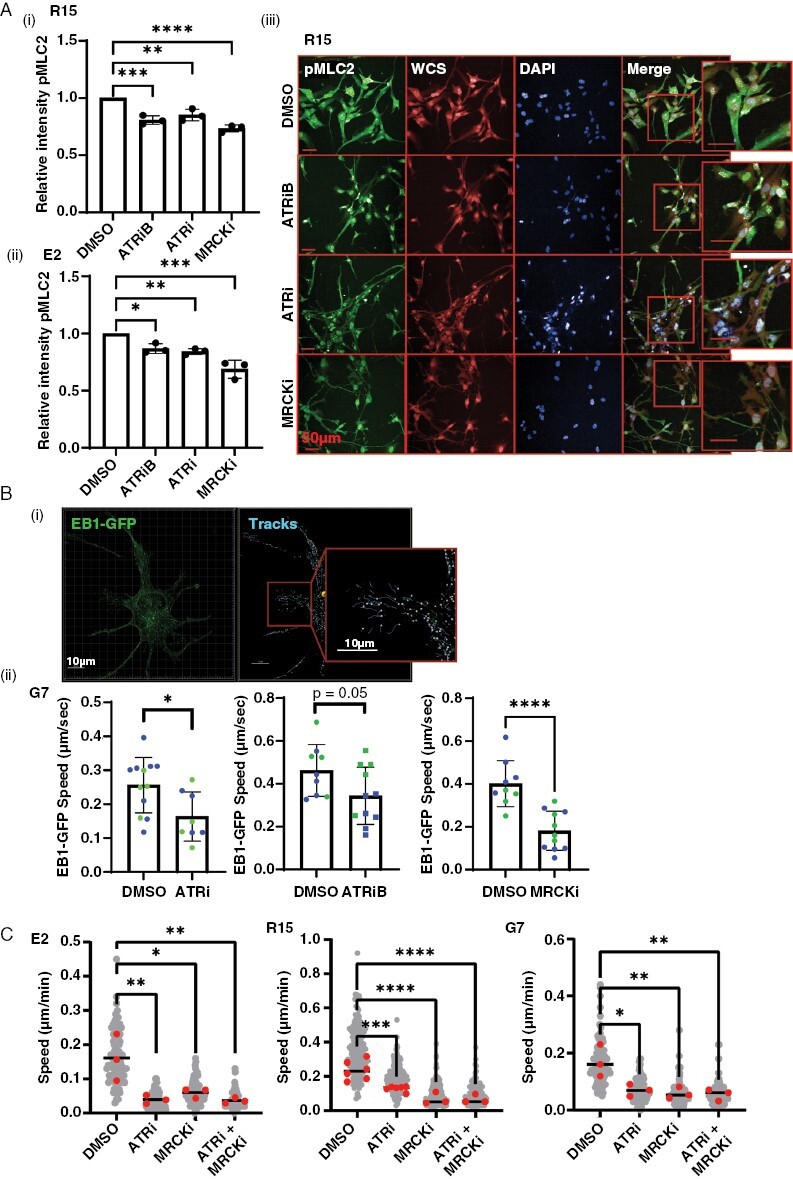
Results: High ATR expression was associated with significantly poorer survival in clinical datasets while histological, protein expression, and spatial transcriptomics using glioblastoma tumor specimens revealed higher ATR expression at infiltrative margins. Pharmacological inhibition with two different compounds and RNAi targeting of ATR opposed the invasion of glioblastoma, whereas overexpression of ATR drove migration. Subsequent investigation revealed that cytoskeletal dysregulation reduced macropinocytotic internalization of integrins at growth-cone-like structures, resulting in a tumor microtube retraction defect. The biological relevance and translational potential of these findings were confirmed using two orthotopic in vivo models of glioblastoma and intravital imaging.

Conclusions: We demonstrate a novel role for ATR in determining invasion in glioblastoma cells and propose that pharmacological targeting of ATR could have far-reaching clinical benefits beyond radiosensitization.

Keywords: ATR; DNA damage response; glioblastoma; high-grade glioma; invasion; macropinocytosis.


Conflict of interest statement

None declared.

Figures

Graphical Abstract
Graphical Abstract
Figure 1.
Figure 1.
(A) ATR is found in both the nucleus and cytoplasm of glioblastoma cells and is associated with invasive potential. (i) R15 and G7 cells were fixed and stained with whole cell stain , ATR , and DAPI. (B) G7 cells were irradiated with 2Gy and fixed after 6 h and stained for ATR (green), Phalloidin (yellow), and DAPI (blue) followed by high-throughput imaging and automated analysis. Data from 3 biological repeats, 2000–4000 cells imaged per condition per repeat. Bars are mean ± SEM. Statistical analysis using student’s t-test. *P < .05, NS = not significant. (C) ATR expression correlates with both (i) glioma grade and (ii), (iii) poorer patient survival. (D) Increased pATR expression can be found in the invasive tumor margin versus the tumor core in patient samples. (i) Core and margin samples were taken from 3 different patients, stained for pATR and scored by a neuropathologist for positive cells and the fold change between core and margin plotted. (E)(i) ATR expression is increased in primary Ox5 glioblastoma cells derived from the tumor margin compared to matched cells from the core. (ii) Western blot quantified from 4 independent biological repeats. Statistical analysis using student’s t-test. *P < .05. (F)(i) Spatial transcriptomics identifies increased ATR expression in tumor margins and pseudopallisades (ii) ATR expression was aligned with known cell culture, spatial, single cell, and bulk signatures.
Figure 2.
Figure 2.
ATR is required to drive glioblastoma cell migration in vitro. A(i) G7, E2, and R15 cells were plated subconfluently and treated with either DMSO or ATRi (1 µM VE822) for 24 h followed by time-lapse microscopy and single-cell tracking. (B) G7 (i) and R15 (ii) cells show a dose-dependent reduction in migration speed with ATR inhibition, at sublethal concentrations of inhibitor. Cells were incubated with DMSO/ATRi for 24 h followed time-lapse microscopy and single-cell tracking or viability assay. (C)(i) G7 cells were plated subconfluently and treated with either DMSO or ATRiB (1 µM Bayer 1895344) for 24 h followed by time-lapse microscopy and single-cell tracking. (ii) G7 cells were treated with siRNAs targeting ATR or 1 µM ATRi (VE822) followed by time-lapse microscopy and single-cell tracking. ATR knockdown was confirmed by western blot (iii). D = DMSO; NT = non-targeting siRNA. (D)(i) ATR was overexpressed in G7 cells followed by time-lapse microscopy and single-cell tracking. (ii) and (iii) Overexpression was confirmed by western blot (n = 2, error bar = std dev). (ii). EV = Empty vector (pcDNA3). For all motility assays, data from 3 biological repeats, >30 cells tracked per repeat (gray). Two-tailed, unpaired Student’s t-test was performed on means from each biological repeat . For siRNA in C(ii), a 1-way ANOVA and Dunnett’s test were performed. *P < .05, **P < .01, ***P < .001, n.s. = nonsignificant.
Figure 3.
Figure 3.
Inhibition of ATR causes a decrease in active macropinocytosis and endocytic processing. (A)(i) An accumulation of large vacuoles following either treatment with ATRi was observed in all 3 cell lines, E2 shown as an example. (ii) Number of vacuoles per cell following ATRi or RNAi of ATR was quantified in G7 cells, statistical significance was determined using a 1-way ANOVA and Dunnett’s test. (B) Electron microscopy of G7 cells showed vacuoles to be single membrane bound. (C)(i) E2 cells incubated with 70 kDa Texas red dextran (red) alongside ATRi or DMSO. White = whole cell stain, blue = DAPI. (D) Treatment of mice with ATRi (VX970) in an intracranial window model causes an accumulation of labeled dextran in vivo. (i) Multiphoton imaging and processing were used to detect the uptake of fluorescent dextran in to GFP-S24 cells in the mouse brain. (ii) Five mice were treated with DMSO and Cascade blue labeled dextran followed by imaging, then treated with ATRi and Texas red labeled dextran followed by second imaging in a longitudinal experiment (1 mouse received only ATRi plus CB-Dex). (iii) Pearson’s coefficient was calculated under each treatment condition for each mouse to estimate colocalization of dextran with S24-GFP cells using Imaris colocalization tool. >3 images per imaging session per mouse, image data plotted individually (small points) or as mean for each mouse (large points), color coded for each mouse. **P < .01, Student’s t-test. (E) Timed experiments demonstrate ATRi inhibits both the uptake and downstream degradation of internalized dextran. (i) G7 cells were incubated with DMSO, ATRi, or EIPA for 15 min or 2 h before incubation with labeled dextran. (ii) G7 cells were pre-incubated with dextran to allow uptake before addition of DMSO, ATRi, or EIPA. Data represents 3 biological repeats, 2000–4000 cells quantified via high-throughput imaging per condition per repeat. Statistical significance was determined using a 1-way ANOVA and Dunnett’s test. *P < .05; **P < 0.01, n.s = not significant.
Figure 4.
Figure 4.
Macropinocytosis is required to internalize integrins at TM growth-cone-like structures, allowing TM deadhesion, retraction, and cell migration. (A) Time lapse of migrating G7 cells following 24 h of ATRi/DMSO exposure. Arrows indicate the termini of neurites. (B) E2 cells were treated with DMSO or 1 µM ATRi for 5 h, followed by fixing and staining for WCS (white), Integrin α6 (red). (C) G7 cells were treated with DMSO or 1 µM ATRi before lysis and measurement of internalized pool of integrins. Data from 3 independent experiments. **P > 0.01, Mann–Whitney. (D)(i) Super-resolution microscopy was used to image the growth-cone-like structures at the ends of glioblastoma neurites. (ii) G7 cells expressing GFP-α5 integrin were incubated with 70 kDa Texas red dextran followed by DMSO (ii) or VE822 (iii) prior to super-resolution, time-lapse imaging of growth cones. See Fig S4C for images of separated fluorescence channels. Yellow = colocalization. White arrows indicate areas of membrane retraction; red arrows indicate dextran-positive macropinosomes. (iv) Speed of intracellular trafficking of endosomes was measured using automated tracking in Imaris. Data from 3 super-resolution images of growth cones per condition. Statistical analysis Student’s t-test ****P > .001
Figure 5.
Figure 5.
ATRi causes a reduction in actin cytoskeleton and microtubule plasticity. (A) R15 and E2 cells were incubated with DMSO, 1 µM ATRiB, 1 µM ATRi, or 1 µM MRCKi for 6 h before staining with antibody against pMLC2 , whole cell stain , and DAPI followed by high-throughput imaging and automated analysis. Images from R15 shown as an exemplar. Data from 3 biological repeats, 2000–4000 cells imaged per condition each repeat. Bars are mean ± SD. Statistical significance was determined using one way ANOVA and Dunnett’s test: **P > .01, ***P > .005. (B)(i) EB1-GFP was transiently expressed in G7 cells, incubated with DMSO, ATRi, ATRiB, or MRCKi for 16 h (ii), followed super-resolution time-lapse imaging and 3D automated tracking of EB1-GFP foci in Imaris. EB1-GFP foci tracking data from two biological repeats (color coded). Each point represents data from a single image (1–3 cells) with >100 EB1-GFP foci tracked per image. *P < .05, Student’s t-test. (C) G7, E2, and R15 cells were plated subconfluently and treated with either DMSO, ATRi (1 µM VE822), MRCKi (1 µM BDP9066), or combined treatment for 24 h followed by time-lapse microscopy and single-cell tracking. Statistical analysis = 1-way ANOVA; *P < .05, **P < .01, ***P < .001, ****P < .0001.
Figure 6:
Figure 6:
Inhibition of ATR opposes glioblastoma cell infiltration in vivo. (A) Pharmacokinetic (PK) analysis of VX970 delivery to G7 intracranial tumors and normal brain (contralateral hemisphere). (B)(i) Intracranial injection of G7 cells was undertaken and tumors allowed to develop for 10 weeks, followed by 2 weeks of treatment with vehicle or VX970. Percentage Ki67-positive glioblastoma cells outside tumor bulk were calculated using automated analysis. (C)(i) Intracranial injection of S24 cells and tumors allowed to develop for 2 weeks followed by 2 weeks of treatment with vehicle or VX970 and cull of animals at a timed endpoint and processed as in (B). For both B and C, 2–4 sections per mouse were analyzed and averaged, and each average/mouse plotted as a single data point. *P < .05. (D)(i) Intracranial window mice with S24 tumors were dosed and imaged according to the schedule in (ii). Tumor microtube (TM) length was measured in multiple images per mice and image data plotted individually (small points) or as mean for each mouse (large points), color coded for each mouse. Arrows indicate TM structures. N = 5, 1 mouse only received VX970, **P > .001. For all experiments, the number of mice per cohort is indicated adjacent to the relevant data point.

References

    1. Drumm MR, Dixit KS, Grimm S, et al. . Extensive brainstem infiltration, not mass effect, is a common feature of end-stage cerebral glioblastomas. Neuro Oncol. 2020;22(4):470–479. - PMC - PubMed
    1. Stupp R, Mason WP, van den Bent MJ, et al. ; European Organisation for Research and Treatment of Cancer Brain Tumor and Radiotherapy Groups. Radiotherapy plus concomitant and adjuvant temozolomide for glioblastoma. N Engl J Med. 2005;352(10):987–996. - PubMed
    1. Wegner RE, Abel S, Horne ZD, et al. . National trends in radiation dose escalation for glioblastoma. Radiat Oncol J. 2019;37(1):13–21. - PMC - PubMed
    1. Walker MD, AlexanderE, Jr, Hunt WE, et al. . Evaluation of BCNU and/or radiotherapy in the treatment of anaplastic gliomas A cooperative clinical trial. J Neurosurg. 1978;49(3):333–343. - PubMed
    1. Birch JL, Strathdee K, Gilmour L, et al. . A novel small-molecule inhibitor of MRCK prevents radiation-driven invasion in glioblastoma. Cancer Res. 2018;78(22):6509–6522. - PubMed

Publication types