. 2024 Jan;11(1):121-132.
doi: 10.1002/acn3.51938. Epub 2023 Nov 7.

The role of the amygdala in ictal central apnea: insights from brain MRI morphometry

Affiliations

The role of the amygdala in ictal central apnea: insights from brain MRI morphometry

Elisa Micalizzi et al. Ann Clin Transl Neurol. 2024 Jan.

Abstract

Objective: Ictal central apnea (ICA) is a frequent correlate of focal seizures, particularly in temporal lobe epilepsy (TLE), and regarded as a potential electroclinical biomarker of sudden unexpected death in epilepsy (SUDEP). Aims of this study are to investigate morphometric changes of subcortical structures in ICA patients and to find neuroimaging biomarkers of ICA in patients with focal epilepsy.

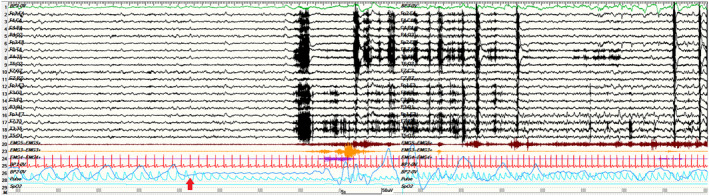
Methods: We prospectively recruited focal epilepsy patients with recorded seizures during a video-EEG long-term monitoring with cardiorespiratory polygraphic recordings from April 2020 to September 2022. Participants were accordingly subdivided into two groups: patients with focal seizures with ICA (ICA) and without (noICA). A pool of 30 controls matched by age and sex was collected. All the participants underwent MRI scans with volumetric high-resolution T1-weighted images. Post-processing analyses included a whole-brain VBM analysis and segmentation algorithms performed with FreeSurfer.

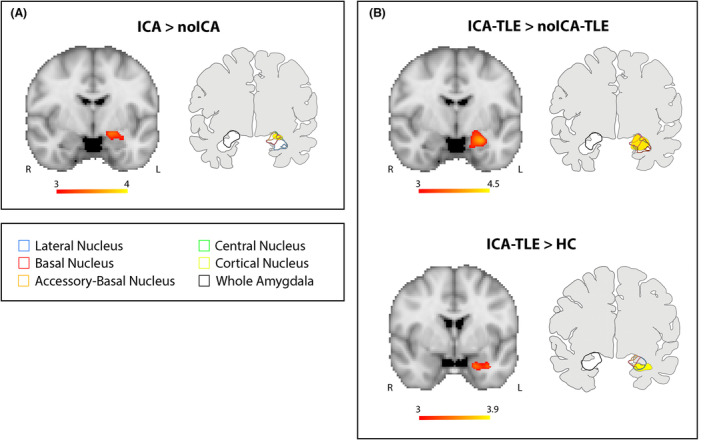
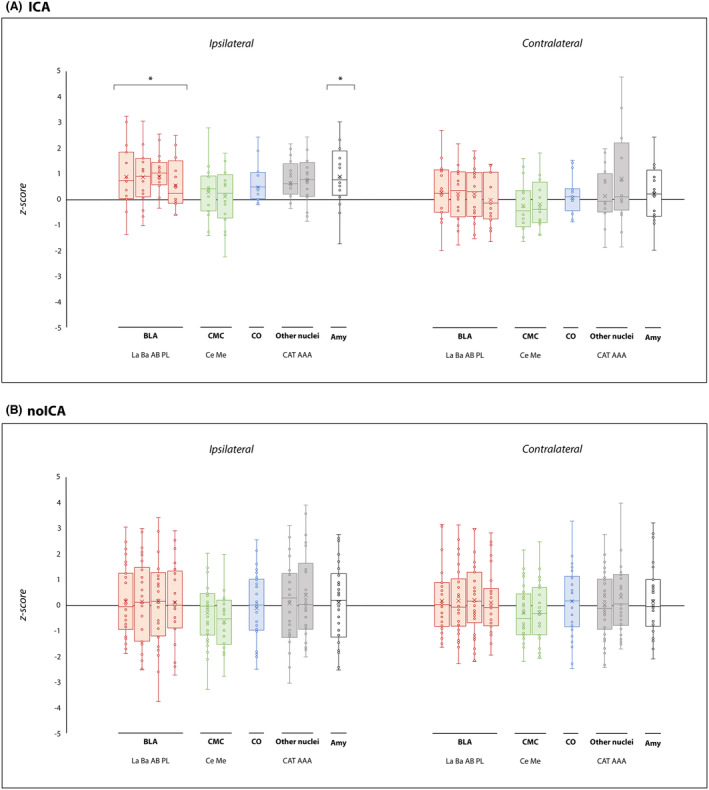
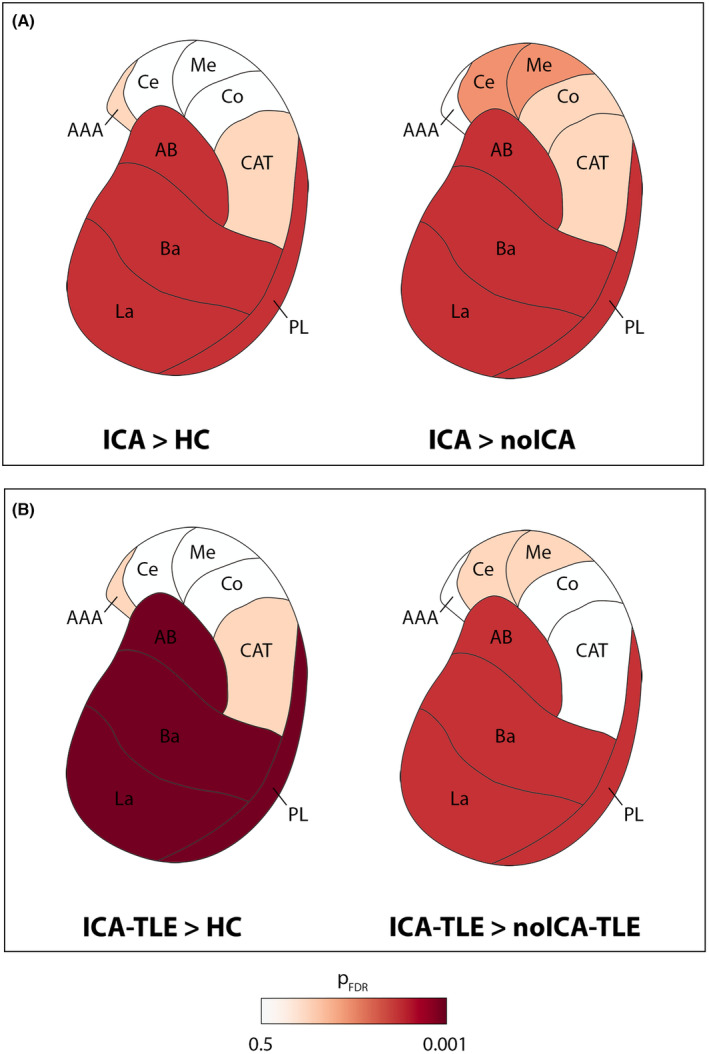
Results: Forty-six patients were recruited (aged 15-60 years): 16 ICA and 30 noICA. The whole-brain VBM analysis showed an increased gray matter volume of the amygdala ipsilateral to the epileptogenic zone (EZ) in the ICA group compared to the noICA patients. Amygdala sub-segmentation analysis revealed an increased volume of the whole amygdala, ipsilateral to the EZ compared to controls [F(1, 76) = 5.383, pFDR = 0.042] and to noICA patients ([F(1, 76) = 5.383, pFDR = 0.038], specifically of the basolateral complex (respectively F(1, 76) = 6.160, pFDR = 0.037; F(1, 76) = 5.121, pFDR = 0.034).

Interpretation: Our findings, while confirming the key role of the amygdala in participating in ictal respiratory modifications, suggest that structural modifications of the amygdala and its subnuclei may be valuable morphological biomarkers of ICA.


Conflict of interest statement

E. Micalizzi has served as a paid consultant for Angelini Pharma. F. Villani has served as a paid consultant and received support from Angelini Pharma, UCB Pharma, EISAI, Lusofarmaco, Jazz Pharma, Bial.S. Meletti has served as a paid consultant and received support from the Ministry of Health (MOH), UCB, GW, Jazz pharmaceuticals and EISAI. A.E. Vaudano has served as a paid consultant for Angelini Pharma. The other authors report no conflict of interest.

Figures

Figure 1
Figure 1
A 2‐min view of a left temporal seizure occurring during N2 sleep in a representative ICA patient (pt#9). ICA onset is indicated by the red arrow and precedes the appearance of the electrographic discharge over the left fronto‐temporal regions. No hypoxemia was recorded during this seizure. Red channel: EKG; light blue channel: pulse‐oxymetry; blue channel: thoracoabdominal respirogram.
Figure 2
Figure 2
Voxel‐based morphometry (VBM) results. Panel (A) VBM analysis looking for gray matter volume increase in ICA compared to noICA patients. Panel (B) VBM analysis exploring gray matter volume increases in ICA‐TLE compared to noICA‐TLE patients (upper images) and ICA‐TLE compared to HC (lower images). For each Panel, left images show significant amygdala enlargement on the left side, ipsilateral to the EZ (details are explained in the methods section). Results are displayed on the coronal Montreal Neurological Institute (MNI) template image (MNI152‐T1‐2 mm). Color bar reflects T scores. Right images of each panel display the overlap of the VBM results and the amygdala subnuclei segmentation as provided by Saygin et al. R = right; L = left.
Figure 3
Figure 3
Amygdalar subnuclei comparisons between ICA and noICA groups and controls. Box‐and‐whisker plots of volumes of amygdalar structures ipsilateral and contralateral to the EZ in ICA (A) and noICA patients (B) standardized relatively to controls. The boxes' central horizontal line marks the median, and the upper and lower edges (the hinges) mark the 25th and 75th percentiles (the central 50% of the values fall within the box). The “x” in the middle of each box marks the mean volume for each nucleus. The open circles represent each patient. The black line on the 0 value designates the mean volume of controls. Finally, the “*” on the boxes indicates the significant results (pFDR < 0.05) from the comparison between patient groups and controls. La, lateral nucleus; Ba, basal nucleus; AB, accessory basal nucleus; PL, paralaminar nucleus; Ce, central nucleus; Me, medial nucleus; Co, cortical nucleus; AAA, anterior amygdaloid area; CAT, corticoamygdaloid transition area; BLA, basolateral amygdala; CMC, central‐medial complex; CO, cortical complex; Amy, whole amygdala volume.
Figure 4
Figure 4
Amygdalar subnuclei comparisons between ICA, noICA, and controls in the whole population and in TLE subgroups. The comparisons between ICA and the other groups (i.e., controls and noICA) are represented using FDR adjusted P‐value. Only the amygdala ipsilateral to the EZ is presented. Panel (A) shows the comparison between ICA patients versus controls (left image) and noICA (right image). Panel (B) shows the comparison among the subgroups of ICA‐TLE compared to controls (left image), and noICA‐TLE (right image). La, lateral nucleus; Ba, basal nucleus; AB, accessory basal nucleus; PL, paralaminar nucleus; Ce, central nucleus; Me, medial nucleus; Co, cortical nucleus; AAA, anterior amygdaloid area; CAT, corticoamygdaloid transition area. See text for details.

References

    1. Lacuey N, Zonjy B, Hampson JP, et al. The incidence and significance of periictal apnea in epileptic seizures. Epilepsia. 2018;59(3):573‐582. doi:10.1111/epi.14006 - DOI - PMC - PubMed
    1. Vilella L, Lacuey N, Hampson JP, et al. Incidence, recurrence, and risk factors for peri‐ictal central apnea and sudden unexpected death in epilepsy. Front Neurol. 2019;10:166. doi:10.3389/fneur.2019.00166 - DOI - PMC - PubMed
    1. Ryvlin P, Nashef L, Lhatoo SD, et al. Incidence and mechanisms of cardiorespiratory arrests in epilepsy monitoring units (MORTEMUS): a retrospective study. Lancet Neurol. 2013;12(10):966‐977. doi:10.1016/S1474-4422(13)70214-X - DOI - PubMed
    1. Micalizzi E, Vaudano AE, Giovannini G, Turchi G, Giunta L, Meletti S. Case report: ictal central apnea as first and overlooked symptom in temporal lobe seizures. Front Neurol. 2021;12:753860. doi:10.3389/fneur.2021.753860 - DOI - PMC - PubMed
    1. Micalizzi E, Vaudano AE, Ballerini A, et al. Ictal apnea: a prospective monocentric study in patients with epilepsy. Eur J Neurol. 2022;29(12):3701‐3710. doi:10.1111/ene.15547 - DOI - PMC - PubMed

Publication types

LinkOut - more resources