

PTPN1 is a prognostic biomarker related to cancer immunity and drug sensitivity: from pan-cancer analysis to validation in breast cancer
- PMID: 37936713
- PMCID: PMC10626546
- DOI: 10.3389/fimmu.2023.1232047
PTPN1 is a prognostic biomarker related to cancer immunity and drug sensitivity: from pan-cancer analysis to validation in breast cancer
Abstract
Background: Protein tyrosine phosphatase non-receptor type 1 (PTPN1), a member of the protein tyrosine phosphatase superfamily, has been identified as an oncogene and therapeutic target in various cancers. However, its precise role in determining the prognosis of human cancer and immunological responses remains elusive. This study investigated the relationship between PTPN1 expression and clinical outcomes, immune infiltration, and drug sensitivity in human cancers, which will improve understanding regarding its prognostic value and immunological role in pan-cancer.
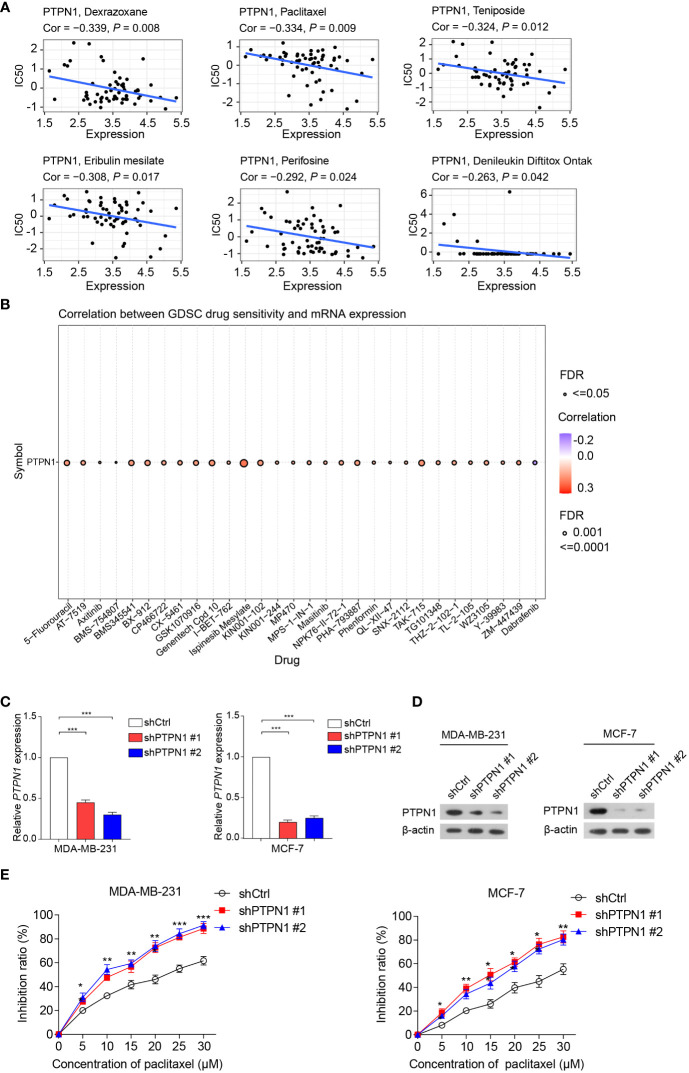
Methods: The PTPN1 expression profile was obtained from The Cancer Genome Atlas and Cancer Cell Line Encyclopedia databases. Kaplan-Meier, univariate Cox regression, and time-dependent receiver operating characteristic curve analyses were utilized to clarify the relationship between PTPN1 expression and the prognosis of pan-cancer patients. The relationships between PTPN1 expression and the presence of tumor-infiltrated immune cells were analyzed using Estimation of Stromal and Immune cells in Malignant Tumor tissues using Expression data and Tumor Immune Estimation Resource. The cell counting kit-8 (CCK-8) assay was performed to examine the effects of PTPN1 level on the sensitivity of breast cancer cells to paclitaxel. Immunohistochemistry and immunoblotting were used to investigate the relationship between PTPN1 expression, immune cell infiltration, and immune checkpoint gene expression in human breast cancer tissues and a mouse xenograft model.
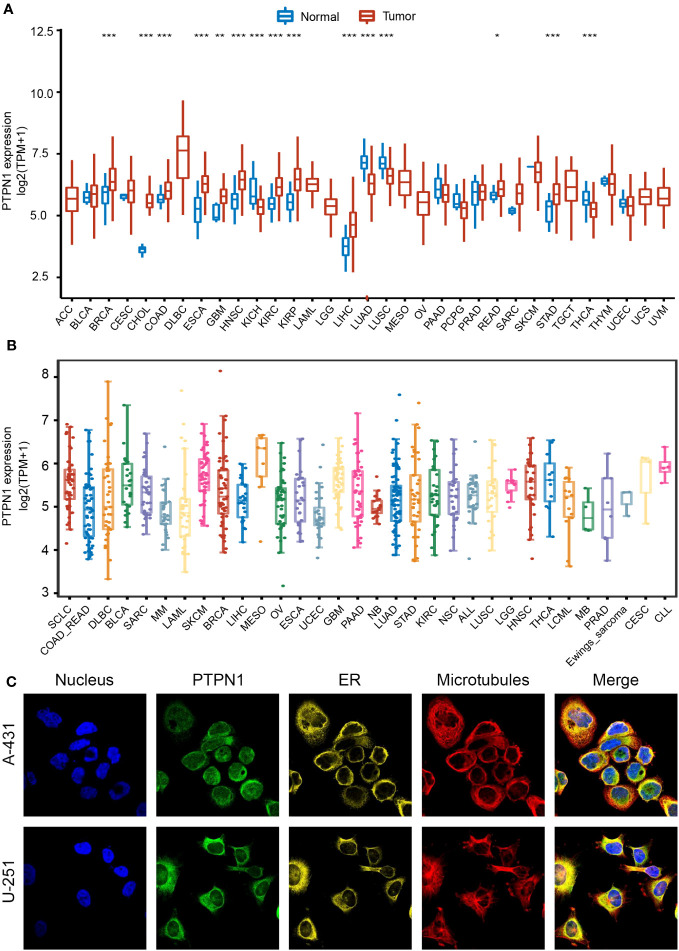
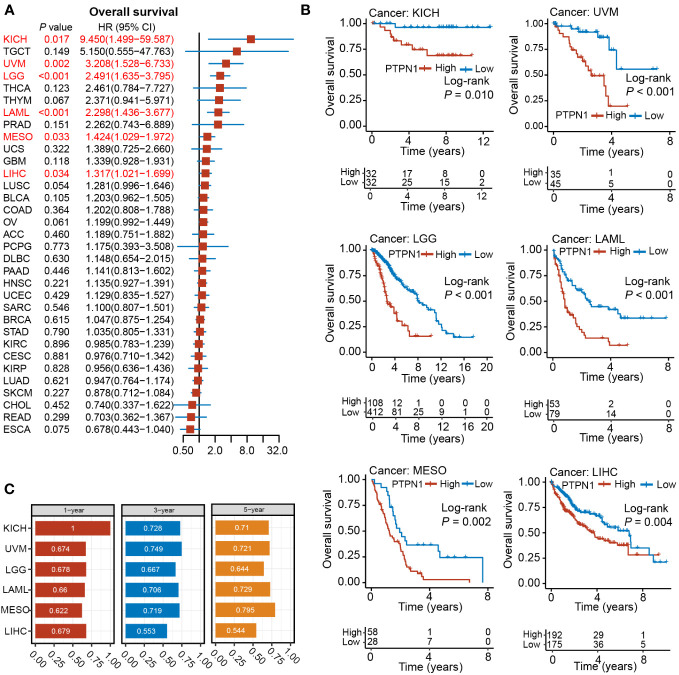
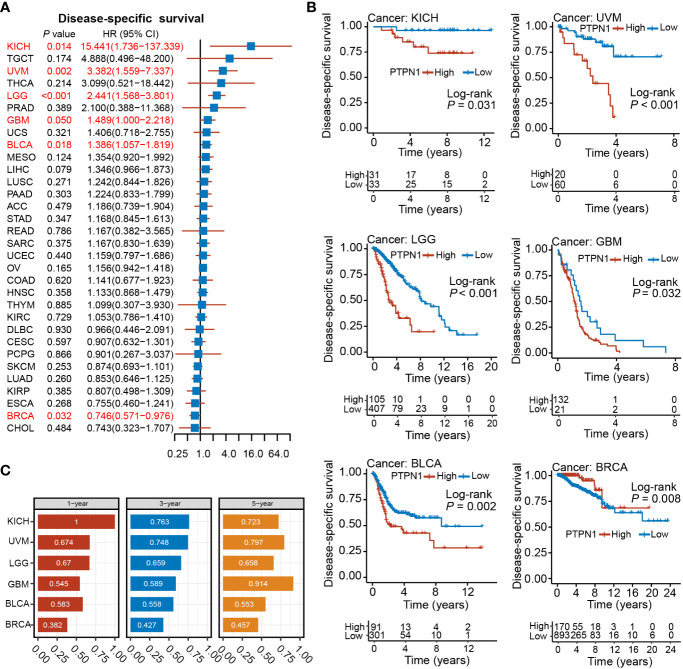
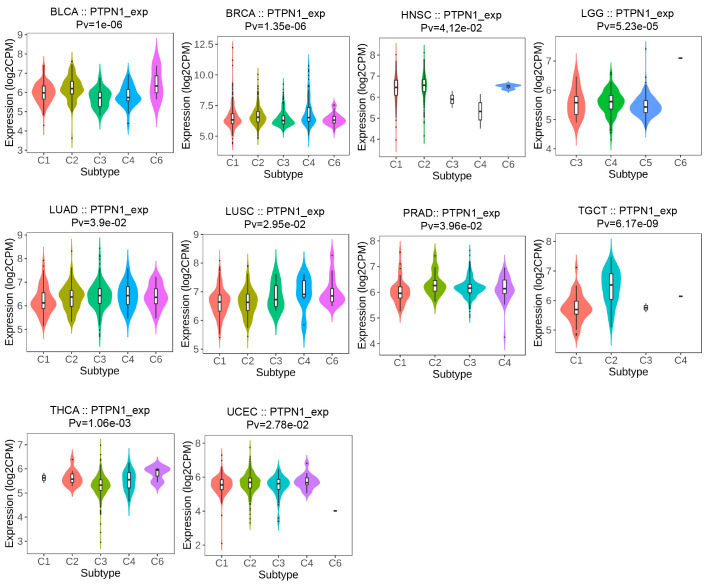
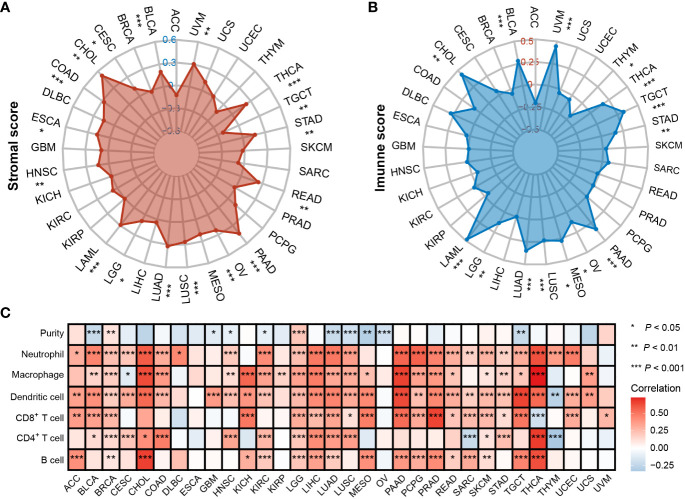
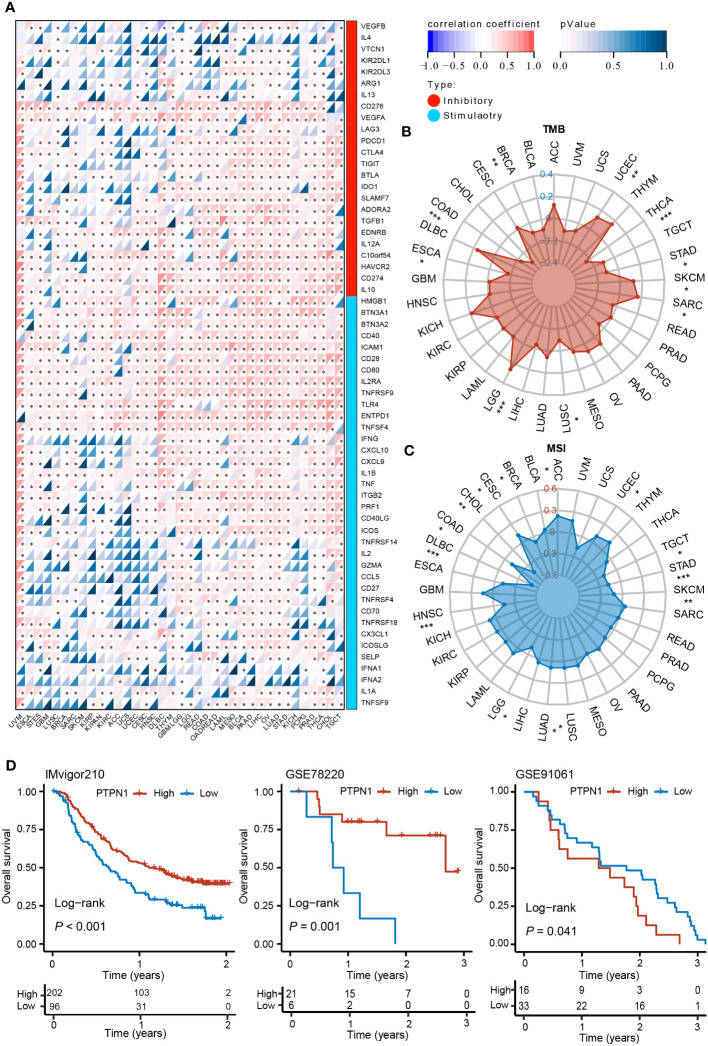
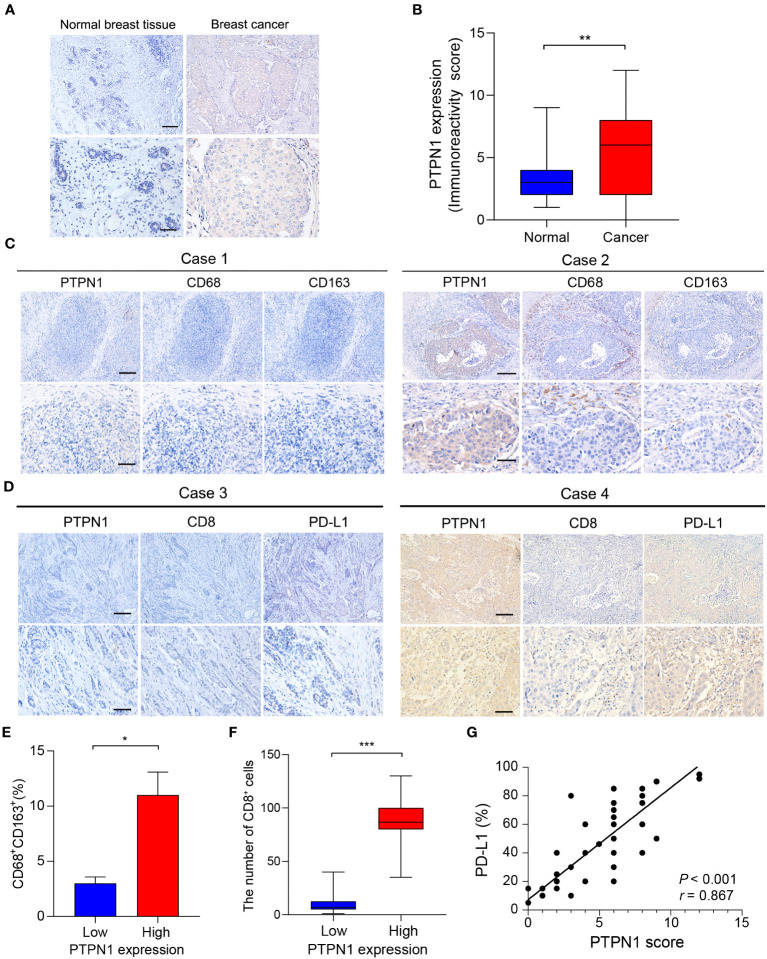
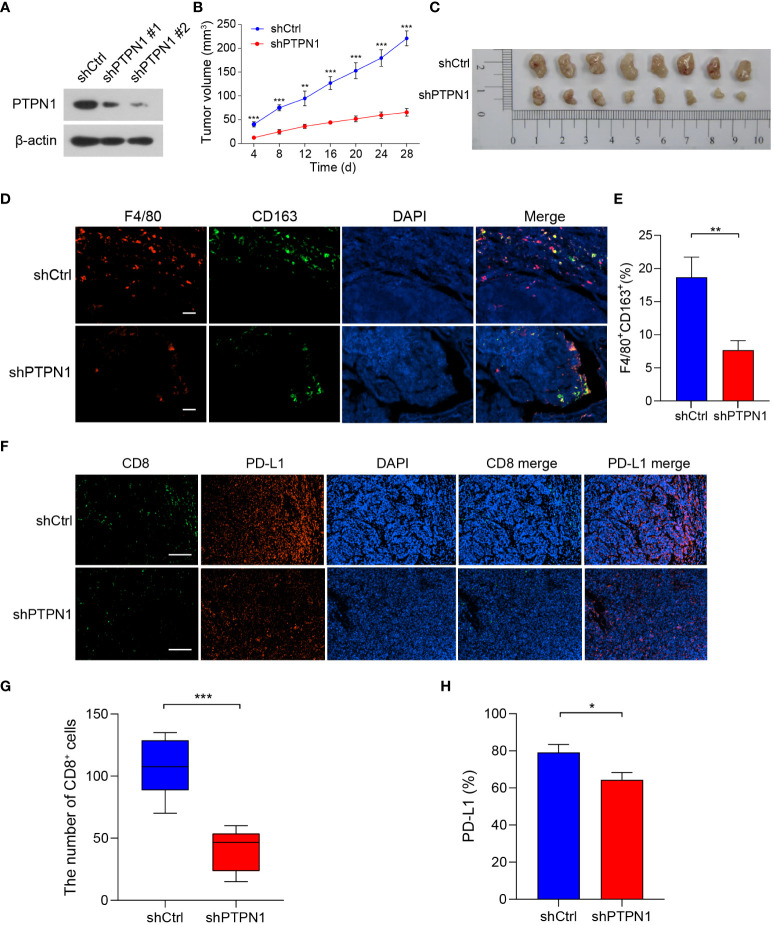
Results: The pan-cancer analysis revealed that PTPN1 was frequently up-regulated in various cancers. High PTPN1 expression was associated with poor prognosis in most cancers. Furthermore, PTPN1 expression correlated highly with the presence of tumor-infiltrating immune cells and the expression of immune checkpoint pathway marker genes in different cancers. Furthermore, PTPN1 significantly predicted the prognosis for patients undergoing immunotherapy. The results of the CCK-8 viability assay revealed that PTPN1 knockdown increased the sensitivity of MDA-MB-231 and MCF-7 cells to paclitaxel. Finally, our results demonstrated that PTPN1 was associated with immune infiltration and immune checkpoint gene expression in breast cancer.
Conclusion: PTPN1 was overexpressed in multiple cancer types and correlated with the clinical outcome and tumor immunity, suggesting it could be a valuable potential prognostic and immunological biomarker for pan-cancer.
Keywords: PTPN1; drug sensitivity; immunotherapy; pan-cancer; prognosis; tumor microenvironment.
Copyright © 2023 Zhao, Chen, Cui, Xie, Zhang, Yang and Dong.
Conflict of interest statement
The authors declare that the research was conducted in the absence of any commercial or financial relationships that could be construed as a potential conflict of interest.
Figures
Similar articles
-
Comprehensive Pan-cancer Analysis of CMPK2 as Biomarker and Prognostic Indicator for Immunotherapy.Curr Cancer Drug Targets. 2025;25(3):209-229. doi: 10.2174/0115680096281451240306062101. Curr Cancer Drug Targets. 2025. PMID: 38486392
-
Comprehensive Bioinformatics Analysis Reveals PTPN1 (PTP1B) Is a Promising Immunotherapy Target Associated with T Cell Function for Liver Cancer.J Healthc Eng. 2023 Jan 27;2023:1533794. doi: 10.1155/2023/1533794. eCollection 2023. J Healthc Eng. 2023. PMID: 36741874 Free PMC article.
-
KIF2C is a prognostic biomarker associated with immune cell infiltration in breast cancer.BMC Cancer. 2023 Apr 4;23(1):307. doi: 10.1186/s12885-023-10788-4. BMC Cancer. 2023. PMID: 37016301 Free PMC article.
-
A comprehensively prognostic and immunological analysis of actin-related protein 2/3 complex subunit 5 in pan-cancer and identification in hepatocellular carcinoma.Front Immunol. 2022 Sep 6;13:944898. doi: 10.3389/fimmu.2022.944898. eCollection 2022. Front Immunol. 2022. PMID: 36148220 Free PMC article.
-
Pan-cancer analysis of the prognostic and immunological role of GJB2: a potential target for survival and immunotherapy.Front Oncol. 2023 Jun 23;13:1110207. doi: 10.3389/fonc.2023.1110207. eCollection 2023. Front Oncol. 2023. PMID: 37427102 Free PMC article. Review.
Cited by
-
Efficient and highly reproducible production of red blood cell-derived extracellular vesicle mimetics for the loading and delivery of RNA molecules.Sci Rep. 2024 Jun 25;14(1):14610. doi: 10.1038/s41598-024-65623-y. Sci Rep. 2024. PMID: 38918594 Free PMC article.
-
Identification of Anticancer Target Combinations to Treat Pancreatic Cancer and Its Associated Cachexia Using Constraint-Based Modeling.Molecules. 2025 Jul 30;30(15):3200. doi: 10.3390/molecules30153200. Molecules. 2025. PMID: 40807373 Free PMC article.
References
-
- Bejarano L, Jordao MJC, Joyce JA. Therapeutic targeting of the tumor microenvironment. Cancer Discovery (2021) 11(4):933–59. doi: 10.1158/2159-8290.CD-20-1808 - DOI - PubMed
MeSH terms
Substances
LinkOut - more resources
Full Text Sources
Medical
Miscellaneous