

Using CADD tools to inhibit the overexpressed genes FAP, FN1, and MMP1 by repurposing ginsenoside C and Rg1 as a treatment for oral cancer
- PMID: 37936719
- PMCID: PMC10627001
- DOI: 10.3389/fmolb.2023.1248885
Using CADD tools to inhibit the overexpressed genes FAP, FN1, and MMP1 by repurposing ginsenoside C and Rg1 as a treatment for oral cancer
Abstract
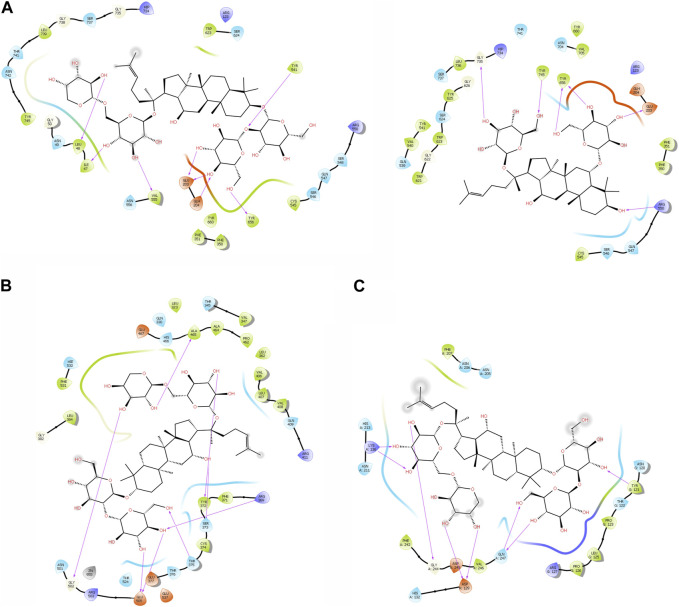
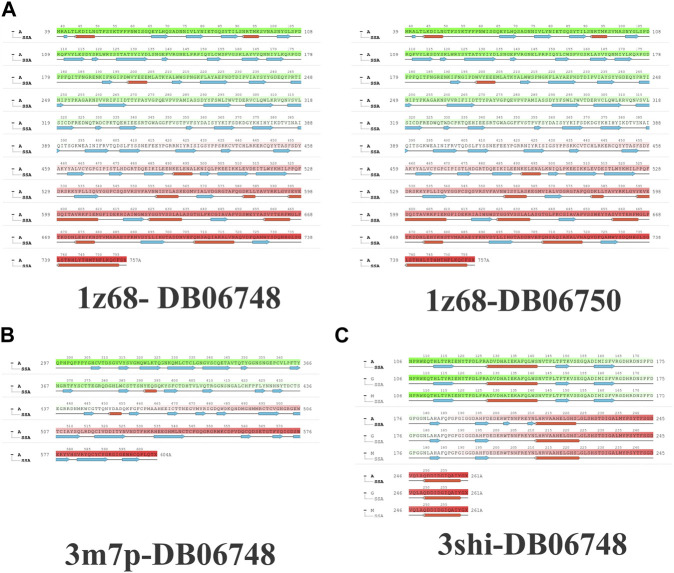
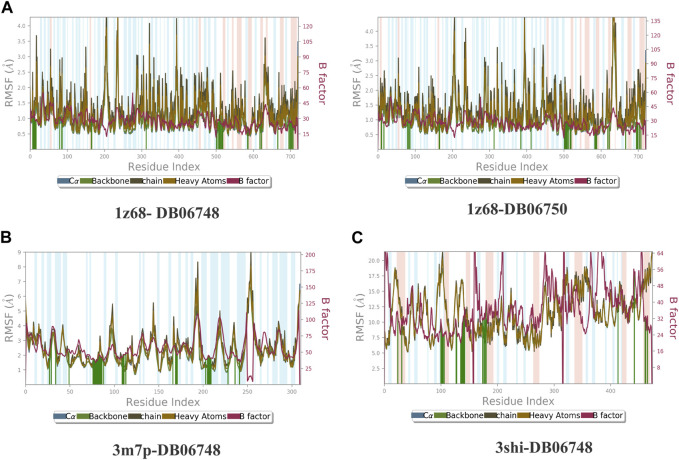
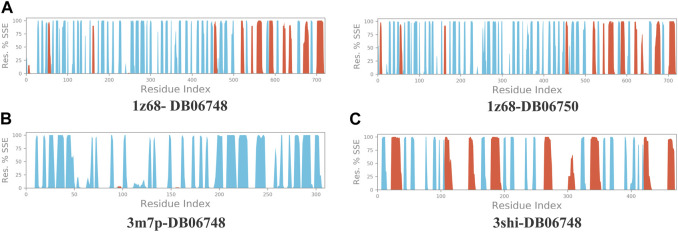
Oral cancer is one of the most common cancer types. Many factors can express certain genes that cause the proliferation of oral tissues. Overexpressed genes were detected in oral cancer patients; three were highly impacted. FAP, FN1, and MMP1 were the targeted genes that showed inhibition results in silico by ginsenoside C and Rg1. Approved drugs were retrieved from the DrugBank database. The docking scores show an excellent interaction between the ligands and the targeted macromolecules. Further molecular dynamics simulations showed the binding stability of the proposed natural products. This work recommends repurposing ginsenoside C and Rg1 as potential binders for the selected targets and endorses future experimental validation for the treatment of oral cancer.
Keywords: FAP; FN1; MMP1; ginsenoside C and Rg1; molecular docking; simulation.
Copyright © 2023 Abouelwafa, Ibrahim, El-Hadidi, Mahnashi, Owaidah, Saeedi, Attia, Georrge and Mostafa.
Conflict of interest statement
The authors declare that the research was conducted in the absence of any commercial or financial relationships that could be construed as a potential conflict of interest.
Figures
Similar articles
-
Ginsenoside Rg1 as a promising adjuvant agent for enhancing the anti-cancer functions of granulocytes inhibited by noradrenaline.Front Immunol. 2023 Feb 1;14:1070679. doi: 10.3389/fimmu.2023.1070679. eCollection 2023. Front Immunol. 2023. PMID: 36817446 Free PMC article.
-
[Effect of Clopidogrel on Plasma Protein Binding Rates of Ginsenoside Rg1].Zhongguo Zhong Xi Yi Jie He Za Zhi. 2017 Apr;37(4):480-484. Zhongguo Zhong Xi Yi Jie He Za Zhi. 2017. PMID: 30650510 Chinese.
-
Metabolite profiling of ginsenoside Rg1 after oral administration in rat.Biomed Chromatogr. 2014 Oct;28(10):1320-4. doi: 10.1002/bmc.3164. Epub 2014 Feb 26. Biomed Chromatogr. 2014. PMID: 24616108
-
New insights into the role and mechanisms of ginsenoside Rg1 in the management of Alzheimer's disease.Biomed Pharmacother. 2022 Aug;152:113207. doi: 10.1016/j.biopha.2022.113207. Epub 2022 Jun 3. Biomed Pharmacother. 2022. PMID: 35667236 Review.
-
Protective Effects and Target Network Analysis of Ginsenoside Rg1 in Cerebral Ischemia and Reperfusion Injury: A Comprehensive Overview of Experimental Studies.Cells. 2018 Dec 12;7(12):270. doi: 10.3390/cells7120270. Cells. 2018. PMID: 30545139 Free PMC article. Review.
References
-
- Chow E., Rendleman C. A., Bowers K. J., Dror R. O., Hughes D. H., Gullingsrud J., et al. (2008). Desmond performance on a cluster of multicore processors. New York, NY, USA: Columbia University.
LinkOut - more resources
Full Text Sources
Miscellaneous