. 2022 Dec 7;1(12):1156-1173.
doi: 10.1038/s44161-022-00172-z.

Tyrosine-protein kinase Yes controls endothelial junctional plasticity and barrier integrity by regulating VE-cadherin phosphorylation and endocytosis

Affiliations

Tyrosine-protein kinase Yes controls endothelial junctional plasticity and barrier integrity by regulating VE-cadherin phosphorylation and endocytosis

Yi Jin et al. Nat Cardiovasc Res. .

Abstract

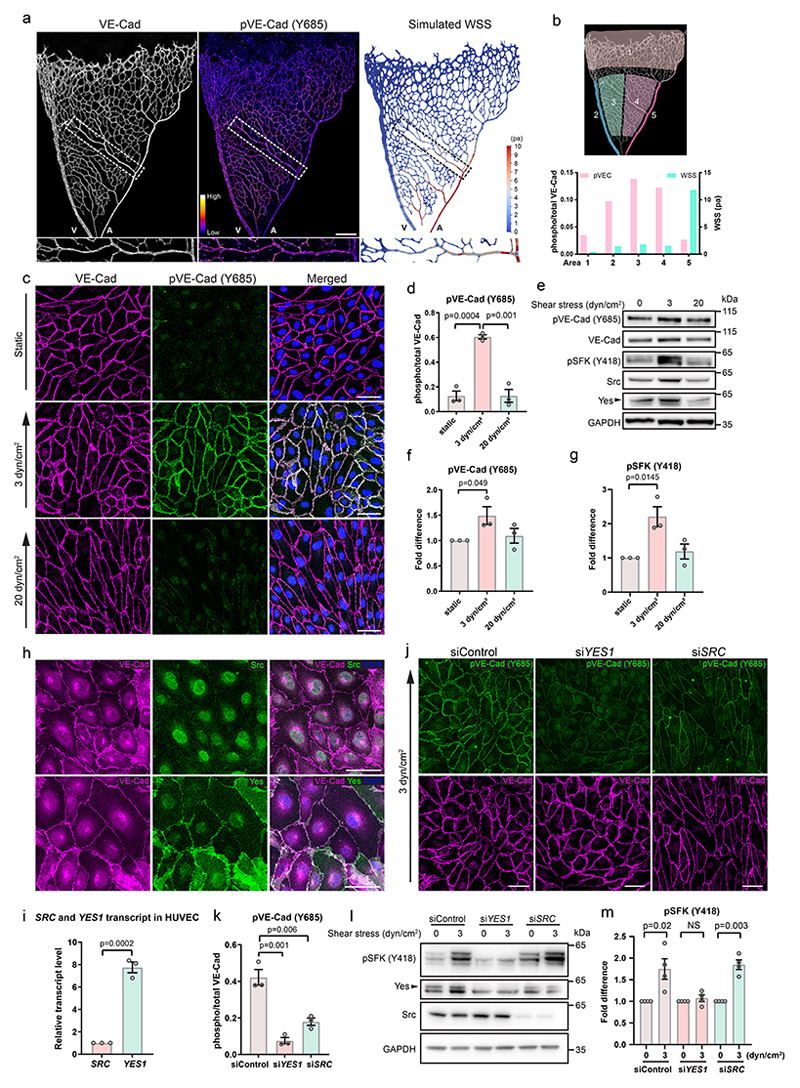
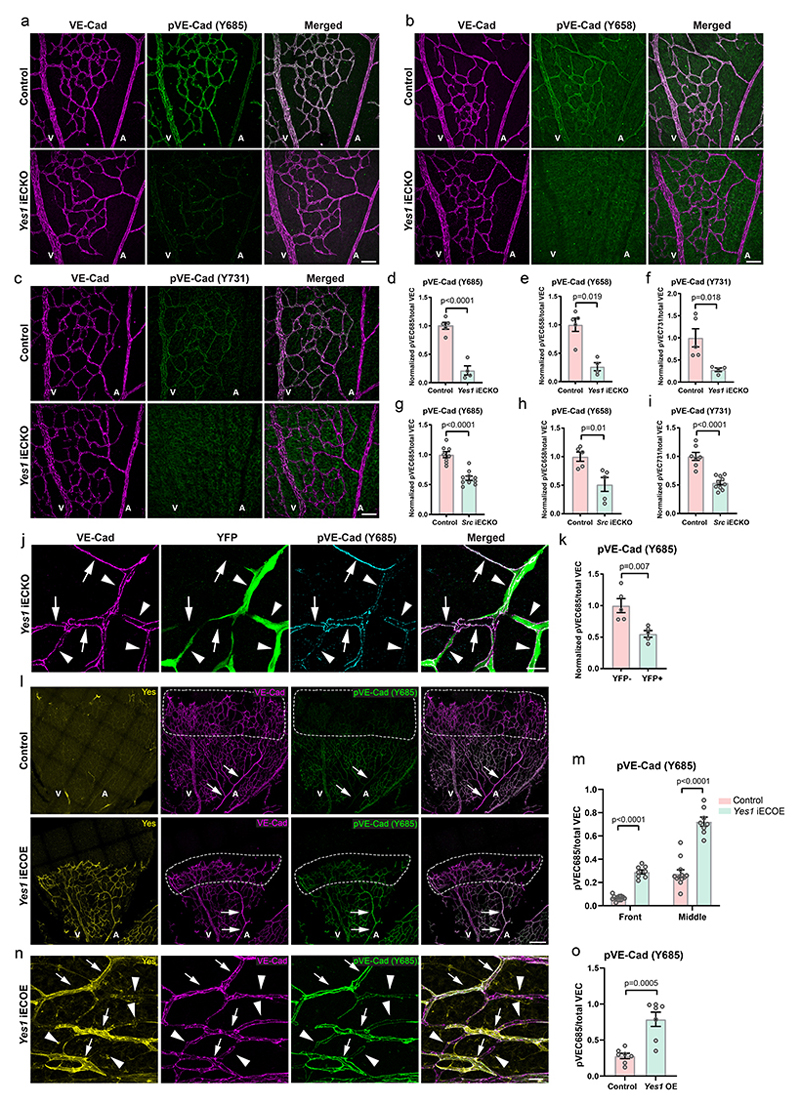
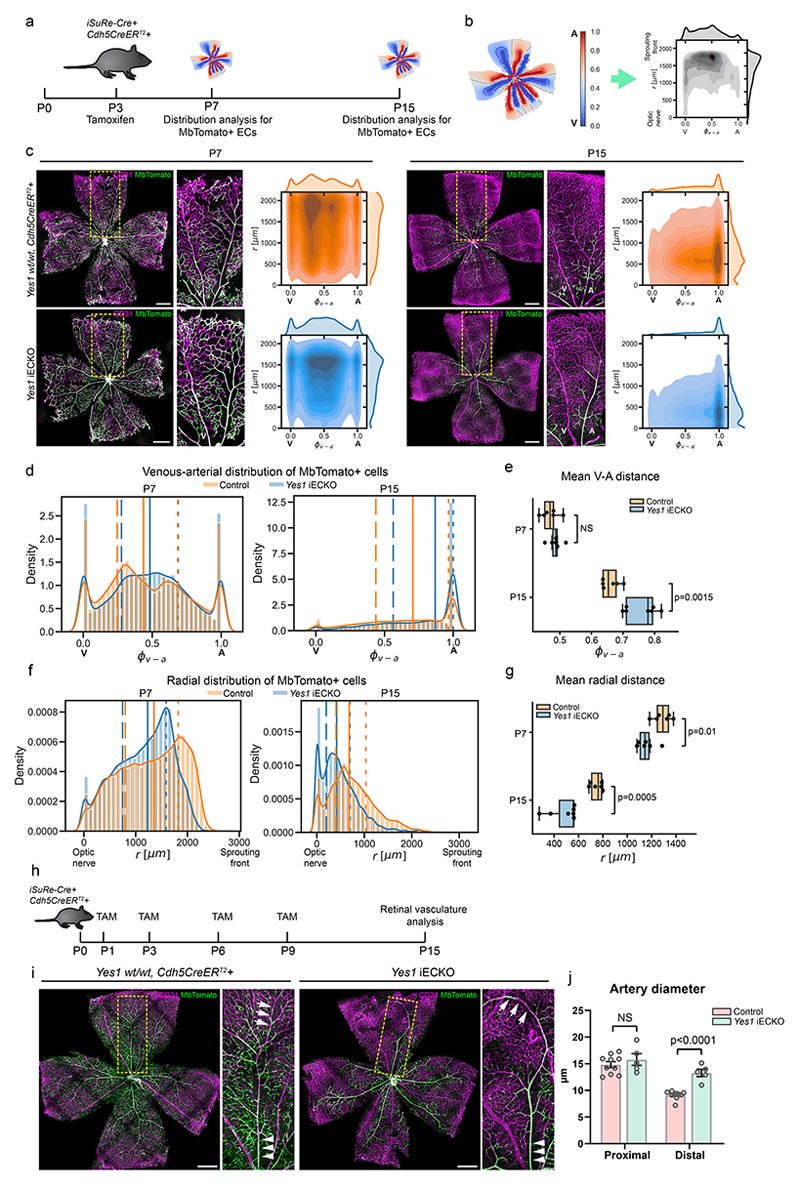
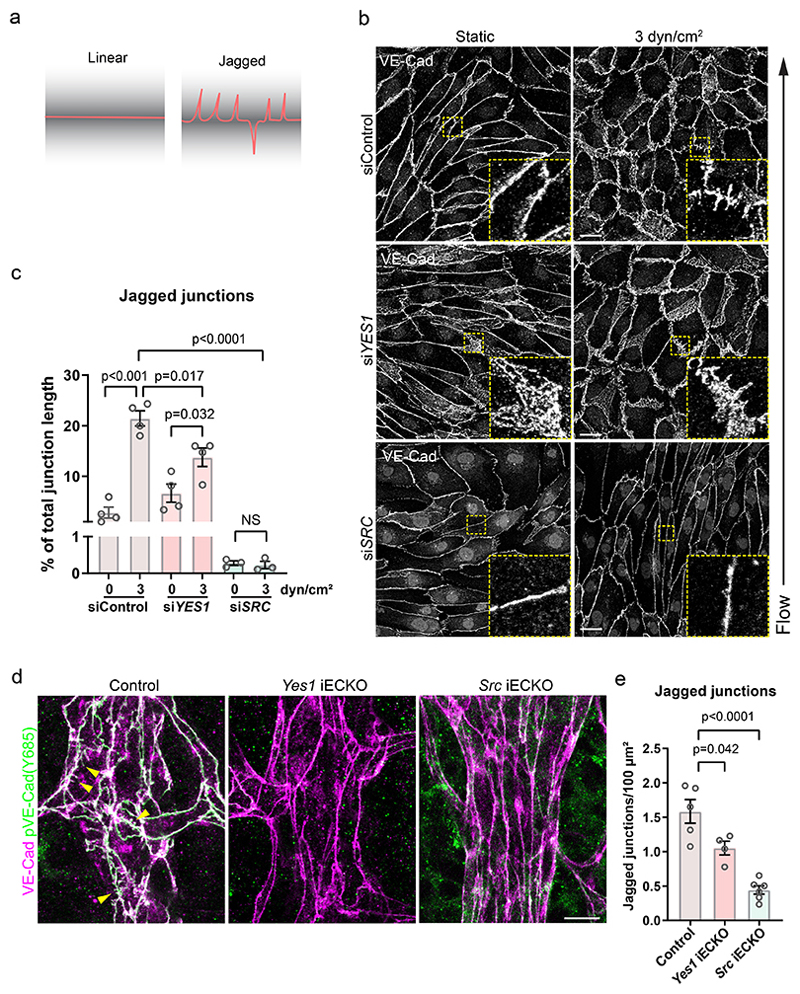
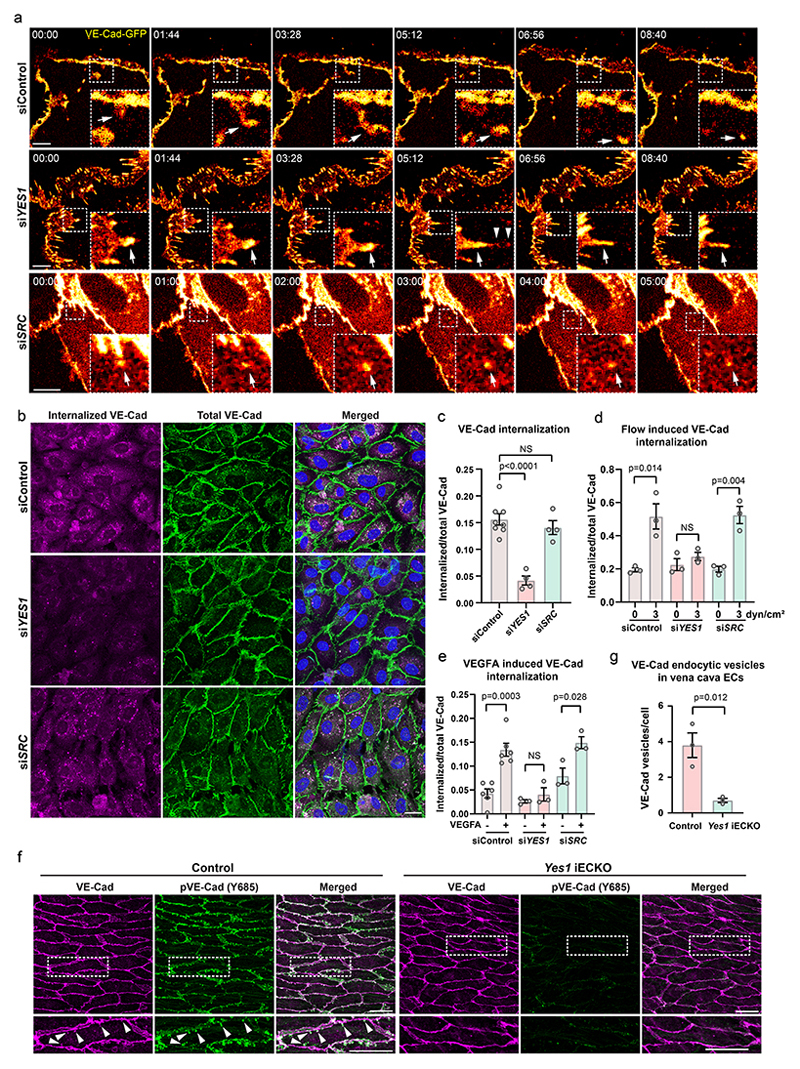
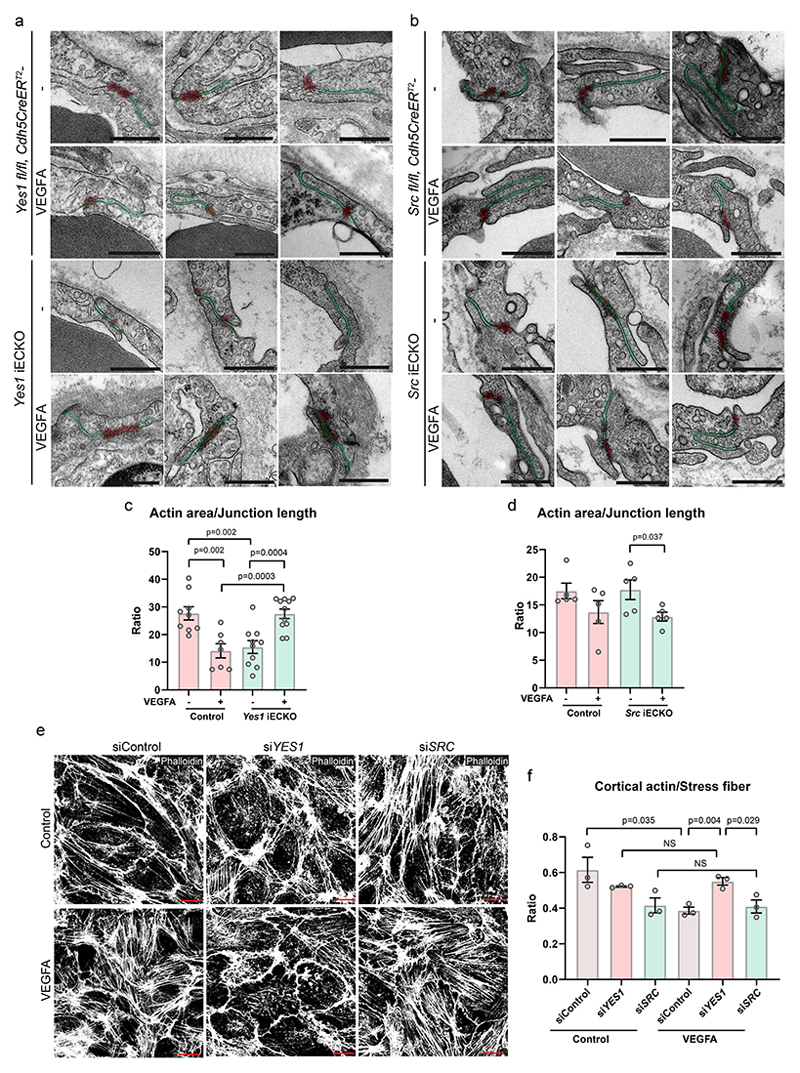
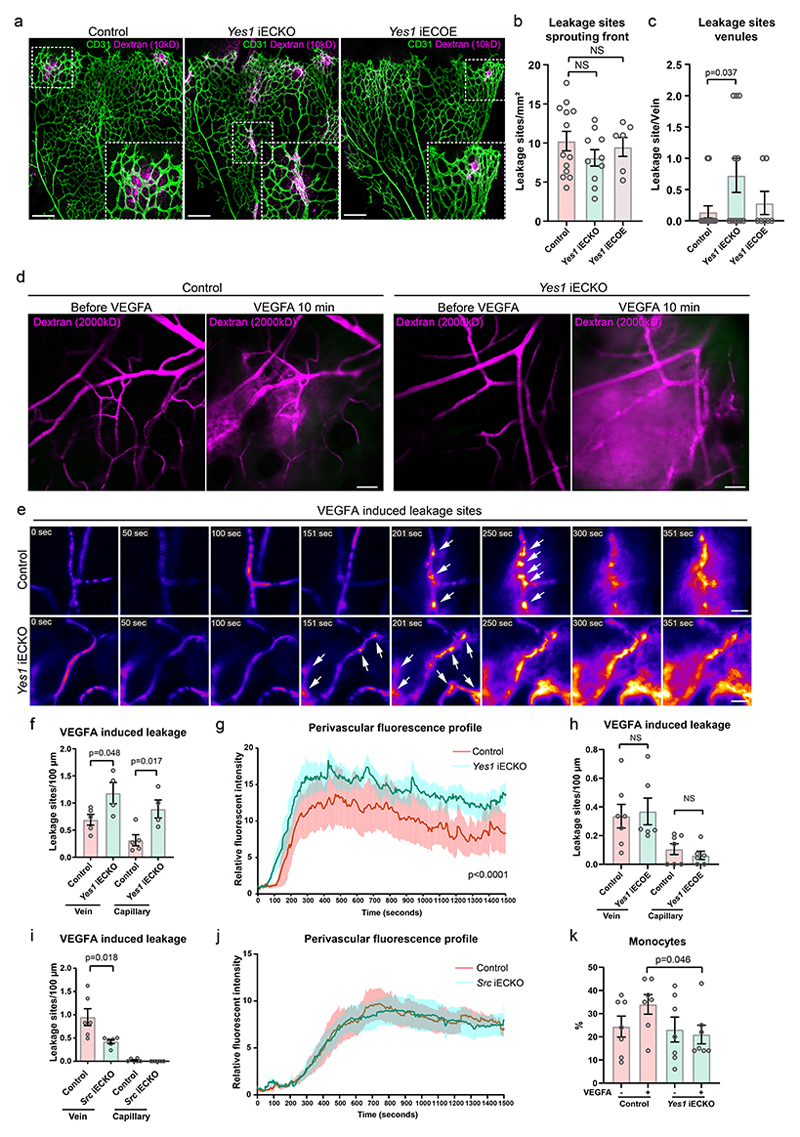
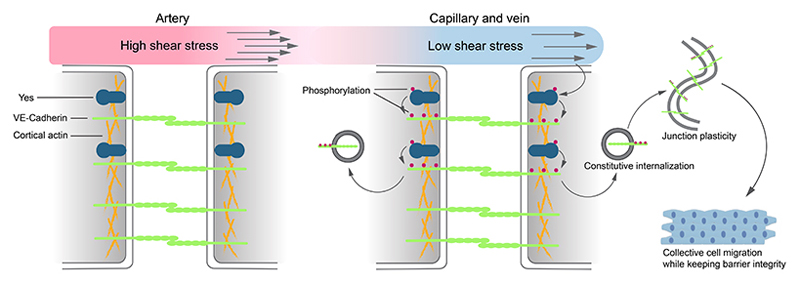
Vascular endothelial (VE)-cadherin in endothelial adherens junctions is an essential component of the vascular barrier, critical for tissue homeostasis and implicated in diseases such as cancer and retinopathies. Inhibitors of Src cytoplasmic tyrosine kinase have been applied to suppress VE-cadherin tyrosine phosphorylation and prevent excessive leakage, edema and high interstitial pressure. Here we show that the Src-related Yes tyrosine kinase, rather than Src, is localized at endothelial cell (EC) junctions where it becomes activated in a flow-dependent manner. EC-specific Yes1 deletion suppresses VE-cadherin phosphorylation and arrests VE-cadherin at EC junctions. This is accompanied by loss of EC collective migration and exaggerated agonist-induced macromolecular leakage. Overexpression of Yes1 causes ectopic VE-cadherin phosphorylation, while vascular leakage is unaffected. In contrast, in EC-specific Src-deficiency, VE-cadherin internalization is maintained, and leakage is suppressed. In conclusion, Yes-mediated phosphorylation regulates constitutive VE-cadherin turnover, thereby maintaining endothelial junction plasticity and vascular integrity.


Conflict of interest statement

Competing Interest Statement The authors declare no competing interests.

Figures

Figure 1
Figure 1. Low shear stress-induced Yes activation
(a) Whole-mount staining of VE-cadherin (left) and pY685 VE-cadherin (middle) and computer-simulated wall shear stress (WSS; right) modelling in the mouse P6 retina. An arterial branch (boxed) is shown in the enlarged pictures below. A, artery; V, vein. Scale bar, 200 μm. (b) Segmentation of the retina into five regions (upper) and plot (lower) of regional WSS levels (right Y-axis; green bars) and corresponding pY685 VE-cadherin levels (left Y-axis; pink bars) in the different regions. (c) Immunostaining of VE-cadherin (magenta) and pY685 VE-cadherin (green) in HUVECs cultured in static, 3 dyn/cm2 and 20 dyn/cm2 conditions for 24 h. Scale bars, 50 μm. (d) Ratio of integrated intensity of pVE-cadherin/total VE-cadherin; n=3 independent experiments. (e) Representative immunoblot of pY685 VE-cadherin, total VE-cadherin, pY418 SFK, Src, Yes and GAPDH (for normalization) in static or shear stress-treated HUVECs; n=3 independent experiments. (f, g) Ratios of pY685 VE-cadherin/total VE-cadherin and pY418 SFK/GAPDH normalized to static conditions, n=3 independent experiments. (h) Immunofluorescent staining to show localization of Src and Yes (green) in HUVECs; co-staining of VE-cadherin (magenta). Scale bars, 50 μm. (i) Relative expression levels of SRC and YES1 in HUVECs by qPCR. Comparison based on standard qPCR curves for Src and Yes transcripts from 10-2, 10-1, 1, 10, and100 ng RNA. n=3 independent experiments. (j) Immunofluorescence showing pY685 VE-cadherin (green) and total VE-cadherin (magenta) in HUVECs transfected with control, YES1 or SRC siRNA followed by exposure to 3 dyn/cm2 shear stress for 24 h. Scale bars, 50 μm. (k) Quantification of pY685 VE-cadherin integrated intensity normalized to total VE-cadherin. n=3 independent experiments. (l) Representative immunoblots of pY418 SFK, Yes and Src in static or shear stress (3 dyn/cm2) treated control, YES1 or SRC silenced HUVECs; n=4 independent experiments. Quantifications of pY418 SFK normalized to GAPDH in different conditions are shown in (m), n=4 independent experiments. Bar graphs show mean ± SEM; two-tailed Student’s t-test.
Figure 2
Figure 2. Yes phosphorylates VE-cadherin
(a-c) Immunofluorescence of Yes1 iECKO (Yes1 fl/fl, Cdh5CreERT2+) and control (Yes1 fl/fl, Cdh5CreERT2-) P6 retinas showing total VE-cadherin (magenta) and phosphorylated VE-cadherin (green): pY685 (a), pY658 (b) and pY731 (c). Scale bars, 50 μm. (d-f) Quantification of pVE-cadherin (Y685) (d), pVE-cadherin (658) (e) and pVE-cadherin (731) (f) levels normalized to total VE-cadherin in control and Yes1 iECKO littermate P6 retinas. Control, n=5; Yes1 iECKO, n=4. (g-i) Quantification of pVE-cadherin levels normalized to total VE-cadherin in P6 retinas of Src iECKO (Src fl/fl, Cdh5CreERT2+) and control (Src fl/fl, Cdh5CreERT2-) mice. (g) pVE-cadherin (Y685). Control, n=8; Src iECKO, n=10. (h) pVE-cadherin (Y658). Control, n=5; Src iECKO, n=5. (i) pVE-cadherin (731). Control, n=7; Src iECKO, n=10. (j) Immunofluorescence showing the correlation between levels of pY685 VE-cadherin and YFP+ Yes1-deficient ECs in a P6 retina with chimeric recombination (100 μg tamoxifen/mouse) at P3. Arrows, YFP-ECs; arrowheads, YFP+ ECs. Scale bar, 20 μm. (k) Quantification of pY685 VE-cadherin levels in YFP-and YFP+ ECs. n=5 mice. (l) Immunofluorescent images showing Yes (yellow), VE-cadherin (magenta) and pY685 VE-cadherin (green) in control (H11-STOP-Yes1-, Cdh5CreERT2+; upper panel) and inducible Yes1 overexpression model (iECOE; lower panel) retinas at P6. Arrows indicate arteries. Dashed lines indicate sprouting front. Scale bar, 200 μm. (m) Quantification of pY685 VE-cadherin in the front and middle parts of control and Yes1 iECOE retinas. Control, n=12; Yes1 iECOE, n=8. (n) Immunofluorescent staining of pY685 VE-cadherin in Yes1-overexpressing ECs in a P6 Yes1 iECOE retina with chimeric recombination. Arrows indicate ECs with Yes1 overexpression, and arrowheads indicate ECs without recombination. Scale bar, 20 μm. (o) Quantification of pY685 VE-cadherin in Yes1-overexpressing ECs and their neighboring non-recombined ECs, as shown in (n), n=7 mice. V, vein; A, artery. Bar graphs show mean ± SEM; two-tailed Student’s t-test.
Figure 3
Figure 3. Disturbed collective EC migration in Yes-deficiency
(a) Timeline for EC distribution analysis (100 μg tamoxifen/mouse at P3). (b) Schematics showing 2D maps of fluorescently labeled ECs in flat-mounted retinas. X-axis; relative distance between veins (0.0) and arteries (1.0), y-axis; distance (μm) from optic nerve to sprouting front. (c) Distribution analysis of ECs with Cdh5Cre-induced expression of MbTomato (green) in Yes1 wt/wt, iSuRe-Cre+, Cdh5CreERT2+, and Yes1 fl/fl, iSuRe-Cre+, Cdh5CreERT2+, at P7 (left) and P15 (right). CD31 (magenta) counterstaining shows all ECs. Boxed regions with veins and arteries shown enlarged (center). Distribution analysis (right) showing control (orange) and Yes1 iECKO (blue) ECs. Color density indicates average density of MbTomato+ cells in 6 retinas. V, vein; A, artery. Scale bars, 500 μm. (d) Histogram plots of vein-to-artery distribution of MbTomato+ ECs in P7 and P15 retinas. Solid lines indicate median position of total MbTomato+ ECs detected. Dashed lines indicate positions of 25% and 75% of total MbTomato+ ECs. (e) Box plot showing mean values of relative vein-to-artery distance of all MbTomato+ ECs/retina. Minima, maxima and center bounds show 25, 75 and 50 percentiles; whiskers show minimum and maximum values. n=7 retinas for P15 Yes1 iECKO, n=6 for all other groups; two-sided Welch's t-test. (f) Histogram plots showing radial distribution of MbTomato+ ECs in P7 and P15 retinas. Solid lines indicate median position of total MbTomato+ ECs detected. Dashed lines indicate positions of 25% and 75% of total MbTomato+ ECs. (g) Box plot showing mean values of radial distance from optic nerve of all MbTomato+ ECs /retina. n=7 retinas for P15 Yes1 iECKO, n=6 for all other groups. Minima, maxima, center bounds and whiskers definitions and statistical analyses as in e. (h) Timeline showing repeated tamoxifen administration. (i) P15 retinas from Yes1 wt/wt, iSuRe-Cre+, Cdh5CreERT2+, and Yes1 fl/fl, iSuRe-Cre+, Cdh5CreERT2+ littermates showing Cdh5Cre-induced expression of MbTomato+, Yes1-deficient ECs (green); counterstaining for CD31 (magenta). Scale bars, 500 μm. (j) Average artery diameter in proximal and distal positions (relative to optical nerve) in P15 retinas as shown in (i). Control, n=10 retinas; Yes1 iECKO, n=5 retinas. Bar graphs show mean ± SEM; two-tailed Student’s t-test.
Figure 4
Figure 4. Adherens junction morphology
(a) Schematic outline of linear and jagged adherens junction morphology based on VE-cadherin immunostaining. (b) Immunostaining of VE-cadherin in HUVECs transfected with control or YES1 or SRC siRNA and cultured under static or 3 dyn/cm2 flow conditions. Boxed regions show representatives of altered VE-cadherin morphologies, magnified to the lower right. Scale bars, 20 μm. (c) Quantification of jagged junctions as shown in (b), given as junction length in % of total. Bar graphs show mean ± SEM with individual data points. siControl; n=4, siYES1; n=4, siSRC; n=3 independent experiments. (d) Adherens junction morphology in veins of retinal vessels at P6 illustrated by immunostaining of VE-cadherin (magenta) and pY685 VE-cadherin (green). Yellow arrowheads indicate jagged junctions. Scale bar, 10 μm. (e) Quantification of jagged structures/100 μm2 VE-cadherin area in control (Yes1 fl/fl, Cdh5CreERT2-), Yes1 iECKO and Src iECKO mouse retinas. Control; n=5 mice, Yes1 iECKO; n=4 mice, Src iECKO; n=6 mice. Bar graphs show mean ± SEM; two-tailed Student’s t-test.
Figure 5
Figure 5. Yes is required for VE-cadherin internalization
(a) Static images from live imaging time series of HUVECs expressing GFP-tagged VE-cadherin. Boxed areas highlight examples of different dynamics of VE-cadherin and are shown enlarged in the lower right. Arrows in the upper (siControl) and lower (siSRC) panel indicate internalized VE-cadherin vesicles. Arrows in the middle panel (siYES1) indicate a junctional VE-cadherin cluster, while arrowheads show detachment and internalization of VE-cadherin from the cluster. Timestamps are min:sec. Scale bars, 10 μm. (b) Antibody feeding assay showing internalized VE-cadherin (magenta) in control, siYES1 and siSRC HUVECs co-stained with total VE-cadherin (green) and nuclei (blue). Scale bar, 20 μm. (c) Quantification of internalized/total VE-cadherin in control, siYES1 and siSRC static HUVECs. Control; n=8, siYES1; n=4, siSRC; n=4 independent experiments. (d) Quantification of flow-induced internalized/total VE-cadherin in control, siYES1 and siSRC HUVECs. n=3 independent experiments. Representative images are shown in Extended Data Fig. 12a. (e) Quantification of internalized/total VE-cadherin in control, siYES1 and siSRC HUVECs treated with VEGFA or not for 3 h. n=3 independent experiments. Representative images are shown in Extended Data Fig. 12b. (f) Internalized VE-Cadherin vesicles at the juxtamembrane regions in mouse vena cava ECs shown by immunostaining of VE-Cad (magenta) and pY685 VE-Cad (green). Cells highlighted in boxes are shown enlarged below. Arrowheads indicate internalized VE-Cad vesicles. Scale bars, 20 μm. (g) Quantification of internalized VE-Cad vesicles/cells in control and Yes1 iECKO vena cava ECs. n=3 mice for each group. Bar graphs show mean ± SEM; two-tailed Student’s t-test.
Figure 6
Figure 6. Cell-cell junctions and actin organization
(a, b) Endothelial junctions in control, Yes1 iECKO or Src iECKO mouse ear dermis vessels after intradermal injection of saline or VEGFA164, visualized by transmission electron microscopy. Endothelial cell junction length is highlighted in green, and electron dense junctional area (cortical actin-rich domain) is in red. Scale bars, 500 nm. (c) Quantification of actin area/junction length in control (Yes1 fl/fl, Cdh5CreERT2-) and Yes1 iECKO mice. Saline-treated control mice, n=9; VEGFA-treated control mice, n=7; saline-treated Yes1 iECKO mice, n=10; VEGFA-treated Yes1 iECKO mice, n=11. 2-40 junctions were analyzed in each mouse. (d) Quantification of electron dense junctional area/junction length in control (Src fl/fl, Cdh5CreERT2-) and Src iECKO mice. n=5 mice for each group. (e) Staining with phalloidin shows the arrangement of actin stress fibers and cortical actin in HUVECs treated with control, Yes or Src siRNA followed by VEGFA stimulation for 15 min. Scale bars, 20 μm. (f) Quantification of the integrated intensity of actin stress fibers normalized to cell numbers in control, Yes- or Src-silenced HUVECs. n=3 independent experiments. Bar graphs show mean ± SEM; two-tailed Student’s t-test.
Figure 7
Figure 7. Yes-deficiency leads to loss of vascular integrity
(a) Perivascular leakage of 10 kD dextran (magenta) in fixed P6 retinas of control (Yes1 fl/fl, Cdh5CreERT2-), Yes1 iECKO and Yes1 iECOE mice. Vessels shown by CD31 immunostaining (green). Boxed leakage sites shown in magnification. Scale bars, 200 μm. (b) Quantification of leakage sites at the sprouting front. Control, n=9 retinas; Yes1 iECKO, n=10 retinas; Yes1 iECOE, n=6 retinas, two-tailed Student’s t-test. (c) Quantification of leakage sites in retinal veins. Control, n=14 veins/ 9 retinas; Yes1 iECKO, n=11 veins/10 retinas; Yes1 iECOE, n=7 veins/ 6 retinas; two-tailed Student’s t-test. (d) Static images from intravital time series imaging of mouse ear dermal vessels before and 10 min after intradermal VEGFA injection. Leakage visualized by the perivascular accumulation of 2000 kDa dextran (magenta). Scale bars, 50 μm. (e) Heat map images of individual leakage sites (arrows) after VEGFA injection. Scale bars, 20 μm. (f) Quantification of individual leakage sites at veins and capillaries in control and Yes1 iECKO mice induced by VEGFA. Control, n=5 mice, Yes1 iECKO, n=4 mice. (g) VEGFA-induced changes in perivascular fluorescence intensity measured at 2-second intervals for 1500 seconds. Curves show mean values of 8 leakage sites from 5 control mice and 10 sites from 4 Yes1 iECKO mice; two-way ANOVA. (h) Quantification of individual leakage sites at veins and capillaries of control (H11-STOP-Yes1-, Cdh5CreERT2+) and Yes1 iECOE mice induced by VEGFA. Control, n=7 mice, Yes1 iECOE, n=6 mice. (i) Quantification of individual leakage sites at veins and capillaries in the ear dermis of control (Src fl/fl, Cdh5CreERT2-) and Src iECKO mice after VEGFA injection. Control, n=6 mice, Src iECKO, n=6 mice. (j) VEGFA-induced changes in perivascular fluorescence intensity measured at 2-second intervals for 1500 seconds. Control, n=6 mice, Src iECOE, n=6 mice; two-way ANOVA. (k) FACS analysis of monocyte/macrophage (CD11b+, LY6G-) extravasation in peritoneal fluid from control and Yes1 iECKO mice 24 h after i.p. injection with saline or VEGFA, n=7 mice for each group. Bar graphs show mean ± SEM; two-tailed Student’s t-test.
Figure 8
Figure 8. Low flow-induced Yes kinase activity controls EC junctions
Yes protein-tyrosine kinase is inactive under the high shear stress in arteries. Low shear stress level in capillaries and veins activate Yes kinase activity, which phosphorylates the adherens junction protein VE-cadherin at Y658, Y685 and Y731. Phosphorylation of VE-cadherin is required for its constitutive internalization which confers EC junctional plasticity. Junctional plasticity is essential for collective EC migration during angiogenesis as well as for maintaining vascular barrier integrity.

References

    1. Claesson-Welsh L, Dejana E, McDonald DM. Permeability of the Endothelial Barrier: Identifying and Reconciling Controversies. Trends Mol Med. 2021;27:314–331. - PMC - PubMed
    1. Komarova YA, Kruse K, Mehta D, Malik AB. Protein Interactions at Endothelial Junctions and Signaling Mechanisms Regulating Endothelial Permeability. Circ Res. 2017;120:179–206. - PMC - PubMed
    1. Wettschureck N, Strilic B, Offermanns S. Passing the Vascular Barrier: Endothelial Signaling Processes Controlling Extravasation. Physiol Rev. 2019;99:1467–1525. - PubMed
    1. Nitta T, et al. Size-selective loosening of the blood-brain barrier in claudin-5-deficient mice. J Cell Biol. 2003;161:653–660. - PMC - PubMed
    1. Honkura N, et al. Intravital imaging-based analysis tools for vessel identification and assessment of concurrent dynamic vascular events. Nat Commun. 2018;9:2746. - PMC - PubMed