. 2023 Dec 1;130(6):1492-1507.
doi: 10.1152/jn.00525.2022. Epub 2023 Nov 8.

Ventral posterolateral and ventral posteromedial thalamocortical neurons have distinct physiological properties

Affiliations

Ventral posterolateral and ventral posteromedial thalamocortical neurons have distinct physiological properties

Carleigh Studtmann et al. J Neurophysiol. .

Abstract

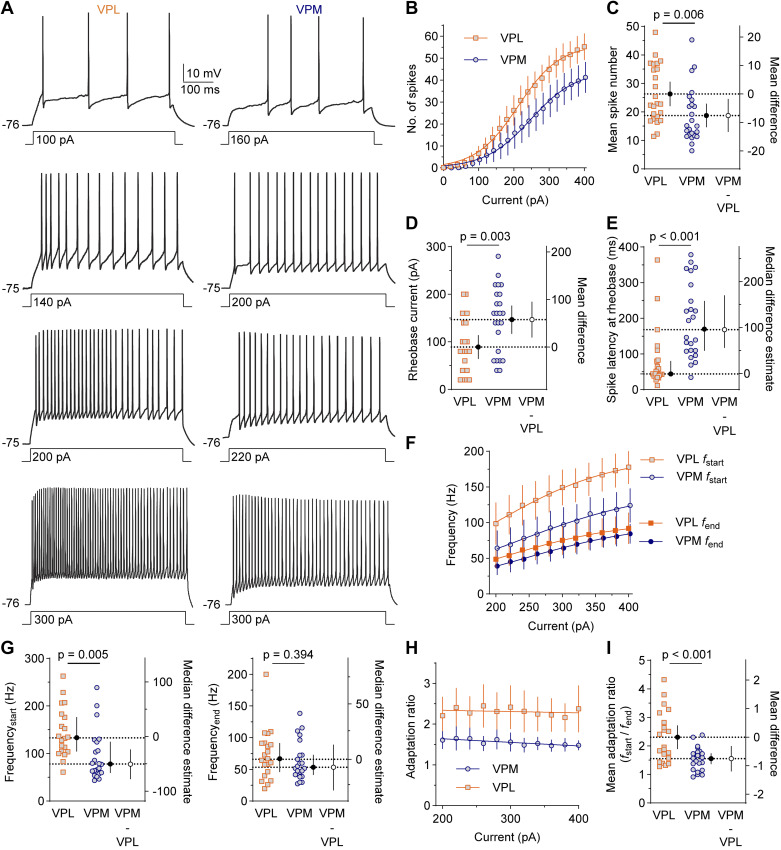
Somatosensory information is propagated from the periphery to the cerebral cortex by two parallel pathways through the ventral posterolateral (VPL) and ventral posteromedial (VPM) thalamus. VPL and VPM neurons receive somatosensory signals from the body and head, respectively. VPL and VPM neurons may also receive cell type-specific GABAergic input from the reticular nucleus of the thalamus. Although VPL and VPM neurons have distinct connectivity and physiological roles, differences in their functional properties remain unclear as they are often studied as one ventrobasal thalamus neuron population. Here, we directly compared synaptic and intrinsic properties of VPL and VPM neurons in C57Bl/6J mice of both sexes aged P25-P32. VPL neurons showed greater depolarization-induced spike firing and spike frequency adaptation than VPM neurons. VPL and VPM neurons fired similar numbers of spikes during hyperpolarization rebound bursts, but VPM neurons exhibited shorter burst latency compared with VPL neurons, which correlated with larger sag potential. VPM neurons had larger membrane capacitance and more complex dendritic arbors. Recordings of spontaneous and evoked synaptic transmission suggested that VPL neurons receive stronger excitatory synaptic input, whereas inhibitory synapse strength was stronger in VPM neurons. This work indicates that VPL and VPM thalamocortical neurons have distinct intrinsic and synaptic properties. The observed functional differences could have important implications for their specific physiological and pathophysiological roles within the somatosensory thalamocortical network.NEW & NOTEWORTHY This study revealed that somatosensory thalamocortical neurons in the VPL and VPM have substantial differences in excitatory synaptic input and intrinsic firing properties. The distinct properties suggest that VPL and VPM neurons could process somatosensory information differently and have selective vulnerability to disease. This work improves our understanding of nucleus-specific neuron function in the thalamus and demonstrates the critical importance of studying these parallel somatosensory pathways separately.

Keywords: somatosensory thalamus; synaptic transmission; thalamocortical neuron; ventral posterolateral nucleus; ventral posteromedial nucleus.


Conflict of interest statement

No conflicts of interest, financial or otherwise, are declared by the authors.

Figures

None
Graphical abstract
Figure 1.
Figure 1.
VPL neurons have a larger AHP period than VPM neurons. A: a somatosensory CT circuit diagram shows glutamatergic (+) and GABAergic (−) neuron connectivity as well as somatosensory inputs via the trigeminothalamic tract (TT) and spinothalamic tract (ST). B: cell locations for each current clamp recording in Figs. 1, 2, and 3 as well as Tables 1 and 2 were mapped on an image from a horizontal rat brain atlas (DV −3.1 mm relative to bregma). C: representative traces show AP trains elicited by depolarizing current injections. D: the recording periods above black lines in C were expanded and overlaid. E: recording periods above solid and dashed lines in D were expanded to show AP shape (solid box) and AHP period (dashed box). F–I: sample sizes are: VPL, n = 23 cells from 14 mice (7 females, 7 males); VPM: n = 23 cells from 13 mice (7 females, 6 males). Error bars are 95% CI. Estimation plots show data points for all cells with the group mean (black circle) plotted on the left axis, and the MD (open circle) plotted on the right axis. Welch’s t test statistics for AP amplitude (F), AP half-width (G), AHP amplitude (H), and AHP duration (I) are in Table 1. AHP, afterhyperpolarization; AP, action potential; CT, corticothalamic; VPL, ventral posterolateral; VPM, ventral posteromedial.
Figure 2.
Figure 2.
VPL neurons exhibit greater spike output and spike adaptation during depolarization. A: traces show four representative spike trains elicited by 500-ms depolarizing current injections. B–I: sample sizes are: VPL, n = 24 cells from 15 mice (8 females, 7 males); VPM, n = 24 cells from 15 mice (8 females, 7 males). Error bars are 95% CI. Estimation plots show data points for individual cells with group mean or median (black circle) plotted on the left axis and the mean or median difference (open circle) plotted on the right axis. B: mean spike number was plotted vs. current injection amplitude. The main effect of cell type across current injections was analyzed by a mixed-effects model [F(1, 46) = 8.446]. C: an estimation plot shows mean spike number averaged across current injections. D and E: estimation plots show mean rheobase current (Welch’s t test, t = 3.962, df = 31.90) and median spike latency at rheobase (Mann–Whitney U test, U = 87). F and G: mean spike frequency at the start (fstart) and end (fend) of the spike train and the mean spike adaptation ratio (H and I) were plotted and analyzed as described for B and C. Main effects: fstart, F(1, 41) = 8.835; fend, F(1, 41) = 0.741; adaptation ratio, F(1, 41) = 12.90. CI, confidence interval; VPL, ventral posterolateral; VPM, ventral posteromedial.
Figure 3.
Figure 3.
VPM neurons have shorter burst latency and greater sag potential. A: traces show two representative bursts elicited by 500-ms hyperpolarizing current injections. Boxed insets are the recording periods above the gray lines. B–H: samples sizes are: VPL, n = 22 cells from 15 mice (7 females, 8 males); VPM, n = 22 cells from 15 mice (8 females, 7 males). Error bars are 95% CI. Estimation plots show data points for each cell with group mean (black circle) plotted on the left axis and the mean difference (open circle) plotted on the right axis. B: mean spike number per burst was plotted vs. current injection. The main effect of cell type across all current injections was analyzed by a mixed-effects model [F(1, 42) = 0.943] and illustrated as an estimation plot of the mean spike number averaged across current injections. C: recording periods above solid and dashed lines were expanded to illustrate burst latency (solid box) and sag potential (dashed box). D: sag potential was plotted and analyzed as described for B, main effect: F(1, 41) =14.59. E: an estimation plot shows burst latency for the minimal current injection to elicit a burst (Welch’s t test, t = 3.605, df = 37.24). F: sag potential was plotted vs. burst latency for each cell and fit by linear regression (Pearson’s coefficients: VPL, r = −0.73; VPM, r = −0.75). G: the mean change in membrane potential across all current injections was analyzed as in B [main effect: F(1, 43) = 2.994] and is shown in an estimation plot. H: an estimation plot shows sag potential of −30 mV responses (Welch’s t test, t = 3.586, df = 40.98). CI, confidence interval; VPL, ventral posterolateral; VPM, ventral posteromedial.
Figure 4.
Figure 4.
VPM neurons have larger dendritic arbors. A: dendrite reconstructions are shown for three representative biocytin-labeled VPL and VPM neurons. Scale bar: 100 µm. B–F: samples sizes are: VPL, n = 18 cells from 12 mice (5 males, 7 females); VPM, n = 18 cells, 12 mice (6 males, 6 females). Error bars are 95% CI. Estimation plots show data points for individual cells with group mean (black circle) plotted on the left axis and the mean difference (open circle) plotted on the right axis. B: the mean number of Sholl intersections was plotted vs. distance from the soma. Mixed-effects analysis determined the main effect of cell type, P = 0.049, F(1, 34) = 4.163, and interaction effect, P < 0.001, F(26, 883) = 5.436. Estimation plots show the maximum Sholl intersections (C) at shell radius 59 µm (Bonferroni t test, t = 3.012, df = 33.34) and total dendrite length (D; Welch’s t test, t = 3.703, df = 33.99). Dendrite number (E) and dendrite length (F) were plotted for each branch order and analyzed by two-way ANOVA. Main effects: E: P = 0.010, F(1, 34) = 7.401; F: P = 0.026, F(1, 34) = 5.446. Interaction: E: P = 0.001, F(7, 238) = 3.527; F: P = 0.017, F(7, 238) = 2.509. Šídák tests: E: *P = 0.041, t = 2.958, df = 29.78; F: *P = 0.043, t = 2.917, df = 32.68. CI, confidence interval; VPL, ventral posterolateral; VPM, ventral posteromedial.
Figure 5.
Figure 5.
The frequency and amplitude of sEPSCs and mEPSCs were lower in VPM neurons. A: cell locations for each sEPSC recording were mapped on a horizontal rat brain atlas image. Representative traces show sEPSC voltage-clamp recordings (B), ensemble averages of all sEPSCs from a single neuron (C), and traces from C normalized to the sEPSC peak (D). For all plots, error bars are 95% CI, data points for each cell with group mean or median (black circle) are plotted on the left axis, and mean or median difference (open circle) is plotted on the right axis. E–G: sample sizes are: VPL, n = 17 cells from 11 mice (5 females, 6 males); VPM, n = 19 cells from 12 mice (7 females, 5 males). Data were compared by Welch’s t tests: frequency (E; t = 4.043, df = 23.87), amplitude (F; t = 5.443, df = 21.24), and decay time (G; t = 3.033, df = 31.63). H: cell locations for each mEPSC recording were mapped on a horizontal rat brain atlas image. Representative traces show mEPSC voltage-clamp recordings (I), ensemble averages of all mEPSCs from a single neuron (J), and traces from C normalized to mEPSC peak (K). L–N: sample sizes are: VPL, n = 20 cells from 13 mice (7 females, 6 males); VPM, n = 20 cells from 12 mice (6 females, 6 males). Estimation plots show mESPC frequency (L; Mann–Whitney U test, U = 87), amplitude (M; Welch’s t test, t = 3.246, df = 34.25), and decay time (N; Welch’s t tests, t = 3.953, df = 30.43). CI, confidence interval; mEPSCs, miniature excitatory postsynaptic currents; sEPSCs, spontaneous excitatory postsynaptic currents; VPL, ventral posterolateral; VPM, ventral posteromedial.
Figure 6.
Figure 6.
Evoked EPSCs in VPM neurons have lower amplitude and prolonged decay time. Cell locations and representative traces are shown for recordings of electrically stimulated sensory (A) and CT EPSCs (B). Sample sizes for sensory EPSCs are: VPL, n = 16 cells from 10 mice (5 females, 5 males); VPM: n = 16 cells from 12 mice (7 females, 5 males). Sample sizes for CT EPSCs are: VPL, n = 16 cells from 10 mice (5 females, 5 males); VPM, n = 16 cells from 10 mice (5 females, 5 males). All error bars are 95% CI. C: sensory EPSC amplitude for each cell (gray) and the group medians were plotted vs. stimulus intensity. D: the mean CT EPSC amplitude was plotted vs. stimulus intensity. E: the amplitude of EPSCs evoked at the lowest stimulation level for each cell was plotted with group mean (black line) for sensory (left axis) and CT (right axis) inputs. Two-way ANOVA: main effect of cell type, F(1, 60) = 16.28, P < 0.001; interaction, F(1, 60) = 14.69, P < 0.001. Šídák tests: sensory, t = 5.563; CT, t = 0.143. F: EPSC decay times for each cell were plotted with group mean (black line). Two-way ANOVA: main effect of cell type, F(1, 60) = 19.32, P < 0.001; interaction, F(1, 60) = 3.344, P = 0.072. Šídák tests: sensory, t = 1.815; CT, t = 4.401. Representative pairs of evoked EPSCs are shown for sensory EPSCs (G; 100-ms interval) and CT EPSCs (H; 50-ms interval). The mean paired-pulse ratios were plotted vs. EPSC interval. Two-way ANOVA: main effect of cell type: sensory, F(1, 30) = 2.310, P = 0.139; CT, F(1, 30) = 0.441, P = 0.512. CI, confidence interval; CT, corticothalamic; EPSCs, excitatory postsynaptic currents; VPL, ventral posterolateral; VPM, ventral posteromedial.
Figure 7.
Figure 7.
VPM neurons have higher sIPSC amplitude than VPL neurons. Cell locations for each sIPSC (A) and mIPSC (H) recording were mapped on a horizontal rat brain atlas image. Representative traces show voltage-clamp recordings of sIPSCs (B) and mIPSCs (I) as well as ensemble averages of all sIPSCs (C) and mIPSCs (J) from one neuron. D: traces from C were normalized to sIPSC peak. For all plots, error bars are 95% CI, data points for each cell with group mean (black circle) are plotted on the left axis, mean difference (open circle) is plotted on the right axis, and data were compared by Welch’s t tests. E–G: sample sizes are: VPL, n = 21 cells from 14 mice (8 females, 6 males); VPM, n = 20 cells from 13 mice (7 females, 6 males). Estimation plots show sIPSC frequency (E; t = 1.970, df = 31.76), amplitude (F; t = 3.155, df = 38.85), and decay time (G; t = 0.188, df = 38.99). K–M: sample sizes are: VPL, n = 22 from 15 mice (7 females, 8 males); VPM, n = 22 cells from 16 mice (7 females, 9 males). Estimation plots show mIPSC frequency (K; t = 0.456, df = 41.42), amplitude (L; t = 0.156, df = 41.55), and decay time (M; t = 0.810, df = 41.95). CI, confidence interval; mIPSCs, miniature inhibitory postsynaptic currents; sIPSCs, spontaneous inhibitory postsynaptic current; VPL, ventral posterolateral; VPM, ventral posteromedial.

References

    1. Beenhakker MP, Huguenard JR. Neurons that fire together also conspire together: is normal sleep circuitry hijacked to generate epilepsy? Neuron 62: 612–632, 2009. doi:10.1016/j.neuron.2009.05.015. - DOI - PMC - PubMed
    1. Wolff M, Vann SD. The cognitive thalamus as a gateway to mental representations. J Neurosci 39: 3–14, 2019. doi:10.1523/JNEUROSCI.0479-18.2018. - DOI - PMC - PubMed
    1. Fanselow EE, Nicolelis MA. Behavioral modulation of tactile responses in the rat somatosensory system. J Neurosci 19: 7603–7616, 1999. doi:10.1523/JNEUROSCI.19-17-07603.1999. - DOI - PMC - PubMed
    1. Fernandez LMJ, Luthi A. Sleep spindles: mechanisms and functions. Physiol Rev 100: 805–868, 2020. doi:10.1152/physrev.00042.2018. - DOI - PubMed
    1. Brecht M, Sakmann B. Whisker maps of neuronal subclasses of the rat ventral posterior medial thalamus, identified by whole-cell voltage recording and morphological reconstruction. J Physiol 538: 495–515, 2002. doi:10.1113/jphysiol.2001.012334. - DOI - PMC - PubMed

Publication types

LinkOut - more resources