

Accuracy of Crit-Line® monitors in predicting hematocrit and change in blood volume of dogs during hemodialysis
- PMID: 37937475
- PMCID: PMC10658494
- DOI: 10.1111/jvim.16917
Accuracy of Crit-Line® monitors in predicting hematocrit and change in blood volume of dogs during hemodialysis
Abstract
Background: Ultrafiltration (UF) is an extracorporeal technique for treating fluid overload and is monitored with noninvasive blood volume monitors.
Hypothesis/objectives: The primary objective was to determine the accuracy of Crit-Line® III and IV noninvasive blood volume monitors to estimate canine packed cell volume (PCV) and changes in blood volume during UF. A secondary aim was to determine accuracy of targeted ultrafiltration rates (UFR) compared to calculated delivered UFR.
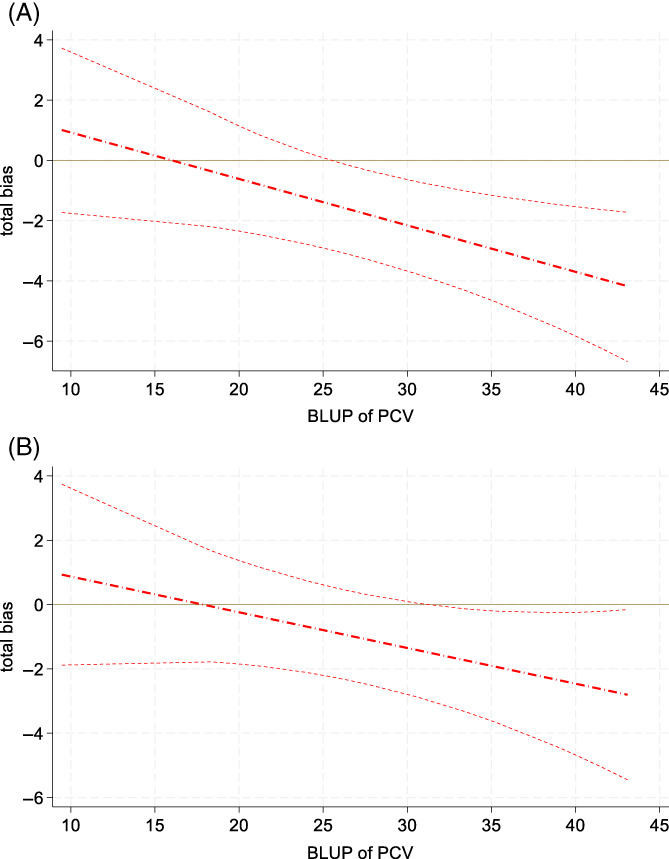
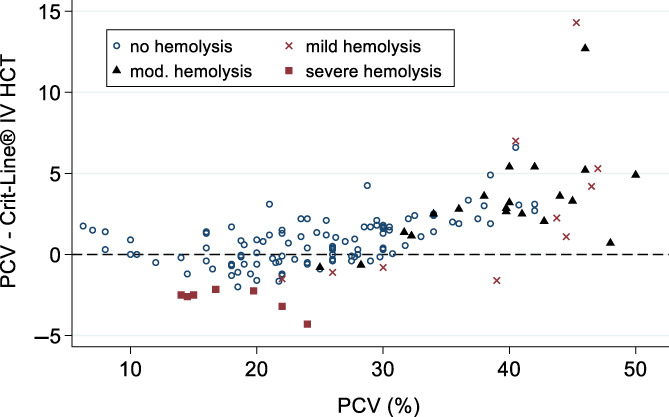
Methods: An ex vivo study with a single Phoenix® X36 platform and canine packed red blood cells (pRBC) was performed. Through dilution and UF, clinically applicable PCV values were obtained and compared to Crit-Line® hematocrit (Hct). Blood volume was constantly measured and compared to targeted UFR. Systematic and proportional bias were calculated using a Bayes method.
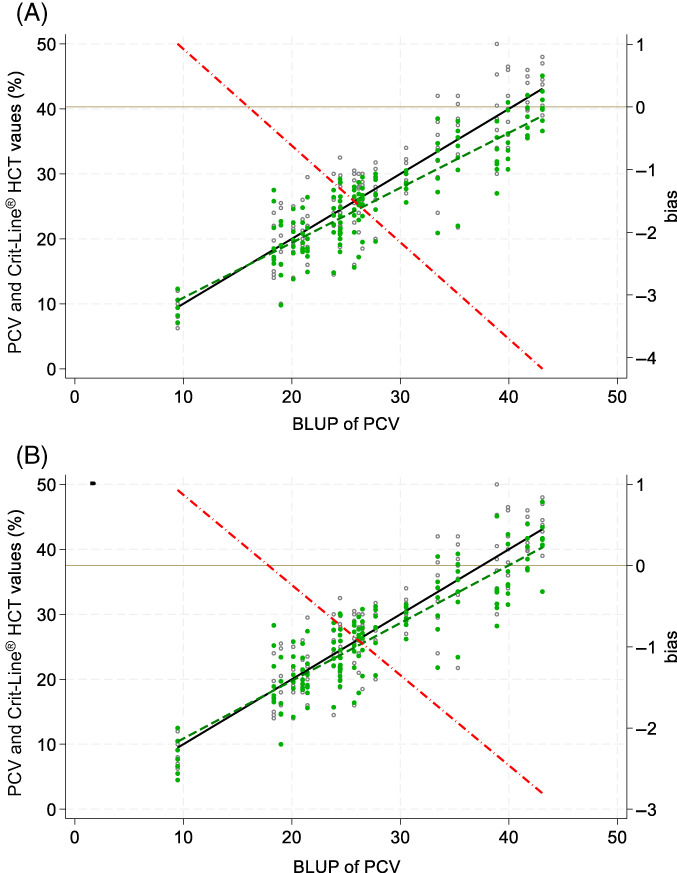
Results: Crit-Line® III and IV reported Hct was significantly lower than PCV (n = 140, median 26%, range, 8%-50%) when PCV was >25% and >30%, respectively. Crit-Line® III and IV calculated change in blood volume (ΔBV%) was significantly different from measured blood volume changes at ΔBV% ±20% and >-20%, respectively. Comparing targeted and delivered UFR (mL/h), less than targeted UFR was removed at UFR100 through UFR400 and UFR0 adding volume.
Conclusions and clinical importance: Crit-Line® III and IV monitors provide accurate estimates of canine PCV and UF volume change within specific ranges and are useful in monitoring canine UF and hemodialysis. Veterinary hemodialysis services should evaluate individual machines for UFR inaccuracies, which can meaningfully affect small animals.
Keywords: acute kidney injury; fluid overload; intradialytic morbid event; packed cell volume; ultrafiltration.
© 2023 The Authors. Journal of Veterinary Internal Medicine published by Wiley Periodicals LLC on behalf of American College of Veterinary Internal Medicine. This article has been contributed to by U.S. Government employees and their work is in the public domain in the USA.
Conflict of interest statement
George E. Moore serves as Consulting Editor for Experimental Design and Statistics for the Journal of Veterinary Internal Medicine. He was not involved in review of this manuscript. No other authors have a conflict of interest.
Figures


References
-
- Cavanagh AA, Sullivan LA, Hansen BD. Retrospective evaluation of fluid overload and relationship to outcome in critically ill dogs. J Vet Emerg Crit Care. 2016;26:578‐586. - PubMed
-
- Cowgill LD, Francey T. Hemodialysis and extracorporeal blood purification. In: DiBartola SP, ed. Fluid, Electrolyte, and Acid‐Base Disorders in Small Animal Practice. 4th ed. St. Louis, MO: Elsevier; 2012:680‐713.
-
- Bouchard J, Soroko SB, Chertow GM, et al. Fluid accumulation, survival and recovery of kidney function in critically ill patients with acute kidney injury. Kidney Int. 2009;76:422‐427. - PubMed
-
- Lorenzin A, Neri M, Garzotto F, Ronco C. Solute and water kinetics in continuous therapies. In: Ronco C, Bellomo R, Kellum JA, et al., eds. Critical Care Nephrology. 3rd ed. St. Louis, MO: Elsevier; 2019:1000‐1005.
-
- Langston C. Hemodialysis. In: Bartges J, Polzin D, eds. Nephrology and Urology of Small Animals. 1st ed. Oxford, UK: Wiley‐Blackwell; 2011:255‐278.
MeSH terms
LinkOut - more resources
Full Text Sources
Medical
