. 2023 Nov 8;8(21):e164694.
doi: 10.1172/jci.insight.164694.

Inflammation-induced TRIM21 represses hepatic steatosis by promoting the ubiquitination of lipogenic regulators

Affiliations

Inflammation-induced TRIM21 represses hepatic steatosis by promoting the ubiquitination of lipogenic regulators

Kostas C Nikolaou et al. JCI Insight. .

Abstract

Nonalcoholic steatohepatitis (NASH) is a leading cause for chronic liver diseases. Current therapeutic options are limited due to an incomplete mechanistic understanding of how steatosis transitions to NASH. Here we show that the TRIM21 E3 ubiquitin ligase is induced by the synergistic actions of proinflammatory TNF-α and fatty acids in livers of humans and mice with NASH. TRIM21 ubiquitinates and degrades ChREBP, SREBP1, ACC1, and FASN, key regulators of de novo lipogenesis, and A1CF, an alternative splicing regulator of the high-activity ketohexokinase-C (KHK-C) isoform and rate-limiting enzyme of fructose metabolism. TRIM21-mediated degradation of these lipogenic activators improved steatosis and hyperglycemia as well as fructose and glucose tolerance. Our study identifies TRIM21 as a negative regulator of liver steatosis in NASH and provides mechanistic insights into an immunometabolic crosstalk that limits fatty acid synthesis and fructose metabolism during metabolic stress. Thus, enhancing this natural counteracting force of steatosis through inhibition of key lipogenic activators via TRIM21-mediated ubiquitination may provide a therapeutic opportunity to treat NASH.

Keywords: Diabetes; Hepatology.


Conflict of interest statement

Conflict of interest: MS is an SAB member and MM is an employee and Scientific Advisory Board (SAB) member of Alnylam Pharmaceuticals.

Figures

Figure 1
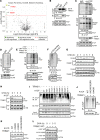
Figure 1. TRIM21 interacts, ubiquitinates, and degrades A1CF in hepatocytes.
(A) Volcano plot of proteomics data, depicting protein data P values versus fold change (FC). Normalized total ion current (TIC) was used as a quantitative method to plot the volcano. Proteomics data were produced from 3 liver replicates, 1 mouse/replicate. All data points above threshold (red line) are calculated with t test significance P < 0.05 and Benjamini-Hochberg multiple-test correction. All significant proteins associated with these points are listed in Supplemental Table 1. Highlighted are TRIM21 and RBM47, a known A1CF interactor. (B) Coimmunoprecipitation (Co-IP) experiments to validate the endogenous A1CF and TRIM21 interaction in mouse livers. (C and D) Ubiquitination (Ub) assay determining either K63-linked Ub-specific or total Ub of endogenous A1CF in mouse liver (C) or HepG2 cells (D); ubiquitination assay shown in D was performed in HepG2 cells. (E) Total A1CF ubiquitination levels in Hepa 1–6 cells cotransfected with A1CF and either TRIM21 WT or its ligase-dead (LD) form after MG132 (0.5 μM) treatment for 6 hours. Input levels indicate A1CF and TRIM21 expression. (F) Endogenous A1CF ubiquitination levels in HepG2 cells transfected with si-control or siTrim21. (G and H) Half-life measurements of endogenous A1CF in HepG2 cells (G), or overexpressed A1CF in Hepa 1–6 cells (H), cotransfected with TRIM21 WT or its LD form and treated with cycloheximide (CHX, 100 μg/mL) for the indicated time. (I and J) A1CF ubiquitination assays to identify the A1CF ubiquitination site in Hepa 1–6 cells cotransfected with either TRIM21 and A1CF (WT), single mutants (I), or double ubiquitination mutant (J), that were MG132 treated for 6 hours. (K) A1CF expression in Hepa 1–6 cells cotransfected with TRIM21 and A1CF-WT or indicated mutants. (L) Half-life measurements of A1CF in Hepa 1–6 cells cotransfected with TRIM21 and A1CF-WT or K302R mutant, treated with CHX for the indicated time intervals. ACTIN was used as a loading control.
Figure 2
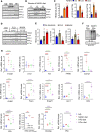
Figure 2. TRIM21 expression is induced in steatohepatitis.
(A and B) Western blots showing the expression of indicated proteins in livers of mice fed a normal diet (ND), high-fat (HFD, 16 weeks), or high-fructose diet (HFru, 8 weeks) (A) or a NASH diet for the indicated periods (B), n = 3 replicates/group, 1 mouse/replicate). (C) Western blot signal quantification of B by densitometry. (D) Western blot of indicated proteins from liver biopsies of individuals without steatosis (Ctrl, n = 4), simple steatosis (FLD, n = 5), or NASH (n = 5). (E) Western blot signal quantification of D by densitometry. (F) Endogenous A1CF ubiquitination levels from livers of mice fed a chow (ND) or NASH diet for 32 mice weeks (n = 2 replicates per group, 1 mouse/replicate). (G) Relative mRNA levels of indicated genes in livers of mice fed with normal (ND), NASH diet (32 weeks), HFD (16 weeks), or HFru diet (8 weeks), n = 8 mice/group. The KHK splicing analysis is calculated as the ratio of KHK-C isoform expression in relation to total KHK in livers of mice fed ND or NASH diets at the indicated time points (n = 3 replicates/group, 1 mouse/replicate). In all statistical plots, data are expressed as mean ± SD; ****P < 0.0001; ***P < 0.001; **P < 0.01; *P < 0.05. n represents number of replicates, 1 mouse/replicate. For C, E, and G, the statistical analysis was carried out by 1-way ANOVA with Sidak’s post hoc analysis.
Figure 3
Figure 3. TNF and fatty acids, ER- and oxidative stress induce TRIM21 in hepatocytes.
(A and B) Immunoblot analysis of TRIM21 and A1CF expression in HepG2 cells stimulated with either TNF-α (20 ng/mL) (A) or with TNF-α and fatty acids (B) (0.5 mM mixture of oleic and palmitic acid, FA+TNF) for the indicated time. (C and D) Endogenous A1CF ubiquitination levels in HepG2 cells stimulated for 48 hours with either TNF-α (C) or with TNF-α and FA (D). (E) Endogenous A1CF ubiquitination levels in HepG2 cells challenged with TNF-α and FA for 72 hours and transfected with si-Trim21 or Scramble (control) for 48 hours. Input levels show TRIM21-knockdown efficiency and A1CF levels. (F) Ubiquitination assay determining total and K63-linked endogenous A1CF ubiquitination in liver extracts from mice challenged with LPS (5 mg/kg) for the indicated time points (n = 2 livers pooled per time point). (G) Expression levels of the indicated proteins in HepG2 cells stimulated with TNF-α (20 ng/mL) for 48 hours in the presence of inhibitors for NF-κB (10 μM, BAY-11) or TAK1 (1 μM, 5z-7-oxozeaenol) (n = 2 replicates per time point). (H) Expression levels of indicated proteins in HepG2 cells that were pretreated with the JNK inhibitor SP600125 (5 μM) and stimulated with TNF-α (20 ng/mL) for 24 hours; vehicle (DMSO) was used as control. (I and J) Expression levels of indicated proteins in HepG2 cells stimulated with 1 mM hydrogen peroxide (H2O2) (I) or with 0.2 μM thapsigargin (J) for the indicated time points (n = 3 replicates per time point each).
Figure 4
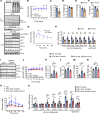
Figure 4. Hepatic TRIM21 protects from fructose-induced steatosis via degradation of A1CF.
(A) Levels of total and K63-linked endogenous A1CF ubiquitination and input protein expression in liver extracts of Ad-Trim21 or Ad-Ctrl C57BL/6N mice fed a HFru diet for 4 weeks (n = 3 mice per group). (B–H) Random plasma blood glucose (B), plasma insulin levels (C), liver weight (D), liver triglyceride (TG) (E), plasma TG (F), fructose-tolerance test (3 g/kg fructose) (G), and relative hepatic mRNA expression of indicated genes (n = 7 mice per group) (H) from mice indicated as in A. (I) Western blot analysis of indicated proteins in livers of GalNAc-siA1cf and control injected 12-week-old C57BL/6N mice fed HFru diet for 4 weeks (n = 3 mice/group). (J) Blood glucose from C57BL/6N control mice fed a normal diet (ND) or GalNAc-siA1cf–injected and control mice fed a HFru diet for 4 weeks. (K–P) Plasma insulin (K), plasma TG (L), hepatic TG levels (M), liver weight (N), fructose tolerance test (3 g/kg Fru) (O), (blue asterisks. ND versus HFru diet control; black, ND versus HFru GalNAc-siA1cf; red asterisks, HFru control versus HFru GalNAc-siA1cf) and relative hepatic mRNA expression of indicated metabolic genes (P) from mice indicated as in J. Mice per group for BG: Ad-Ctrl (n = 7), Ad-Trim21 (n = 8); for JP: ND (n = 5), controls or GalNAc-siA1cf in HFru diet group (n = 6 each). n represents number of replicates, 1 mouse/replicate. In all statistical plots, data are expressed as mean ± SD; ****P < 0.0001; ***P < 0.001; **P < 0.01; *P < 0.05. Statistical analysis for B, G, J, and O was carried out by 2-way ANOVA with Sidak’s post hoc analysis; for CF and H by t test; and for K–N and P by 1-way ANOVA with Sidak’s post hoc analysis.
Figure 5
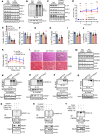
Figure 5. TRIM21 improves steatosis in NASH through inhibition of de novo lipogenesis and fructose metabolism.
(A and B) Western blot analysis of indicated proteins (A) and total A1CF ubiquitination (B) from livers of mice fed a NASH diet for 20 weeks and injected with Ad-Trim21 or control adenovirus. (C) Western blot analysis of indicated proteins from livers of mice fed a NASH diet for 20 weeks and injected with GalNAc-siA1cf or control (n = 3). (D) Plasma blood glucose from C57BL/6N mice fed a NASH diet for 20 weeks and injected with Ad-Ctrl, Ad-Trim21, or GalNAc-siA1cf. Black asterisks, Ad-Trim21 versus GalNAc-siA1cf; red, Ctrl versus GalNAc-siA1cf; orange, Ctrl versus Ad-trim21. (E–L) Plasma insulin (E), NEFA (F), TG (G), liver TG (H), liver weight (I), ratios of liver/body weight (J), fructose-tolerance test (K), and H&E and Oil Red O (ORO) staining of liver sections (L) from mice indicated as in D. (M) Western blot analysis of indicated lipogenesis genes in livers of mice indicated as in A. (N–Q) Endogenous ubiquitination of SREBP1 (N), ChREBP (O), ACC (P), and FASN (Q) in livers of mice indicated as in A (n = 2). (RT) Ubiquitination assays in Hepa 1–6 cells cotransfected with TRIM21 WT or its ligase-dead (LD) form and SREBP1 (R), ChREBP (S), and FASN (T). Input shows the expression levels of the indicated proteins. Scale bars: 50 μm. Mice/group for DK: n = 6 for controls and n = 7 for Ad-Trim21 or GalNAc-siA1cf. n represents number of replicates, 1 mouse/replicate. In all statistical plots, data are expressed as mean ± SD; ****P < 0.0001; ***P < 0.001; **P < 0.01; *P < 0.05. Statistical analysis for D and K was carried out by 2-way and for EJ by 1-way ANOVA with Sidak’s post hoc analysis.
Figure 6
Figure 6. TRIM21 silencing exacerbates steatosis in NASH.
(A) Immunostaining using anti-TRIM21 in liver sections from Ad-shTrim21 or Ad-Ctrl C57BL/6N mice fed a NASH diet for 30 weeks. (B and C) Relative hepatic mRNA expression of Trim21 (B), and A1cf and Khk (C). (D) Western blot analysis of indicated proteins (n = 3 mice per group). (EI) Liver weight (E), ratios of liver/body weight (F), liver TG (G), H&E and Oil Red O staining of liver sections (H), and immunoblot analysis of indicated lipogenesis genes (I) (n = 3 mice per group) from mice indicated as in A. (J–N) Endogenous ubiquitination of SREBP1 (J), ChREBP (K), ACC (L), FASN (M), and A1CF (N) from liver extracts from mice indicated as in A (n = 2). (O) Relative mRNA expression of de novo lipogenesis and glycolysis genes from mice indicated as in A. Scale bars: 50 μm. n represents number of replicates, 1 mouse/replicate. In all statistical plots, data are expressed as the mean ± SD; ****P < 0.0001; ***P < 0.001; **P < 0.01; *P < 0.05. Statistical analysis for B, C, E–G, and O were carried out by 1-way ANOVA with Sidak’s post hoc analysis, n = 6 mice per group.

References

    1. Tilg H, et al. NAFLD and diabetes mellitus. Nat Rev Gastroenterol Hepatol. 2017;14(1):32–42. doi: 10.1038/nrgastro.2016.147. - DOI - PubMed
    1. Targher G, et al. Nonalcoholic fatty liver disease and chronic vascular complications of diabetes mellitus. Nat Rev Endocrinol. 2018;14(2):99–114. doi: 10.1038/nrendo.2017.173. - DOI - PubMed
    1. Tilg H, et al. Non-alcoholic fatty liver disease: the interplay between metabolism, microbes and immunity. Nat Metab. 2021;3(12):1596–1607. doi: 10.1038/s42255-021-00501-9. - DOI - PubMed
    1. Huang DQ, et al. Global epidemiology of NAFLD-related HCC: trends, predictions, risk factors and prevention. Nat Rev Gastroenterol Hepatol. 2021;18(4):223–238. doi: 10.1038/s41575-020-00381-6. - DOI - PMC - PubMed
    1. Younossi ZM, et al. Global epidemiology of nonalcoholic fatty liver disease-Meta-analytic assessment of prevalence, incidence, and outcomes. Hepatology. 2016;64(1):73–84. doi: 10.1002/hep.28431. - DOI - PubMed

Publication types