. 2024 Feb;72(2):300-321.
doi: 10.1002/glia.24475. Epub 2023 Nov 8.

Impaired cortical neuronal homeostasis and cognition after diffuse traumatic brain injury are dependent on microglia and type I interferon responses

Affiliations

Impaired cortical neuronal homeostasis and cognition after diffuse traumatic brain injury are dependent on microglia and type I interferon responses

Jonathan M Packer et al. Glia. 2024 Feb.

Abstract

Neuropsychiatric complications including depression and cognitive decline develop in the years after traumatic brain injury (TBI), negatively affecting quality of life. Microglial and type 1 interferon (IFN-I) responses are associated with the transition from acute to chronic neuroinflammation after diffuse TBI in mice. Thus, the purpose of this study was to determine if impaired neuronal homeostasis and increased IFN-I responses intersected after TBI to cause cognitive impairment. Here, the RNA profile of neurons and microglia after TBI (single nucleus RNA-sequencing) with or without microglia depletion (CSF1R antagonist) was assessed 7 dpi. There was a TBI-dependent suppression of cortical neuronal homeostasis with reductions in CREB signaling, synaptogenesis, and synaptic migration and increases in RhoGDI and PTEN signaling (Ingenuity Pathway Analysis). Microglial depletion reversed 50% of TBI-induced gene changes in cortical neurons depending on subtype. Moreover, the microglial RNA signature 7 dpi was associated with increased stimulator of interferon genes (STING) activation and IFN-I responses. Therefore, we sought to reduce IFN-I signaling after TBI using STING knockout mice and a STING antagonist, chloroquine (CQ). TBI-associated cognitive deficits in novel object location and recognition (NOL/NOR) tasks at 7 and 30 dpi were STING dependent. In addition, TBI-induced STING expression, microglial morphological restructuring, inflammatory (Tnf, Cd68, Ccl2) and IFN-related (Irf3, Irf7, Ifi27) gene expression in the cortex were attenuated in STINGKO mice. CQ also reversed TBI-induced cognitive deficits and reduced TBI-induced inflammatory (Tnf, Cd68, Ccl2) and IFN (Irf7, Sting) cortical gene expression. Collectively, reducing IFN-I signaling after TBI with STING-dependent interventions attenuated the prolonged microglial activation and cognitive impairment.

Keywords: TBI; cognitive dysfunction; inflammation; interferon type I; microglia; stimulator of interferon genes.


Conflict of interest statement

Author Disclosures: The authors have no financial conflicts of interest to 9disclose.

Figures

Fig. 1
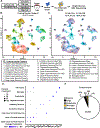
Fig. 1. RNA profiles of cells in the cortex 7 days after TBI
A) Adult C57BL/6 mice were provided diets formulated with either vehicle (Veh) or PLX5622 (PLX) for 7 d. Mice were uninjured (Con) or were subjected to mFPI (TBI). Mice were maintained on vehicle or PLX diet for the duration of the experiment (14 d). At 7 dpi, the cortex was microdissected, pooled (3 mice per group) and nuclei were collected. Nucleus RNA profiles were determined 7 dpi by snRNA-seq. B) UMAP plots show 25 specific subsets of cortical cells based on expression of cell-specific genes. C) UMAP plot with the distribution of cells based on the four treatments groups at 7 dpi. D) Cortical nuclei clusters were identified based on cell specific gene expression: upper layer neurons (Cux1 &Cux2), layer 4 neurons (Rorb), deep layer neurons (Foxp2), excitatory neurons (Slc17a7), inhibitory neurons (Gad1&2), oligodendrocytes (Mag), endothelia (Flt1), microglia (Csf1r), and astrocytes (Slc1a3). E) Dot plot shows relative expression of genes used to differentiate the cortical nuclei clusters. F) Representative percentages of each cell type are shown. Clustering and differential expression were determined using Seurat in R. Samples for each group were pooled (n=3).
Fig. 2
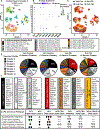
Fig. 2. Cortical neuronal clusters and RNA profiles 7 dpi were influenced by microglia
Continuing with the snRNA-seq experiment outlined in Fig.1A, neuronal clustering and profiles were determined. A) UMAP plots show 15 subsets of cortical neurons sub-clustered using Syt1 expression. B) Neuronal clusters represented based on expression of cell specific genes. C) UMAP plot with the distribution of neurons based on the four treatments groups at 7 dpi. D) Syt1+ cortical nuclei clusters of neurons were sub-clustered based on cell specific gene expression: upper layer neurons (Cux1&Cux2), layer 4 neurons (Rorb), deep layer neurons (Foxp2), excitatory neurons (Slc17a7), inhibitory neurons I (Adarb2, Gad1&2), and inhibitory neurons II (Gad1&2). E) Pie charts of percentages of clusters of the four treatment groups at 7 dpi. F) Top genes from each representative cluster are shown (p-adj <.05). G) IPA of canonical pathways of neuronal clusters (NC) 0–6, and 12 (p-adj<.05, z>2). Clustering and differential expression were determined using Seurat in R. Pooled samples for 3 replicates.
Fig. 3
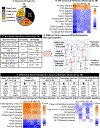
Fig. 3. Neuronal RNA profiles and pathways in the cortex 7 dpi were influenced by microglia
Continuing with the snRNA-seq experiment outlined in Fig.1A, neuronal clustering and profiles were determined A) Percentages of each neuron sub-type are shown. B) IPA (Canonical Pathways) of differentially expressed genes within all neuronal groups between TBI-Veh and Con-Veh (p-adj <.05). C) IPA (Master Regulators) of differentially expressed genes within all neuronal groups between TBI-Veh and Con-Veh (p-adj< .05). D) Pie-charts reflects the average proportion of genes whose expression was reversed (white) or unaffected (gray) by microglia depletion. Percentages of overall genes differentially expressed genes within all neuronal groups between TBI-Veh and Con-Veh (p-adj<.05). E). Subset of top genes increased or decreased within each neuronal group between TBI-Veh and Con-Veh (p-adj<.05). F) IPA (Canonical Pathways) of differentially expressed genes reversed by microglial depletion in representative neuronal groups between TBI-Veh and TBI-PLX. Each arrow represents a change in IPA z-score of ±2.
Fig. 4
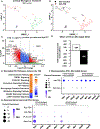
Fig. 4. Microglia RNA profiles and pathways in the cortex 7 dpi
Continuing with the snRNA-seq experiment outlined in Fig.1A, microglia clustering and profiles were determined A) Microglial populations were subset using CSF1R expression and sub-clustered using UMAP. B) UMAP plot with the distribution of microglia based on the Veh-Control and Veh-TBI groups at 7 dpi. C) Volcano plot genes increased or decreased within microglia between TBI-Veh and Con-Veh (p-adj <.05). D) Number of differentially expressed genes (DEGs) increased or decreased by TBI (p-adj <.05). E) IPA (Canonical Pathways) of differentially expressed genes within all microglial groups between TBI-Veh and Con-Veh (p-adj <.05). Each arrow represents a change in IPA z-score of ±2. F) Representative dot plot of “STING Mediated IFN-I Production” (Tbk1, cGas, Sting1, and “IFNAR medicated IFN-I Response” (Stat1, Ifnar2, Mx1, Mx2, Oasl2, Usp18) positive microglia showing relative expression. G) Representative dot plot of “STING Mediated IFN-I Production” (Tbk1, cGas, Sting1, and “IFNAR medicated IFN-I Response” (Stat1, Ifnar2, Mx1, Mx2, Oasl2, Usp18) in neurons showing relative expression.
Fig. 5
Fig. 5. TBI-induced cognitive deficits and neuroinflammation 7 dpi were attenuated by global knockout of STING
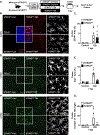
A) Adult male C57BL/6 STINGWT and STINGKO mice were subjected to midline fluid percussion injury (TBI) or left as controls. Cognition, STING expression and neuroinflammation were assessed 7 dpi. Cognition was determined using the novel object recognition (NOR) and location (NOL) tests (n=11–12) B) Total exploration (seconds) of the objects in NOR. C) Percent time exploring the novel object and D) Discrimination index of time exploring the novel object. E) Total exploration (seconds) of the objects in NOL. F) Percent time exploring the object in the novel location. G) Discrimination index of time exploring the object in the novel location. In a separate experiment, STINGWT and STINGKO were subjected to control or midline fluid percussion injury (TBI) and STING protein levels were determined in the cortex. H) Representative images of STING (red) and DAPI (blue) labeling from the cortex 7 dpi. I) Percent area of STING labeling in the cortex 7 dpi (n=4–6). In a separate experiment, STINGWT and STINGKO were subjected to control or midline fluid percussion injury (TBI) and mRNA levels of J) Irf3, K) Ifi27 and L) Cd68 were determined in percoll enriched microglia collected 7 dpi (n=4–6). In addition, M) mRNA levels of Irf7, Ccl2, Tmem173 (Sting), Tnf, and MhcII were determined in the cortex. Bars represent the mean ± SEM, and individual data points are provided. Means with (*) are significantly different from control groups (p<0.05). Means with (†) are different (p< 0.05) from the WT-TBI group.
Fig. 6
Fig. 6. TBI-induced microglia restructuring and rod-shaped microglia formation 7 dpi were attenuated by global knockout of STING
A) Adult male C57BL/6 STINGWT and STINGKO mice were subjected to control (uninjured) or midline fluid percussion injury (TBI). GFAP and IBA-1 labeling was assessed in the cortex 7 dpi (n=5–6). B) Representative images of GFAP (red) and DAPI (blue) labeling (10×) in the cortex 7 dpi. Inset panel shows zoomed GFAP labeling. Right panel shows representative pseudo-skeletonized GFAP labeling (white) in STINGWT- TBI and STINGKO-TBI groups at 7 dpi. C) Percent-area of GFAP labeling in the cortex 7 dpi. D) Representative images of IBA-1 (green) labeling (10×) in the cortex 7 dpi. Inset panel shows zoomed IBA-1 labeling. Right panel shows representative shows pseudo-skeletonized Iba1 labeling (white) in STINGWT- TBI and STINGKO-TBI groups at 7 dpi. E) Percent-area of IBA-1 labeling in the cortex 7 dpi. F) Representative images IBA-1 labeling of rod-shaped microglia (20×) in the cortex 7 dpi. Inset panel shows zoomed IBA-1 labeling of rod-shaped microglia. Right panel shows representative pseudo-skeletonized IBA-1 labeling of rod microglia (white) in STINGWT- TBI and STINGKO-TBI groups at 7 dpi. G) Number of Iba1+rod microglia per 20×field in the cortex 7 dpi. Bars represent the mean ± SEM, and individual data points are provided. Means with (*) are significantly different from control groups (p<0.05). Means with (#) tend to be significantly different (p<0.1).
Fig. 7
Fig. 7. TBI-induced cognitive deficits and neuroinflammation 30 dpi were attenuated by global knockout of STING.
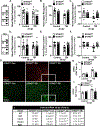
Adult male C57BL/6 wild type (STINGWT) and global STING knockout mice (STINGKO) were subjected to control (uninjured) or midline fluid percussion injury (TBI). Cognition and neuroinflammation were assessed 30 dpi. Cognition was determined using the novel object recognition (NOR) and location (NOL) tests (n=12–13). A) Total exploration (seconds) of the objects in NOR. B) Percent time exploring the novel object and C) Discrimination index of time exploring the novel object. D) Total exploration (seconds) of the objects in NOL. E) Percent time exploring the object in the novel location. F) Discrimination index of time exploring the object in the novel location. G) In a separate experiment, STINGWT and STINGKO were subjected to control or midline fluid percussion injury (TBI) and GFAP H) and Iba1 I) labeling were determined in the cortex. J) In addition, mRNA levels of Irf7, Ifi27, Clec7a, Tnf, H2-eb1, and Itgax were determined in the cortex. Bars represent the mean ± SEM, and individual data points are provided. Means with (*) are significantly different from control groups (p<0.05). Means with (†) are different (p< 0.05) from the WT-TBI group.
Figure. 8
Figure. 8. TBI induced neuroinflammation and cognitive deficits (7 dpi) were attenuated by the STING antagonist, chloroquine
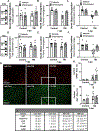
Adult male C57BL/6 mice were subjected to control (uninjured) or midline fluid percussion injury (TBI). 1h after TBI, mice received i.p. injection of saline (vehicle) or chloroquine (80mg/kg). Cognition and neuroinflammation were assessed 7 dpi. Cognition was determined using the novel object recognition (NOR) and location (NOL) tests (n=8–9). A) Total exploration (seconds) of the objects in NOR. B) Percent time exploring the novel object and C) Discrimination index of time exploring the novel object. D) Total exploration (seconds) of the objects in NOL. E) Percent time exploring the object in the novel location. F) Discrimination index of time exploring the object in the novel location. Following cognitive testing, mice were sacrificed, and cortical sections were collected for IHC and RNA analyses. G) GFAP and H) IBA-1 labeling were determined in the cortex. I) mRNA levels of Irf7, Ccl2, Tnf, H2-eb1, and Cd68, were determined in the cortex. Bars represent the mean ± SEM, and individual data points are provided. Means with (*) are significantly different from control groups (p<0.05). Means with (†) are different (p< 0.05) from the WT-TBI group.

References

    1. Salmond CH, Menon DK, Chatfield DA, Pickard JD, Sahakian BJ, Changes over time in cognitive and structural profiles of head injury survivors, Neuropsychologia 44(10) (2006) 1995–8. - PubMed
    1. Himanen L, Portin R, Isoniemi H, Helenius H, Kurki T, Tenovuo O, Longitudinal cognitive changes in traumatic brain injury: a 30-year follow-up study, Neurology 66(2) (2006) 187–92. - PubMed
    1. Till C, Colella B, Verwegen J, Green RE, Postrecovery cognitive decline in adults with traumatic brain injury, Arch Phys Med Rehabil 89(12 Suppl) (2008) S25–34. - PubMed
    1. Silver JM, McAllister TW, Arciniegas DB, Depression and cognitive complaints following mild traumatic brain injury, Am J Psychiatry 166(6) (2009) 653–61. - PubMed
    1. Jackson JC, Gordon SM, Hart RP, Hopkins RO, Ely EW, The association between delirium and cognitive decline: a review of the empirical literature, Neuropsychol Rev 14(2) (2004) 87–98. - PubMed

Publication types