. 2024 May;20(5):994-1014.
doi: 10.1080/15548627.2023.2281128. Epub 2023 Nov 17.

CSNK2 suppresses autophagy by activating FLN-NHL-containing TRIM proteins

Affiliations

CSNK2 suppresses autophagy by activating FLN-NHL-containing TRIM proteins

Helene Hoenigsperger et al. Autophagy. 2024 May.

Abstract

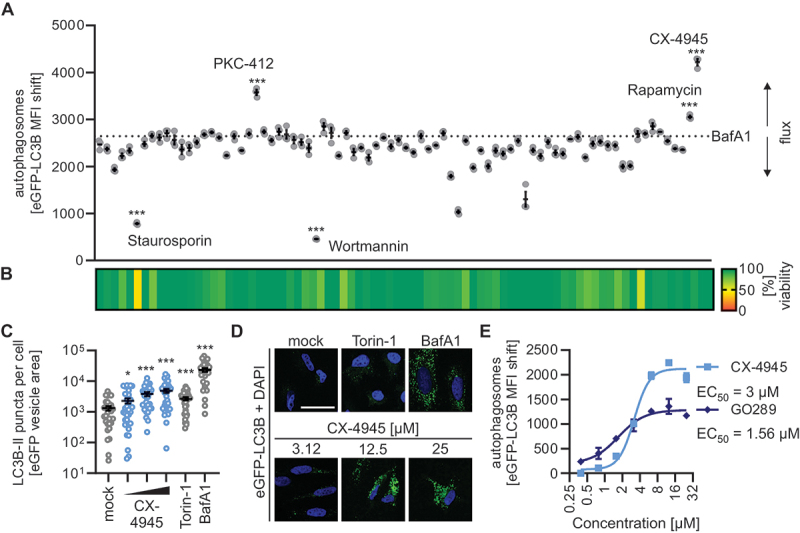
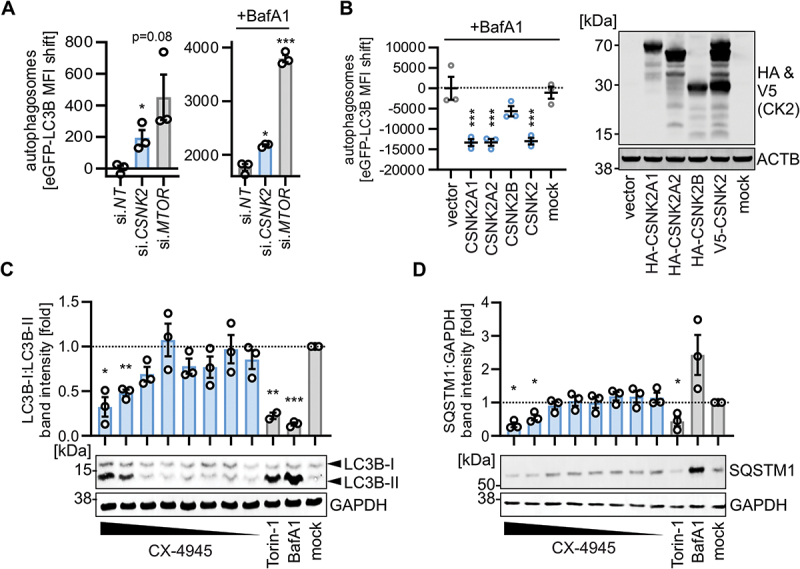
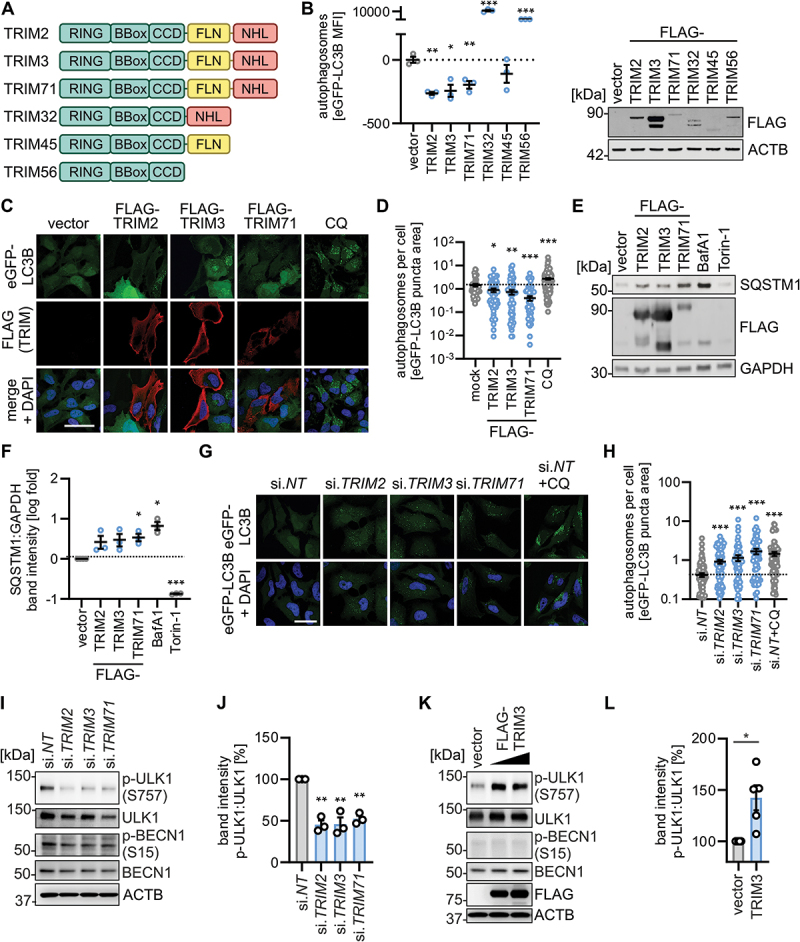
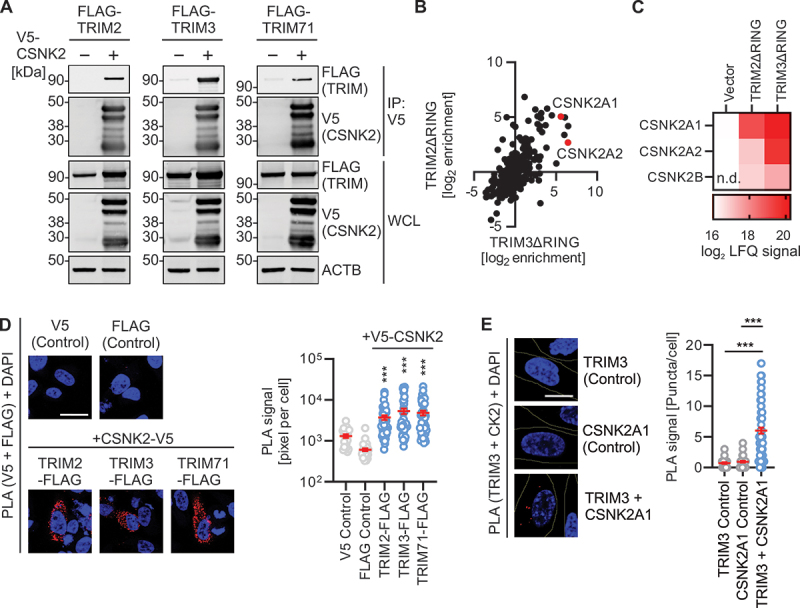
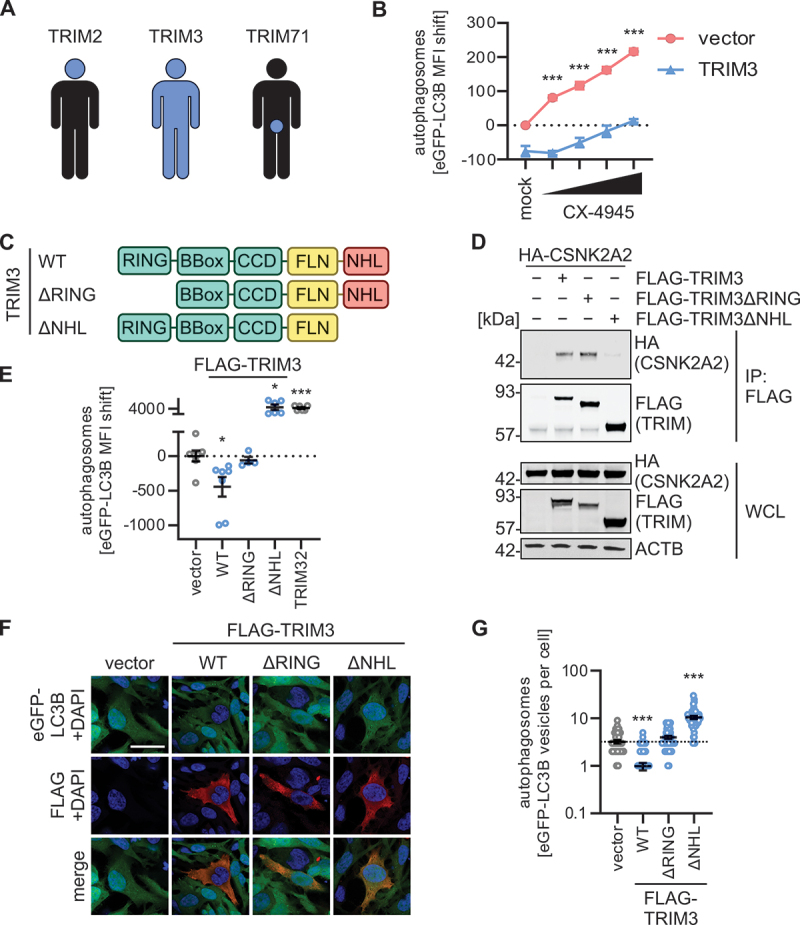
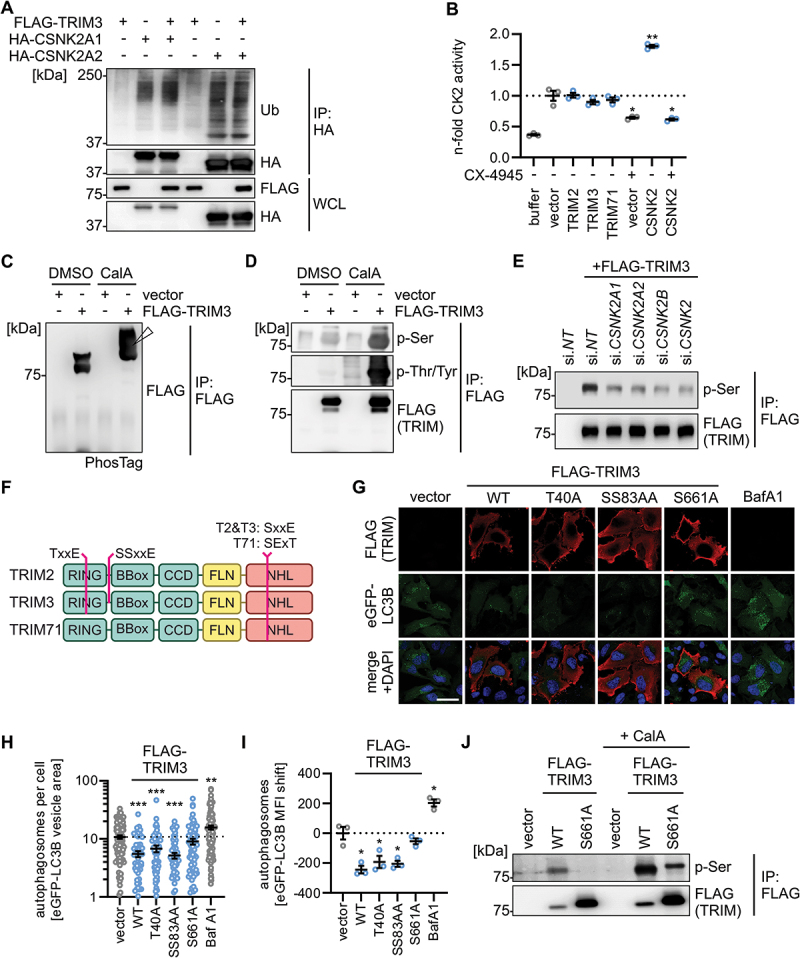
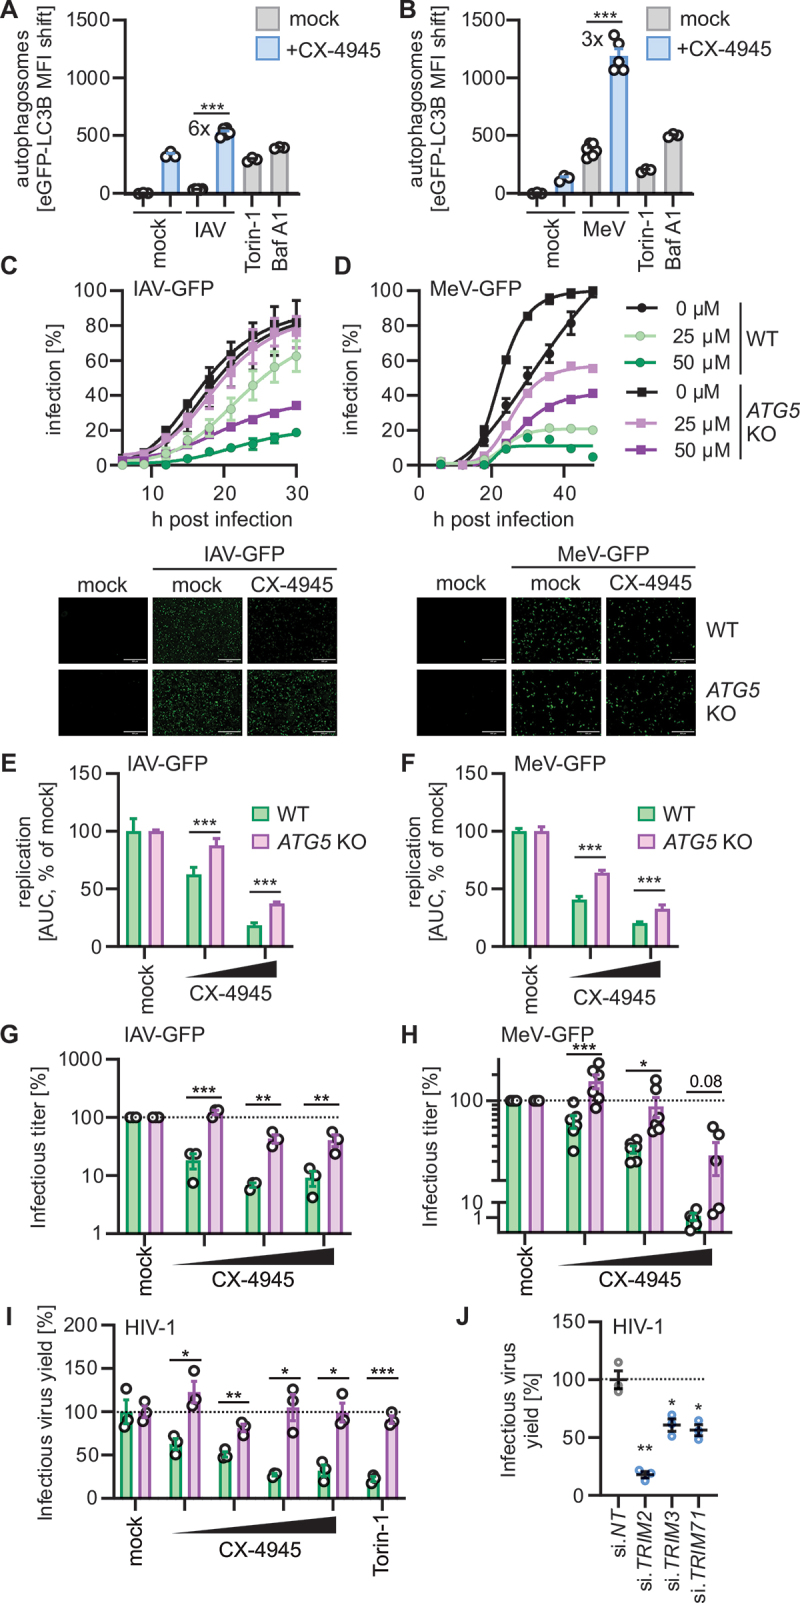
Macroautophagy/autophagy is a tightly regulated cellular process integral to homeostasis and innate immunity. As such, dysregulation of autophagy is associated with cancer, neurodegenerative disorders, and infectious diseases. While numerous factors that promote autophagy have been characterized, the key mechanisms that prevent excessive autophagy are less well understood. Here, we identify CSNK2/CK2 (casein kinase 2) as a negative regulator of autophagy. Pharmacological inhibition of CSNK2 activity or siRNA-mediated depletion of CSNK2 increased basal autophagic flux in cell lines and primary human lung cells. Vice versa, ectopic expression of CSNK2 reduced autophagic flux. Mechanistically, CSNK2 interacted with the FLN (filamin)-NHL domain-containing tripartite motif (TRIM) family members TRIM2, TRIM3 and TRIM71. Our data show that recruitment of CSNK2 to the C-terminal NHL domain of TRIM3 lead to its robust phosphorylation at serine 661 by CSNK2. A phosphorylation-defective mutant of TRIM3 was unable to reduce autophagosome numbers indicating that phosphorylation by CSNK2 is required for TRIM-mediated autophagy inhibition. All three TRIMs facilitated inactivation of the ULK1-BECN1 autophagy initiation complex by facilitating ULK1 serine 757 phosphorylation. Inhibition of CSNK2 promoted autophagy upon influenza A virus (IAV) and measles virus (MeV) infection. In line with this, targeting of CSNK2 or depletion of TRIM2, TRIM3 or TRIM71 enhanced autophagy-dependent restriction of IAV, MeV and human immunodeficiency virus 1 (HIV-1). Thus, our results identify the CSNK2-TRIM2, -TRIM3, -TRIM71 axis as a key regulatory pathway that limits autophagy. Targeting this axis may allow for therapeutic induction of autophagy against viral infections and in diseases associated with dysregulated autophagy.Abbreviation: ATG5: autophagy related 5; BafA1: bafilomycin A1; BECN1: beclin 1; CCD: coiled-coil domain; CSNK2/CK2: casein kinase 2; CSNK2A1: casein kinase 2 alpha 1; CSNK2A2: casein kinase 2 alpha 2; CSNK2B: casein kinase 2 beta; FLN: filamin; HeLa GL: HeLa cells stably expressing eGFP-LC3B; HIV-1: human immunodeficiency virus 1; IAV: influenza A virus; MAP1LC3B/LC3B: microtubule associated protein 1 light chain 3; MeV: measles virus; MTOR: mechanistic target of rapamycin kinase; RING: really interesting new gene; SQSTM1/p62: sequestosome 1; TRIM: tripartite motif; ULK1: unc-51 like autophagy activating kinase 1.

Keywords: Autophagy; ULK1; casein kinase; phosphorylation; tripartite motif proteins; virus.


Conflict of interest statement

No potential conflict of interest was reported by the authors.

Figures

Figure 1.
Figure 1.
CSNK2 inhibition induces autophagy. (A) Autophagosome levels in HeLa GL cells treated with kinase inhibitors (10 µM) and bafilomycin A1 (BafA1, co-treatment, 250 nM) as assessed 4 h post stimulation by flow cytometry (eGFP-LC3B MFI). Selected agents are annotated, full list in Table S1. Lines represent the mean ± SEM, n = 3. (B) Cell metabolic activity in samples from (A) was assessed via MTT assay 4 h post-treatment depicted as a heatmap of means as indicated, n = 3. (C) eGFP-LC3B puncta quantification in HeLa GL cells treated with increasing concentrations of CX-4945 (3.12–25 µM) for 24 h as indicated. Treatment with torin-1 (5 µM) and bafilomycin A1 (BafA1, 250 nM) for 24 h served as control. Lines represent the mean ± SEM, n = 29–33 (individual cells). (D) Representative fluorescence confocal laser scanning fluorescence microscopy images from (C). eGFP (green), nuclei (DAPI, blue). Scale bar: 25 µm. (E) Autophagosome levels (eGFP-LC3B MFI) in HeLa GL cells treated with increasing concentrations of CX-4945 or GO289 (0.25–32 µM), co-treated with bafilomycin A1 (BafA1, 250 nM) for 4 h. Dots represent the mean ± SEM, n = 3. EC50 of CX-4945 and GO289 are indicated next to the respective legend. Student’s t-test with Welch correction. *, p < 0.05; ***, p < 0.001.
Figure 2.
Figure 2.
CSNK2 activity reduces autophagy. (A) Autophagosome levels (eGFP-LC3B MFI) in HEK293T GL cells depleted by siRNA of CSNK2 or MTOR quantified 48 h post transfection with/without co-treatment of bafilomycin A1 (BafA1, 250 nM, 4 h) using flow cytometry. Bars represent mean ± SEM, n = 3. (B) Autophagosome levels (eGFP-LC3B MFI) in HEK293T GL cells transiently expressing indicated CSNK2 subunits or the whole complex as assessed by flow cytometry. (right panel) Representative immunoblot showing expression of the HA or V5 tagged CSNK2 subunits. Mock, no transfection. (C) Quantification of LC3-II:LC3-I levels relative to the untreated control (mock) in whole cell lysates of normal human lung fibroblasts (NHLF) treated with CX-4945 (50–0.39 µM) for 24 h as indicated. Bars represent mean ± SEM, n = 3, (independent experiments). (bottom panel) Representative immunoblots. (D) Quantification of SQSTM1:GAPDH in whole cell lysates of NHLF treated with CX-4945 (50–0.39 µM) for 24 h as indicated, relative to the control. (bottom panel) Representative immunoblots. Torin-1 (5 µM) and bafilomycin A1 (BafA1, 250 nM) served as positive controls. Bars represent mean ± SEM, n = 3 (independent experiments). Student’s t-test with Welch correction. *, p < 0.05; **, p < 0.01; ***, p < 0.001.
Figure 3.
Figure 3.
TRIM2, TRIM3 and TRIM71 inhibit autophagy initiation. (A) Schematic depiction of the domain organization of the FLN-NHL TRIMs (TRIM2, TRIM3, TRIM71) and closely related TRIM proteins. TRIM, tripartite motif. (B) Quantification of autophagosome levels in HEK293T GL cells transiently expressing the indicated FLAG-tagged TRIMs at 48 h post transfection by flow cytometry. Lines represent mean ± SEM, n = 3. (right panel) Representative immunoblot of whole cell lysates. (C) Representative confocal laser scanning fluorescence microscopy images of HeLa GL cells transiently expressing indicated TRIMs (48 h) or treated with chloroquine (CQ, 10 µM, overnight). TRIMs (FLAG, red), eGFP-LC3B (green), nuclei (DAPI, blue). Scale bar: 10 µm. (D) Quantification of eGFP-puncta area per cell in the images from (C). Lines represent mean ± SEM, n = 61–139 (individual cells). (E) Representative immunoblots of whole cell lysates of HEK293T cells transiently expressing indicated TRIMs (48 h post transfection). Blots were stained with anti-SQSTM1 and anti-GAPDH. Torin-1 (5 µM) and bafilomycin A1 (BafA1, 250 nM) treatment were used as positive controls. (F) Quantification of the immunoblotting data of (E). Lines represent mean ± SEM, n = 3. (G) Representative confocal laser scanning fluorescence microscopy images of HeLa GL cells (48 h post transfection) depleted of the indicated TRIMs by siRNA or treated with chloroquine (CQ, 10 µM, overnight). eGFP-LC3B (green), nuclei (DAPI, blue). Scale bar: 10 µm. (H) Quantification of the eGFP-puncta area per cell in the images from (F), Lines represent mean ± SEM, n = 61–117 (individual cells). (I) Representative immunoblots of whole cell lysates of HDF cells depleted of the indicated TRIMs by siRNA at 40 h post transfection. Blots were stained with anti-p-ULK1 (S757), anti-ULK1, anti-p-BECN1 (Ser15), anti-BECN1 and anti-ACTB. (J) quantification of the band intensities of p-ULK1 (Ser757) to total ULK1 of the immunoblotting data of (I). Bars represent mean ± SEM, n = 3. (K) Representative immunoblots of whole cell lysates of HEK293T cells that transiently expressed empty vector or TRIM3 at 40 h post transfection. Blots were stained with anti-p-ULK1 (Ser757), anti-ULK1, anti-p-BECN1 (Ser15), anti-BECN1, anti-FLAG and anti-ACTB. (L) Quantification of the band intensities of p-ULK1 (Ser757):ULK1 levels of the immunoblotting data of (K) at highest TRIM3 transfection levels. Bars represent mean ± SEM, n = 5. Student’s t-test with Welch correction. *, p < 0.05; **, p < 0.01; ***, p < 0.001.
Figure 4.
Figure 4.
CSNK2 interacts with FLN-NHL TRIMs. (A) Representative Immunoblots of an anti-V5 immunoprecipitation of whole cell lysates of HEK293T cells transiently expressing FLAG-tagged TRIM2, TRIM3 or TRIM71, and V5-tagged CSNK2 subunits as indicated. Blots were stained with anti-FLAG, anti-HA and anti-ACTB. WCL, whole cell lysate. (B) Scatter plot depicting enrichment of proteins co-purifying FLAG-tagged RING deleted mutants of TRIM2 and TRIM3 of a large-scale affinity isolation in HEK293T cells. Enrichments calculated relative to the vector control as label free quantification signal. CSNK2 subunits are highlighted in red. (C) Co-enrichment of the CSNK2 subunits with RING deleted versions of TRIM2 and TRIM3 extracted from the data in (B). Log2 of the label free quantification signal is shown as a heatmap as indicated. n.D., not detected. (D) Representative confocal microscopy images showing the colocalization of overexpressed CSNK2-V5 with each FLAG-tagged TRIM2, TRIM3 and TRIM71 in HeLa cells compared to the single stained mock controls by PLA (red). Nuclei, DAPI (blue). Scale bar: 25 µm. (right panel) quantification of the PLA signal as pixel per cell. Lines represent mean ± SEM, n = 22–47 (individual cells). (E) Representative confocal microscopy images showing the colocalization of endogenous CSNK2A1 and TRIM3 in NHLF cells compared to the single stained mock controls by PLA (red). Nuclei, DAPI (blue). Scale bar: 10 µm. (right panel) quantification of the PLA signal as puncta per cell. Lines represent mean ± SEM, n = 41–94 (individual cells). Student’s t-test with Welch correction. ***, p < 0.001.
Figure 5.
Figure 5.
TRIM3 mediated autophagy modulation is dependent on its NHL domain. (A) Schematic depiction of the expression patterns of TRIM2, TRIM3 and TRIM71 across the human body. See Figure S5A. (B) Quantification of autophagosome levels (eGFP-LC3B MFI) in HEK293T GL cells transiently expressing TRIM3 or a vector control. 48 h post transfection, cells were treated with increasing concentration of CX-4945 (4 h) and autophagosome levels (eGFP-LC3B MFI) were quantified using flow cytometry. Treatment with bafilomycin A1 (BafA1, 250 nM) was used as a positive control. Lines represent mean ± SEM, n = 3. (C) Schematic depiction of the domain organization of TRIM3 and the ΔRING and ΔNHL truncation mutants. (D) Anti-FLAG immunoprecipitation (IP) in whole cell lysates of HEK293T cells transiently expressing HA-tagged CSNK2A2 and indicated FLAG-tagged TRIM3 constructs. 48 h post transfection whole cell lysates (WCLs) and precipitates were analyzed by immunoblotting. Blots were stained with anti-HA, anti-FLAG and anti-ACTB. (E) Quantification of autophagosome levels (eGFP-LC3B MFI, 48 h post transfection) in HEK293T GL cells transiently expressing indicated TRIM3 truncation mutants. Lines represent mean ± SEM, n = 3. (F) Representative confocal laser scanning fluorescence microscopy images of HeLa GL cells transiently expressing indicated FLAG-tagged TRIM3 constructs (48 h post transfection). TRIMs (FLAG, red), eGFP-LC3B (green), nuclei (DAPI, blue). Scale bar: 10 µm. (G) Quantification of the eGFP-puncta area per cell in the images from (F). Lines represent mean ± SEM, n = 42–57 (individual cells). Student’s t-test with Welch correction. *, p < 0.05; ***, p < 0.001.
Figure 6.
Figure 6.
CSNK2 phosphorylates TRIM3 at S661 to inhibit autophagy. (A) Ubiquitination status of indicated HA-tagged CSNK2 subunits purified by anti-HA immunoprecipitation from whole cell lysates (WCLs) of transfected HEK293T cells at 40 h post transfection. IPs and WCLs were analyzed by immunoblotting. Blots were stained with anti-ub (ubiquitin), anti-FLAG and anti-HA. (B) Quantification of CSNK2 activity in whole cell lysates of HEK293T cells transiently expressing indicated proteins and/or treated with CX-4945 (10 µM) by ELISA. Data are relative to the vector control. Lines represent mean ± SEM, n = 3. (C and D) Analysis of the phosphorylation status of TRIM3 in HEK293T cells transiently expressing TRIM3 or a vector control by (C) PhosTag acrylamide gel analysis (the white arrow indicates the shifted phosphorylated TRIM3) and (D) enrichment of the FLAG-tagged TRIM3 and immunoblot analysis using phospho-specific antibodies. Blots were stained with anti-FLAG, anti-p-Ser and anti-p-Thr/Tyr. CalA, Calyculin A. (E) Analysis of the phosphorylation status of TRIM3 purified from HEK293T cells expressing TRIM3 or a vector control and depleted of the indicated proteins using siRNAs targeting individual components of the CSNK2 complex (as indicated) or the whole complex (si.CSNK2) as assessed by immunoblotting. Blots were stained with anti-FLAG and anti-p-Ser. (F) Schematic depiction of the domain organization of the indicated TRIMs and the position and sequence context of the predicted putative CSNK2 phosphorylation sites. (G) Exemplary representative laser scanning confocal microscopy images of HEK293T GL cells transiently expressing the indicated TRIM3 mutants or a vector control 48 h post transfection. TRIMs (FLAG, red), eGFP-LC3B (green), nuclei (DAPI, blue). Scale bar: 10 µm. (H) eGFP-LC3B-puncta area per cell from the pictures in (G) was quantified. Lines represent mean ± SEM, n = 59–112 (individual cells) (I) Quantification of autophagosome levels (eGFP-LC3B MFI, 48 h post transfection) in HEK293T GL cells transiently expressing indicated TRIM3 mutants or a vector control. Bafilomycin A1 (BafA1, 250 nM, overnight) was used a positive control. Lines represent mean ± SEM, n = 3. (J) Analysis of the phosphorylation status of TRIM3 WT and TRIM3 S661A purified by anti-FLAG IP from whole cell lysates of HEK293T cells transiently expressing indicated TRIM3 constructs or a vector control and analyzed by immunoblots. Blots were staiend with anti-FLAG and anti-p-Ser. Student’s t-test with Welch correction. *, p < 0.05; **, p < 0.01; ***, p < 0.001.
Figure 7.
Figure 7.
Pharmacological targeting of the CSNK2-TRIM2, -TRIM3, -TRIM71 axis restricts virus growth. (A and B) Quantification of autophagosome levels (eGFP-LC3B MFI) in HeLa GL cells, with and without CX-4945 (1 µM, 1 h) treatment were infected with (A) influenza a virus (IAV, MOI 5, 5 h) or (B) measles virus (MeV, MOI 1, 24 h) by flow cytometry. Torin-1 (1 µM, 4 h) and bafilomycin A1 (BafA1, 250 nM, 4 h) treatment was used as controls. Lines represent mean ± SEM, n = 3–6. (C and D) A549 WT and A549 ATG5 KO cells were treated with CX-4945 (25 µM, 50 µM, 1 h) or left untreated and infected with (C) IAV-GFP or (D) MeV-GFP. Infection kinetics were monitored via fluorescence microscopy for 30 h (IAV-GFP) or 40 h (MeV-GFP) by quantifying GFP+ cell count every 3 h and normalized to maximum infection (100%). Representative fluorescence microscopy images are shown of time-point 24 h. Infected cells (GFP, green). Scale bars: 100 µm. Dots represent the mean ± SEM, n = 3. (E and F) Relative comparison of (E) IAV-GFP or (F) MeV-GFP replication in A549 WT and A549 ATG5 KO cells using area under the curve analysis of the data in (C) and (D). Bars represent mean ± SEM, n = 3. (G and H) A549 WT and A549 ATG5 KO cells were treated with CX-4945 (6.25 µM −25 µM, 2 h) or left untreated, and infected with (G) IAV-GFP or (H) MeV-GFP. Supernatants were collected 24 h (IAV-GFP) or 48 h (MeV-GFP) post infection. Infectious virus titers from A549 cells treated with IAV-GFP infected supernatants (G) or from Vero cells treated with MeV-GFP infected supernatants (H). TCID50 (IAV-GFP) and FFU/mL (MeV-GFP) were determined at 72 h post infection. Relative infectious virus titers are normalized to the mock control (DMSO). Bars represent mean ± SEM, n = 3 (IAV) or 6 (MeV). (I) Infectious virus yields of HIV-1 NL4–3 proviral DNA transfected HEK293T WT or HEK293T ATG5 KO cells treated with increasing concentrations of CX-4945 (1.56–12.5 µM) and quantified by TZM-bl reporter assay 24 h post transfection. Relative infectious virus yield is normalized to the untreated control (mock). Treatment with torin-1 (1 µM) was used as a control. Bars represent mean ± SEM, n = 3. (J) Quantification of infectious virus yield of HIV-1 CH077 in TZM-bl cells depleted of TRIM2, TRIM3 and TRIM71 by siRNA and infected with CH077 HIV-1 one day post transfection. Three days post infection, the infectious virus yield in the supernatant was determined by TZM-bl reporter assay. Relative infectious virus yield is normalized to the non-targeting (NT) control (100%). Lines represent mean ± SEM, n = 3 (technical replicates). Student’s t-test with Welch correction or two-way ANOVA (G, H). *, p < 0.05; **, p < 0.01; ***, p < 0.001.

References

    1. Gatica D, Lahiri V, Klionsky DJ.. Cargo recognition and degradation by selective autophagy. Nat Cell Biol. 2018;20(3):233–242. doi: 10.1038/s41556-018-0037-z - DOI - PMC - PubMed
    1. Levine B, Mizushima N, Virgin HW. Autophagy in immunity and inflammation. Nature. 2011;469(7330):323–335. doi: 10.1038/nature09782 - DOI - PMC - PubMed
    1. Liu Y, Levine B. Autosis and autophagic cell death: the dark side of autophagy. Cell Death Differ. 2015;22(3):367–376. doi: 10.1038/cdd.2014.143 - DOI - PMC - PubMed
    1. He C, Klionsky DJ. Regulation Mechanisms and Signaling Pathways of Autophagy. Ann Rev Genet. 2009;43(1):67–93. doi: 10.1146/annurev-genet-102808-114910 - DOI - PMC - PubMed
    1. Xie J, Wang X, Proud CG. mTOR inhibitors in cancer therapy. F1000Res. 2016;(5):F1000. Faculty Rev-2078 10.12688/f1000research.9207.1 - DOI - PMC - PubMed

Publication types

MeSH terms