. 2022 Apr 13;2(1):36.
doi: 10.1038/s43705-022-00121-8.

Contrasting diversity patterns of prokaryotes and protists over time and depth at the San-Pedro Ocean Time series

Affiliations

Contrasting diversity patterns of prokaryotes and protists over time and depth at the San-Pedro Ocean Time series

Yi-Chun Yeh et al. ISME Commun. .

Abstract

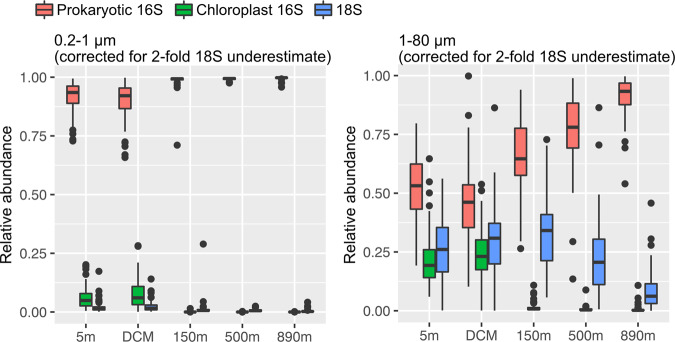
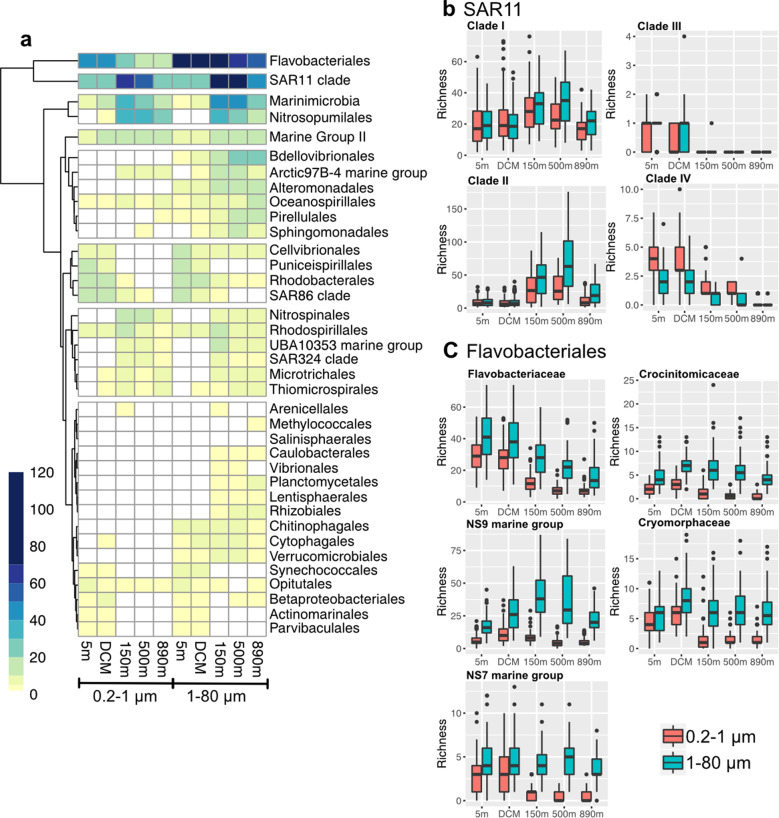
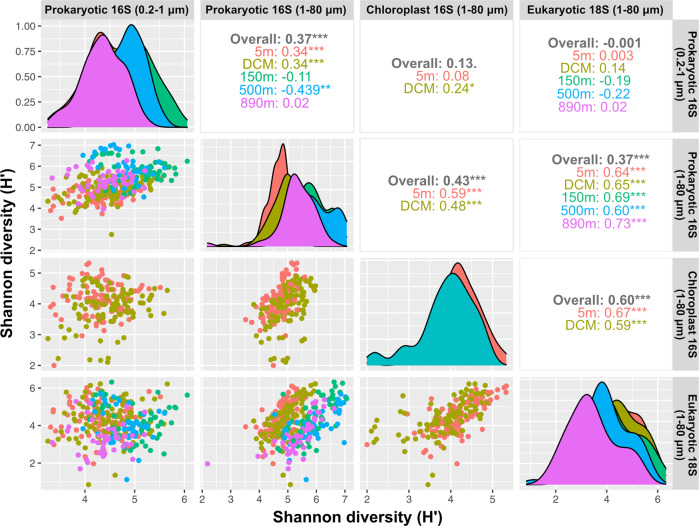
Community dynamics are central in microbial ecology, yet we lack studies comparing diversity patterns among marine protists and prokaryotes over depth and multiple years. Here, we characterized microbes at the San-Pedro Ocean Time series (2005-2018), using SSU rRNA gene sequencing from two size fractions (0.2-1 and 1-80 μm), with a universal primer set that amplifies from both prokaryotes and eukaryotes, allowing direct comparisons of diversity patterns in a single set of analyses. The 16S + 18S rRNA gene composition in the small size fraction was mostly prokaryotic (>92%) as expected, but the large size fraction unexpectedly contained 46-93% prokaryotic 16S rRNA genes. Prokaryotes and protists showed opposite vertical diversity patterns; prokaryotic diversity peaked at mid-depth, protistan diversity at the surface. Temporal beta-diversity patterns indicated prokaryote communities were much more stable than protists. Although the prokaryotic communities changed monthly, the average community stayed remarkably steady over 14 years, showing high resilience. Additionally, particle-associated prokaryotes were more diverse than smaller free-living ones, especially at deeper depths, contributed unexpectedly by abundant and diverse SAR11 clade II. Eukaryotic diversity was strongly correlated with the diversity of particle-associated prokaryotes but not free-living ones, reflecting that physical associations result in the strongest interactions, including symbioses, parasitism, and decomposer relationships.


Conflict of interest statement

The authors declare no competing interests.

Figures

Fig. 1
Fig. 1. Monthly average sea surface temperature (SST), satellite chlorophyll-a concentration (Chl-a), and satellite primary productivity (PP) at the SPOT location during 2005–2018.
The black lines within the box plots represent the median values, and the box bottom and top show the 25th and 75th percentile. The whiskers represent the lower and the upper bounds, and the dots represent outliers.
Fig. 2
Fig. 2. Dominance of prokaryotes in both size fractions, as shown by the proportions of prokaryotic 16S, chloroplast 16S (representing phototrophic eukaryotes), and 18S reads (including Metazoa sequences) found in 0.2–1 μm and 1–80 μm size fractions.
The corrected values include a twofold adjustment of the 18S sequences to account for length-based bias in sequencing, determined from mixed mock communities (see text, and uncorrected data in Fig. S3).
Fig. 3
Fig. 3. Alpha- and beta-diversity patterns for prokaryotic 16S, chloroplast 16S, eukaryotic 18S (excluding Metazoa sequences).
a Shannon (H′) index, showing a diversity maximum at 150 and 500 m for prokaryotes and at 5 m and DCM for eukaryotes. b Patterns of pairwise Bray-Curtis similarity between all sampling dates within each size fractions for each sampling depth, showing that temporal stability of prokaryotes increased with depth (i.e., higher average similarities between all sample pairs), and that eukaryote communities were less temporally stable than prokaryotes. c Nonmetric multidimensional scaling (NMDS), with ordination computed based on Bray–Cutis distance of prokaryotic 16S, chloroplast 16S, and eukaryotic 18S communities, showing depth stratification for all three types, and that for prokaryotes there was a greater differentiation between size fractions in the depths ≥150 m.
Fig. 4
Fig. 4. Temporal patterns in community similarity of free-living prokaryotic 16S (0.2–1 μm), particle-associated or larger prokaryotic 16S (1–80 μm), chloroplast 16S and 18S (excluding Metazoa sequences) communities.
Free-living and particle-associated or larger prokaryotes at 5 m and the DCM exhibited a clear annual recurrence pattern, with peaks in similarity at 12-month intervals (i.e. comparing all samples 12, 24, 36, etc. months apart) and lowest similarity in opposite seasons, i.e. 6, 18, 30 etc. months apart. Note that as number of years increased between samples, the 5 m depth free-living prokaryote similarities oscillated fairly steadily around an average of ~0.5, suggesting variability within a steady range of community compositions, while the 150 and 500 m free-living prokaryotes showed a general decline in similarity from about 0.7 at short intervals to about 0.5 at longer intervals, suggesting a tighter range of compositional change particularly for samples collected within a few years of each other. The 890 m similarities are more persistently high across all intervals.
Fig. 5
Fig. 5. Partitioning of major taxonomic groups by depth, size fraction, and month of the year shows strong stratification and seasonal effects.
Heatmap of monthly average prokaryotic 16S communities at the order level (only dominant orders were selected, if their mean relative abundance is >1%). Columns were clustered based on Bray–Curtis distance. Rows were clustered based on Euclidean distance. The top row is colored by sampling depth, and second row indicates the size fraction. The dendrogram on top shows that prokaryotic communities primarily clustered by sampling depth (surface vs. depth) and then by size fraction. The numbers in parentheses show the overall average relative abundances in the 0.2–1 μm and 1–80 μm size fraction, respectively.
Fig. 6
Fig. 6. Diversity within major groups differs sharply between taxa, depth, and size fraction.
a Heatmap of rarefied ASV richness observed within each prokaryotic order at each sampling depth (rows were clustered based on Euclidean distance). There were endemic taxonomic groups present at depth, such as Nitrospinales, UBA10353 marine groups, and SAR324. Note Flavobacteriales and SAR11 both exhibited high richness at 150 and 500 m, thus (b) and (c) were further analyzed for richness patterns among subclades. b SAR11 clade I was ubiquitously distributed in the water column, whereas SAR11 clade II showed high richness at 150 and 500 m. c Flavobacteriales subclades showed that all these groups were more diverse in the large size fraction. Among them, NS9 marine groups were high in richness at 150 and 500 m.
Fig. 7
Fig. 7. Relative abundance of major eukaryote groups varied with season and depth shown by monthly average chloroplast 16S (representing phototrophic eukaryotes) and 18S (excluding Metazoa sequences) communities in 1–80 μm size fraction.
Only abundant classes were selected. i.e. with relative abundance of >2% in any sample. Columns were clustered based on Bray-Curtis distance. Rows were clustered based on Euclidean distance. a Chloroplast 16S communities were mostly dominated by Prymnesiophyceae in summer/autumn and Bacillariophyta (diatoms) in spring/winter. b 18S communities were dominated by Syndiniales throughout the water column, followed by dinoflagellates, rhizarians (polycystine radiolarians mostly deeper, acantharians at all depths), and ciliates (mostly top 3 depths). The numbers in parentheses show the overall average relative abundances.
Fig. 8
Fig. 8. Relationships of diversity between microbial types at different depths.
Scatterplots of Shannon diversity between each two communities are shown on the lower and left side. Pearson’s correlations considering all depths and depth-specific correlations are shown on the right. The distributions of Shannon diversity color coded by depth is shown on the diagonal. While many correlations were strong, there were notably weak correlations between diversity of eukaryotes (or chloroplasts) and free-living prokaryotes (0.2–1 μm). Significance levels (“.” p < 0.1; “*” P < 0.05; “**” P < 0.01; “***” P < 0.001).

References

    1. Brown MV, Philip GK, Bunge JA, Smith MC, Bissett A, Lauro FM, et al. Microbial community structure in the North Pacific ocean. ISME J. 2009;3:1374–86. doi: 10.1038/ismej.2009.86. - DOI - PubMed
    1. Chénard C, Wijaya W, Vaulot D, dos Santos AL, Martin P, Kaur A, et al. Temporal and spatial dynamics of Bacteria, Archaea and protists in equatorial coastal waters. Sci Rep. 2019;9:1–13. doi: 10.1038/s41598-019-52648-x. - DOI - PMC - PubMed
    1. Yeh YC, McNichol J, Needham DM, Fichot EB, Berdjeb L, Fuhrman JA. Comprehensive single‐PCR 16S and 18S rRNA community analysis validated with mock communities, and estimation of sequencing bias against 18S. Environ Microbiol. 2021;23:2340–3250. doi: 10.1111/1462-2920.15553. - DOI - PubMed
    1. Needham DM, Fuhrman JA. Pronounced daily succession of phytoplankton, archaea and bacteria following a spring bloom. Nat. Microbiol. 2016;1:16005. doi: 10.1038/nmicrobiol.2016.5. - DOI - PubMed
    1. Parada AE, Needham DM, Fuhrman JA. Every base matters: assessing small subunit rRNA primers for marine microbiomes with mock communities, time series and global field samples. Environ Microbiol. 2016;18:1403–14.. doi: 10.1111/1462-2920.13023. - DOI - PubMed