. 2023 Dec;72(12):4385-4397.
doi: 10.1007/s00262-023-03573-6. Epub 2023 Nov 8.

Spatial immune composition of tumor microenvironment in patients with pancreatic cancer

Affiliations

Spatial immune composition of tumor microenvironment in patients with pancreatic cancer

Eline S Zwart et al. Cancer Immunol Immunother. 2023 Dec.

Abstract

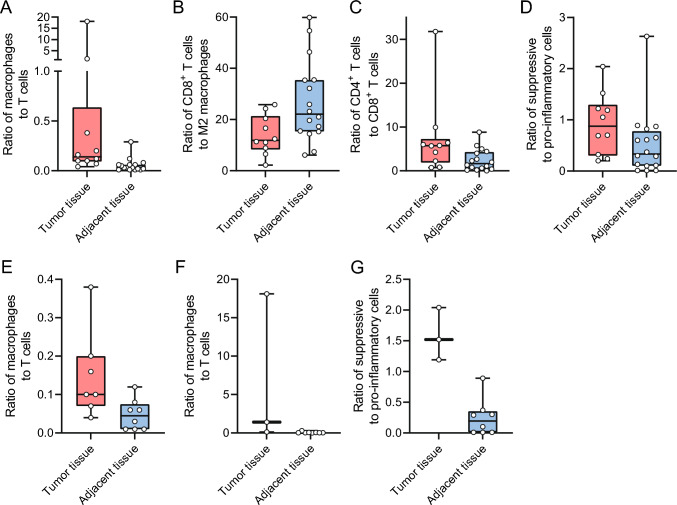
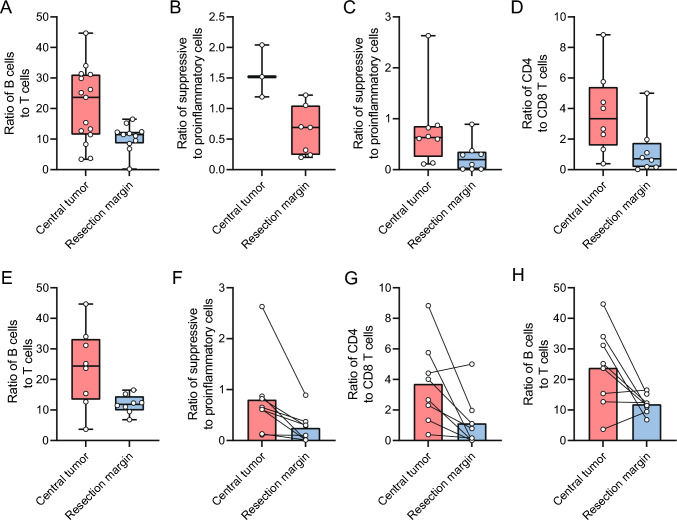
This study examined the composition of the immune microenvironment at different sites within resected pancreas specimens from patients with pancreatic ductal adenocarcinoma (PDAC). Therefore, single-cell suspensions were made from fresh tumor and non-tumorous tissue. Fourteen patients were included from whom twelve PDAC and five non-tumorous samples were obtained. These samples were analyzed with a nineteen marker panel on the Aurora spectral flow cytometer. Furthermore, slides from formalin-fixed paraffine PDACs of eight additional patients were stained with eight markers and analyzed by multispectral imaging. These corresponded to central tumor, periphery of the tumor, i.e., invasive front and resected lymph node and were divided into tumor and adjacent tissue. In the single-cell suspension, a decreased ratio between lymphoid and myeloid cells and between M1 and M2 macrophages was observed in the tumor tissue compared to non-tumorous tissue. Furthermore, an increase in CD169 + macrophages in patients undergoing neoadjuvant therapy was found. Using immunofluorescence, more macrophages compared to T cells were observed, as well as a lower ratio of CD8 to M2 macrophage, a higher ratio of CD4-CD8 T cells and a higher ratio of immune-suppressive cells to pro-inflammatory cells in the PDAC area compared to the adjacent non-tumorous tissue. Finally, there were more immune-suppressive cells in the central tumor area compared to the invasive front. In conclusion, we show a gradient in the immune-suppressive environment in PDAC from most suppressive in the central tumor to least suppressive in distant non-tumorous tissue.

Keywords: Immunology; Neoadjuvant therapy; Pancreatic cancer; Tumor microenvironment.


Conflict of interest statement

The authors declare that they have no conflict of interest.

Figures

Fig. 1
Fig. 1
Abundances of immune populations in single-cell suspensions A UMAP of included samples, B UMAP of lymphoid and myeloid cells, and tumor and non-lesional tissue, C ratio between lymphoid and myeloid cells in tumor versus non-lesional tissue, D ratio between M1 and M2 macrophages in tumor versus non-lesional tissue, E percentage of CD169+ macrophages of total cells in patients with PDAC who received neoadjuvant therapy versus those who did not receive neoadjuvant therapy, F percentage of CD4 of total cells in tumor tissue of patients with PDAC with < 18-month survival and ≥ months survival , G abundances in tumor of PDAC survival CD4 (H) percentage of CD88+CD16high of total cells in tumor tissue of patients with PDAC with < 18-month survival and ≥ months survival I percentage of DC3 of total cells in tumor tissue of patients with PDAC with < 18-month survival and ≥ months survival , H percentage of M1 macrophages of total cells in tumor tissue of patients with PDAC with < 18-month survival and ≥ months survival boxplots: black bar denotes median, box denotes the interquartile range, whiskers indicate the range of values that are outside of the interquartile range. Outliers are defined as > 1.5 times the size of the interquartile range and presented as a*
Fig. 2
Fig. 2
Abundances in tumor tissue versus adjacent tissue A percentage of T cells of total cell population, B ratio between CD8 T cells and M2 macrophages, C ratio between CD4 and CD8 T cells, D ratio between suppressive and proinflammatory immune cells, E ratio between macrophages and T cells in tumor versus adjacent tissue of central tumor slides, F ratio between macrophages and T cells in tumor versus adjacent tissue of invasive border slides, G ratio between suppressive and proinflammatory immune cells in tumor versus adjacent tissue of invasive border slides. Boxplots: black bar denotes median, box denotes the interquartile range, whiskers indicate the range of values that are outside of the interquartile range. Outliers are defined as > 1.5 times the size of the interquartile range and presented as a*
Fig. 3
Fig. 3
Paired mean abundances of tumor tissue versus adjacent tissue A paired mean of M2 macrophages of total cells, B paired mean of regulatory B cells of total cells, C paired mean of regulatory T cells of total cells, D paired mean of CD8 T cells of total cells, E paired mean of monocytes of total cells, F paired mean of M1 macrophages of total cells, G representative images of lymphoid markers of matches tissue, H representative images of myeloid markers of matches tissue
Fig. 4
Fig. 4
Abundances in central tumor slide versus invasive border slide A ratio between B and T cells, (B) ratio between suppressive versus proinflammatory immune cells in tumor tissue, C ratio between suppressive versus proinflammatory immune cells in adjacent tissue, D ratio between CD4 and CD8 T cells in adjacent tissue, E ratio between B and T cells in adjacent tissue, F paired mean of ratio between suppressive versus proinflammatory immune cells in adjacent tissue, G paired mean of ratio between CD4 and CD8 T cells in adjacent tissue, H paired mean of ratio between B and T cells in adjacent tissue. Boxplots: black bar denotes median, box denotes the interquartile range, whiskers indicate the range of values that are outside of the interquartile range. Outliers are defined as > 1.5 times the size of the interquartile range and presented as a*
Fig. 5
Fig. 5
Abundances in lymph node tumor tissue versus adjacent tissue A percentage of regulatory B cells of total cells, B ratio between macrophages and T cells, C paired mean of regulatory B cells of total cells, (D) paired mean of regulatory T cells of total cells, E paired mean of M2 macrophages of total cells, F paired mean of ratio between suppressive versus proinflammatory immune cells. Boxplots: black bar denotes median, box denotes the interquartile range, whiskers indicate the range of values that are outside of the interquartile range. Outliers are defined as > 1.5 times the size of the interquartile range and presented as a*

References

    1. Siegel RL, Miller KD, Jemal A. Cancer statistics. CA Cancer J Clin. 2017;67:7–30. doi: 10.3322/caac.21387. - DOI - PubMed
    1. Conroy T, Hammel P, Hebbar M, et al. FOLFIRINOX or gemcitabine as adjuvant therapy for pancreatic cancer. N Engl J Med. 2018;379:2395–2406. doi: 10.1056/NEJMoa1809775. - DOI - PubMed
    1. Office for National Statistics CsbsadfE (2019)
    1. Latenstein AEJ, van der Geest LGM, Bonsing BA, et al. Nationwide trends in incidence, treatment and survival of pancreatic ductal adenocarcinoma. Eur J Cancer. 2020;125:83–93. doi: 10.1016/j.ejca.2019.11.002. - DOI - PubMed
    1. Duan J, Cui L, Zhao X, et al. Use of immunotherapy with programmed cell death 1 versus programmed cell death ligand 1 inhibitors in patients with cancer: a systematic review and meta-analysis. JAMA Oncol. 2020;6:375–384. doi: 10.1001/jamaoncol.2019.5367. - DOI - PMC - PubMed