. 2023 Nov 8;14(1):6915.
doi: 10.1038/s41467-023-42593-9.

Spatial exosome analysis using cellulose nanofiber sheets reveals the location heterogeneity of extracellular vesicles

Affiliations

Spatial exosome analysis using cellulose nanofiber sheets reveals the location heterogeneity of extracellular vesicles

Akira Yokoi et al. Nat Commun. .

Abstract

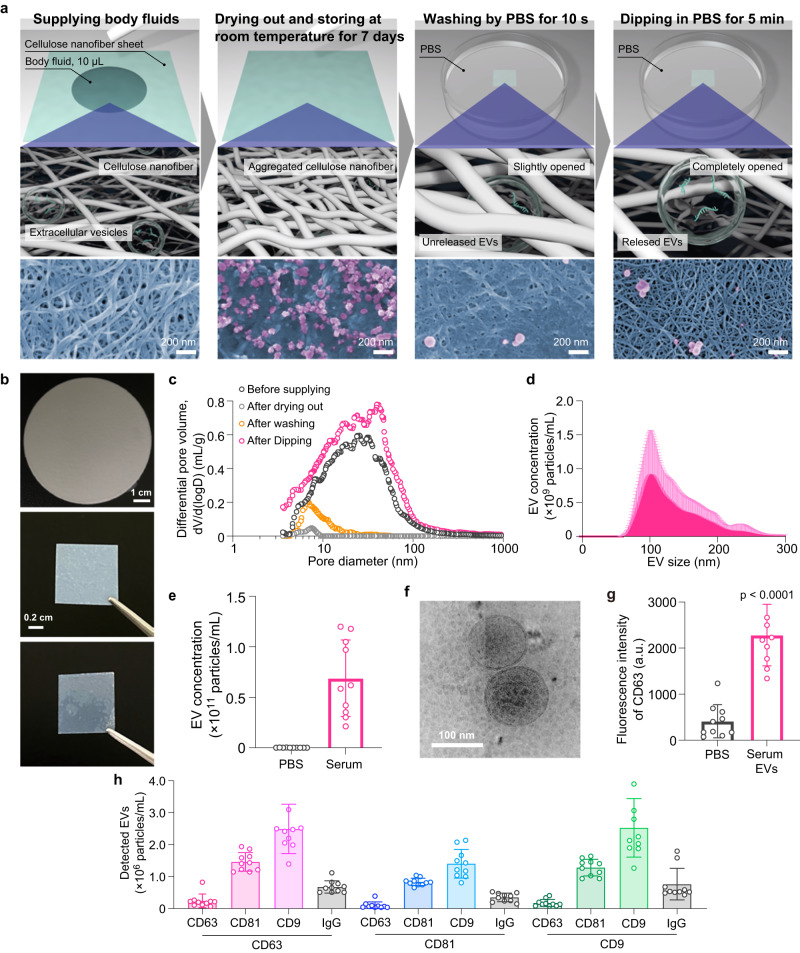
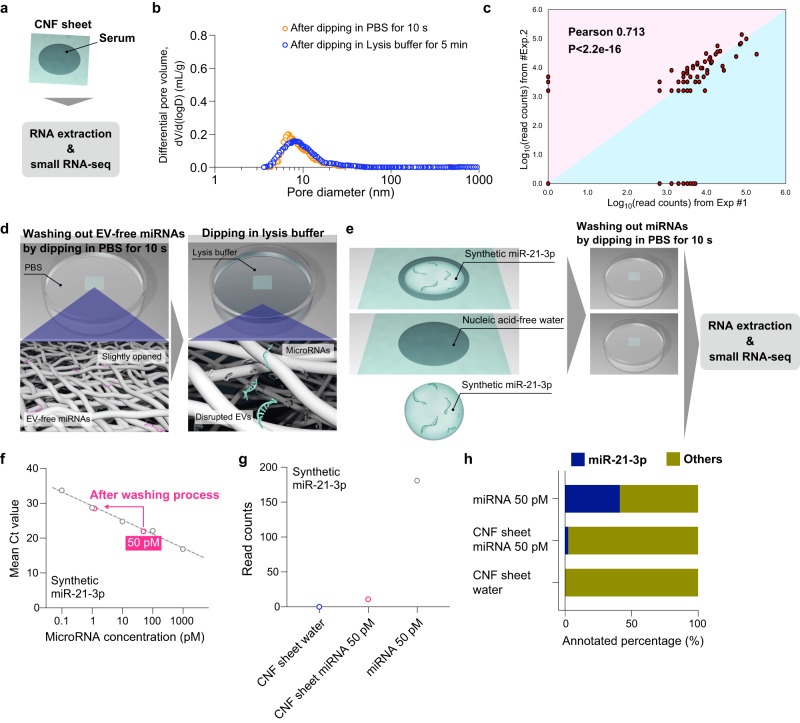
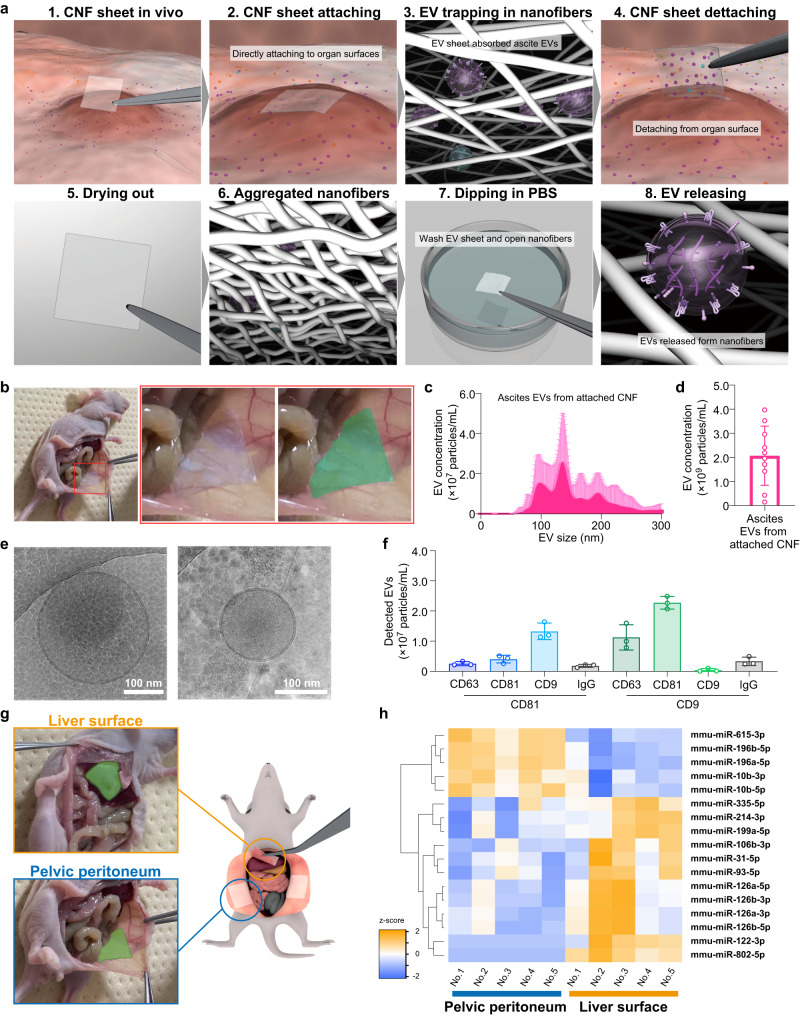
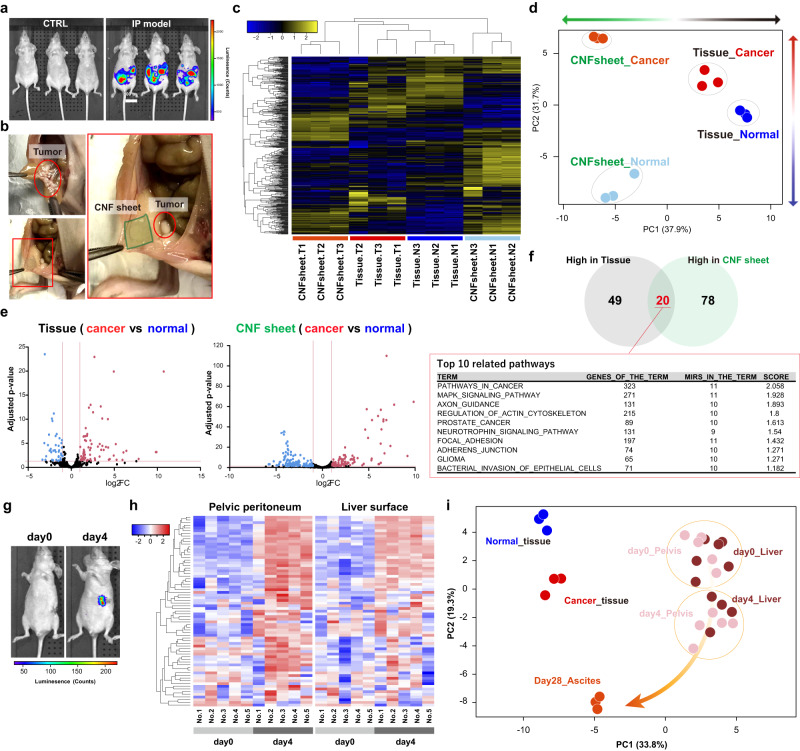
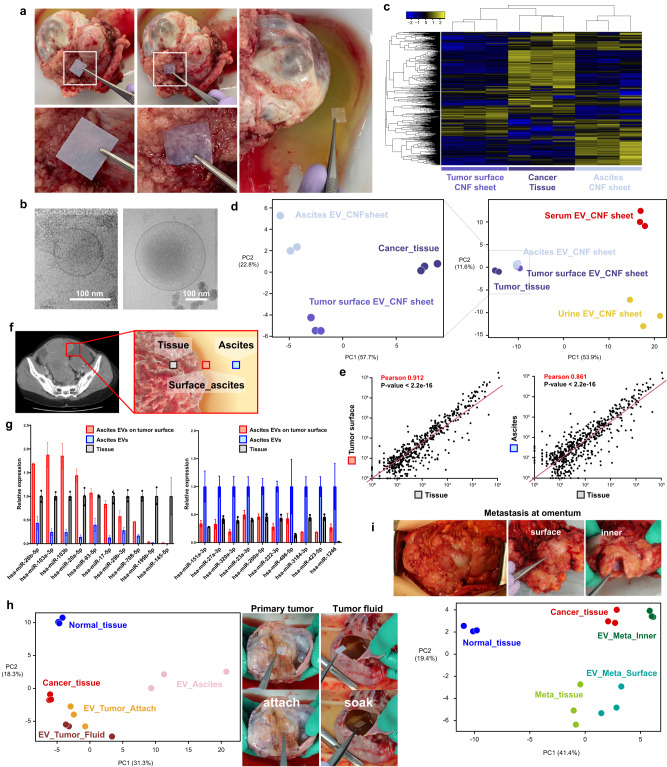
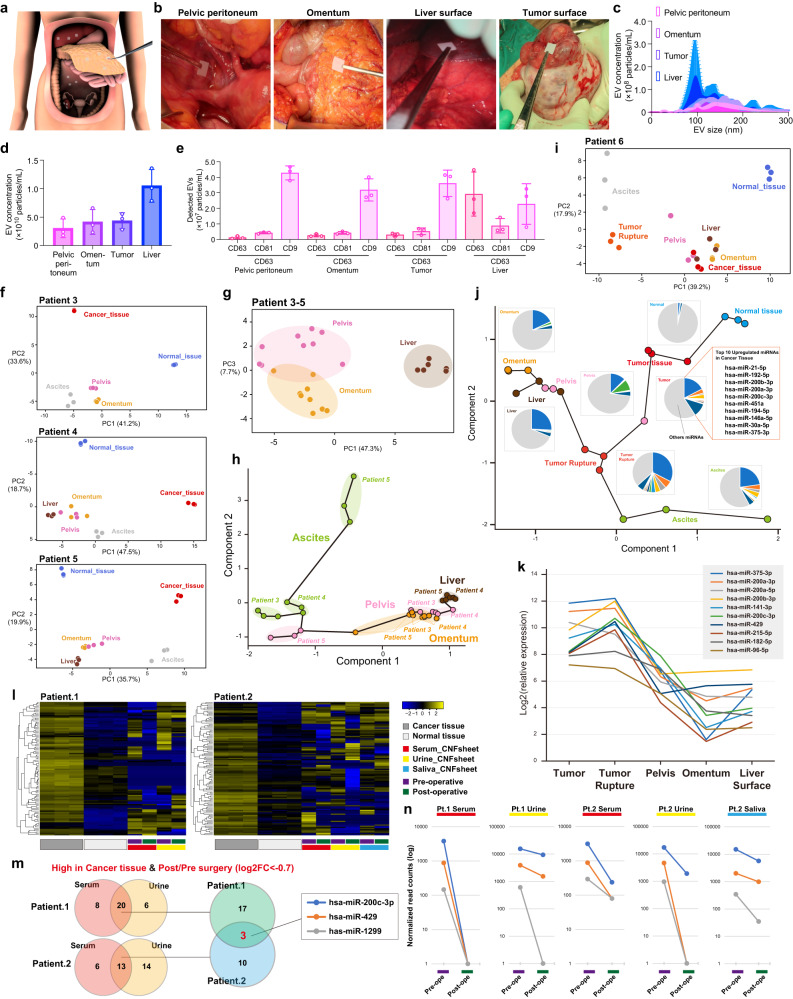
Extracellular vesicles (EVs), including exosomes, are recognized as promising functional targets involved in disease mechanisms. However, the intravital heterogeneity of EVs remains unclear, and the general limitation for analyzing EVs is the need for a certain volume of biofluids. Here, we present cellulose nanofiber (CNF) sheets to resolve these issues. We show that CNF sheets capture and preserve EVs from ~10 μL of biofluid and enable the analysis of bioactive molecules inside EVs. By attaching CNF sheets to moistened organs, we collect EVs in trace amounts of ascites, which is sufficient to perform small RNA sequence analyses. In an ovarian cancer mouse model, we demonstrate that CNF sheets enable the detection of cancer-associated miRNAs from the very early phase when mice did not have apparent ascites, and that EVs from different locations have unique miRNA profiles. By performing CNF sheet analyses in patients, we identify further location-based differences in EV miRNA profiles, with profiles reflecting disease conditions. We conduct spatial exosome analyses using CNF sheets to reveal that ascites EVs from cancer patients exhibit location-dependent heterogeneity. This technique could provide insights into EV biology and suggests a clinical strategy contributing to cancer diagnosis, staging evaluation, and therapy planning.


Conflict of interest statement

The authors declare no competing interests.

Figures

Fig. 1
Fig. 1. CNF sheets capture intact EVs.
a Conceptual diagram of the CNF operating principle and the corresponding FE-SEM image obtained using a saliva sample. The top row shows an overhead view of the CNF sheet, representing the supply of fluid by pipette, storage and drying for 7 days, washing by immersion in PBS for 10 s, and EVs removal by immersion in PBS for 5 min. The middle row shows a magnified view of CNFs. The bottom row shows SEM images during each experimental process when saliva was used. b Photograph of EV sheet (~3 inches in diameter) at the time of production (upper row), before use (middle row) cut into 1 cm squares, and after water absorption and drying (lower row). c Pore size distribution before supplying body fluids, after drying, after PBS washing for 10 s, and after PBS immersion for 5 min using the mercury intrusion method. d Size distribution of EVs recovered from 10 μL of serum using EV sheets. n = 10. e Size distribution of contaminants recovered from 0.22 μm-filtered PBS and EVs recovered from 10 μL of serum using EV sheets. Each dot indicates the respective data value, and error bars indicate SD of a series of measurements (n = 10). PBS indicates 10 µL of 0.22 µm-filtered PBS; serum indicates 10 µL of serum from ovarian cancer patients pipetted onto CNF sheets, dried, stored, washed, recovered, and measured by NTA. f A CryoEM image of EVs recovered from serum using CNF sheets. g Detection of CD63 with fluorescence-labeled antibody using a well plate and a plate reader. CD63 detection of contaminants recovered from 10 µL of 0.22 μm-filtered PBS (denoted as PBS) and EVs recovered from 10 µL of serum (denoted as serum EVs) using CNF sheets. arbitrary units (a.u.) (h) Exoview detection of EVs recovered from 10 µL of serum using CNF sheets. CD63, CD9, and CD81 below the line indicate captured antibodies, while CD63, CD9, CD81, and IgG above the line indicate detected antibodies. n = 10. ceg, h Data are presented as mean values with SD. Each experiment was repeated at least three times (ceg, h).
Fig. 2
Fig. 2. Small RNA sequencing for EVs in CNF sheets.
a Schematic illustrations of RNA extraction and small RNA-seq from serum. b Pore size distribution after PBS washing for 10 s and after lysis buffer immersion for 5 min. The experiment was repeated at least three times. c Dot plot of miRNA read counts from 2 independent small RNA-seq samples by using the same serum sample. d Conceptual illustrations of extracting EV-miRNAs from isolated EVs inside the CNF sheet. e Schematic illustrations of examination to check the efficiency of EV-free miRNA removal. f The qRT‒PCR results before supplying EV-free miRNAs and after lysis buffer immersion for 5 min. g The NGS read count results for the negative control (CNF sheet water), after lysis buffer immersion for 5 min (CNF sheet miRNA 50 pM), and before supplying EV-free miRNAs (miRNA 50 pM). h Annotated rate of EV-free miRNAs in the negative control (CNF sheet water), after lysis buffer immersion for 5 min (CNF sheet miRNA 50 pM), and before supplying EV-free miRNAs (miRNA 50 pM).
Fig. 3
Fig. 3. CNF sheet attachment method in vivo.
a Schematic illustrations of the CNF sheet attachment method. CNF sheets were directly attached to organ surfaces, where they absorbed ascites EVs. After detachment from the organ surface, the sheets were completely dried out, and the cellulose nanofibers were aggregated. CNF sheets were washed, and cellulose nanofibers were opened. Finally, the EVs were released from the CNF sheets. b Representative photos of CNF sheet attachment to the peroneal wall. c, d The size distribution and concentration obtained by nanoparticle tracking assays (NTAs) for mouse ascites EVs by using CNF sheets. n = 10. e Cryo-EM image of EVs recovered from CNF sheet EVs from mouse ascites. f Single-particle quantification was performed using the ExoView platform. n = 3 from independent mice. The numbers of detected EVs are displayed in bar charts. g Schematic illustrations of CNF sheet attachment sites at the liver surface or peritoneum. h A heatmap showing 17 differentially expressed miRNAs from CNF sheet EVs based on small RNA-seq. n = 5: EVs from the liver surface and n = 5: EVs from the peritoneum. Adjusted P-values < 0.05, |log2FC | > 1. c, df Data are presented as mean values with SD. Each experiment was repeated at least three times (c, df).
Fig. 4
Fig. 4. CNF sheet in ovarian cancer mouse models.
a Representative bioluminescence images of the ovarian cancer IP model by using IVIS. n = 3. b Illustrative photos of tumors, and CNF sheet attachment. c A heatmap showing the expression of 485 miRNAs from CNF sheet EVs based on small RNA-seq. CNF sheet T1-3 indicate CNF sheet EVs from tumor-bearing mouse ascites, and CNF sheet N1-3 indicates CNF sheet EVs from tumor-free control mouse ascites. Tissue samples T1-3 were from tumor tissues, and tissue samples N1-3 were from normal ovaries. d PCA mapping of miRNA expression from tissue miRNAs and CNF sheet miRNAs from ovarian cancer mouse models. e Volcano plots of differentially expressed miRNAs. Adjusted P-values < 0.05, |log2FC | > 1. f Venn diagrams show 20 overlapping miRNAs in tumor tissues and CNF sheet EVs in ascites and the results of pathway analysis using 20 miRNAs. g Representative bioluminescence images of the ovarian cancer orthotopic mouse model by using IVIS. h A heatmap showing differentially expressed miRNAs of CNF sheet EVs from the pelvic peritoneum or liver surface. n = 5 in each case, and the time points were days 0 and 4. i PCA mapping for miRNA expression by using CNF sheet EVs or tissues. Day 28_Ascites indicated an advanced-stage condition with spontaneous ascites accumulation.
Fig. 5
Fig. 5. CNF sheet analyses of ex vivo human tissue.
a Illustrative photos of CNF sheets attached to ex vivo human cancer tumors. The right 4 panels indicate CNF sheet attachment, and the left panel indicates CNF sheet soaking for ascites. b Cryo-EM image of EVs recovered from CNF sheet EVs on the tumor surface. c A heatmap showing differentially expressed miRNAs from CNF sheet EVs or tissues based on small RNA-seq. n = 3 each: tumor surface CNF sheet, ascites CNF sheet and cancer tissue. d PCA mapping of miRNA expression, n = 3 each: tumor surface CNF sheet, ascites CNF sheet cancer tissue, serum_ CNF and urine CNF sheet. e Dot plot showing the correlation of miRNA expression in tumor surface CNF sheets vs. cancer tissue and ascites CNF sheets and cancer tissue. f, g Schematic illustrations of the location of samples and bar charts represent relative miRNA expression. n = 3 from independent locations. Data are presented as mean values with SD. The values in the left graph were normalized to tissue miRNA expression, and those in the right graph were normalized to ascites EVs. n = 3 (h) PCA mapping and illustrative photos from patient 2 focusing on tumor fluid profiles. i PCA mapping and illustrative photos from patient 2 focusing on metastatic tumors in the greater omentum.
Fig. 6
Fig. 6. Intravital CNF sheet analysis reveals location heterogeneity of EVs.
a Schematic illustrations of the locations of CNF sheet attachment during surgery. b Illustrative photos of the locations of CNF sheet attachment, including the pelvic peritoneum, omentum, liver surface and tumor surface. n = 3 from independent locations. c, d The size distributions and concentrations obtained by nanoparticle tracking assays (NTAs) of CNF sheet EVs at the pelvic peritoneum, omentum, liver surface and tumor surface. n = 10 (e) Single-particle quantification was performed using the ExoView platform. The numbers of detected EVs are displayed in bar charts. f PCA mapping of miRNA expression from patients 3–5. Normal tissues indicate the contralateral ovarian tissue without cancer. g PCA mapping of miRNA expression in the peritoneum, omentum and liver of patients 3–5. h The mapping of trajectory analysis based on miRNA expression in the peritoneum, omentum and liver of patients 3–5. i PCA mapping of miRNA expression of patient 6. j The mapping of trajectory analysis based on miRNA expression of normal tissue, tumor tissue, CNF sheet EVs on ruptured tumor surface, peritoneum, omentum and liver of patient 6. Pie charts indicate the top 10 upregulated miRNAs in cancer tissues. k The line graph indicates the relative miRNA expression of the 10 upregulated miRNAs in cancer tissues in each sample. l Heatmaps of miRNA expression from patients 1 and 2, including pre- and postoperative serum-, urine- and saliva-derived CNF sheet EVs. According to the subsequent DEseq analyses, the adjusted P-values < 0.05, |log2FC | > 1, 102 miRNAs in patient 1 and 110 miRNAs in patient 2 were differentially expressed in cancer tissues compared to normal tissues. m Venn diagrams show the rationale for selecting 3 miRNAs as biomarker candidates. These values were high in cancer tissue, and the expression change from presurgery to postsurgery was defined as log2FC < −0.7. n Line graphs showing expression change from presurgery to postsurgery for 3 miRNAs. ce Data are presented as mean values with SD. Each experiment was repeated at least three times (ce).

References

    1. Valadi H, et al. Exosome-mediated transfer of mRNAs and microRNAs is a novel mechanism of genetic exchange between cells. Nat. Cell Biol. 2007;9:654–659. doi: 10.1038/ncb1596. - DOI - PubMed
    1. Thery C. Exosomes: secreted vesicles and intercellular communications. F1000 Biol. Rep. 2011;3:15. doi: 10.3410/B3-15. - DOI - PMC - PubMed
    1. Mathieu M, Martin-Jaular L, Lavieu G, Thery C. Specificities of secretion and uptake of exosomes and other extracellular vesicles for cell-to-cell communication. Nat. Cell Biol. 2019;21:9–17. doi: 10.1038/s41556-018-0250-9. - DOI - PubMed
    1. Colombo M, Raposo G, Thery C. Biogenesis, secretion, and intercellular interactions of exosomes and other extracellular vesicles. Annu. Rev. Cell Dev. Biol. 2014;30:255–289. doi: 10.1146/annurev-cellbio-101512-122326. - DOI - PubMed
    1. Tkach M, Kowal J, Thery C. Why the need and how to approach the functional diversity of extracellular vesicles. Philos. Trans. R Soc. Lond. B Biol. Sci. 2018;373:20160479. doi: 10.1098/rstb.2016.0479. - DOI - PMC - PubMed

Publication types