. 2023 Nov 8;14(1):7201.
doi: 10.1038/s41467-023-43072-x.

The alarmin IL33 orchestrates type 2 immune-mediated control of thymus regeneration

Affiliations

The alarmin IL33 orchestrates type 2 immune-mediated control of thymus regeneration

Emilie J Cosway et al. Nat Commun. .

Abstract

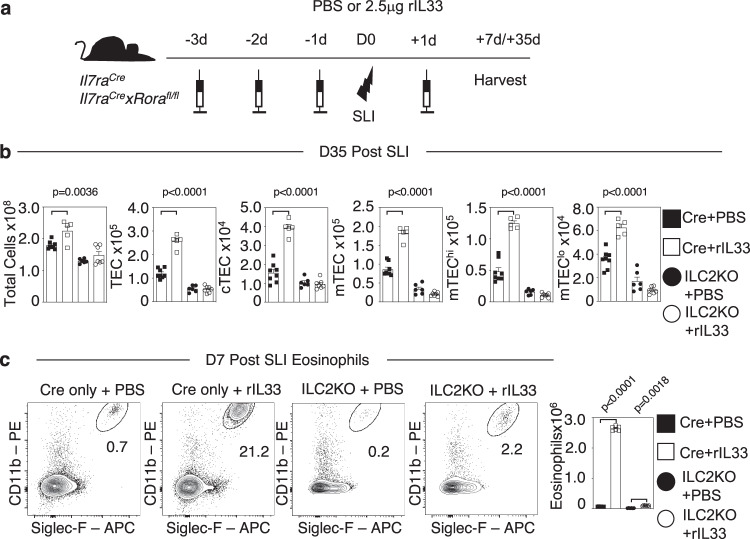
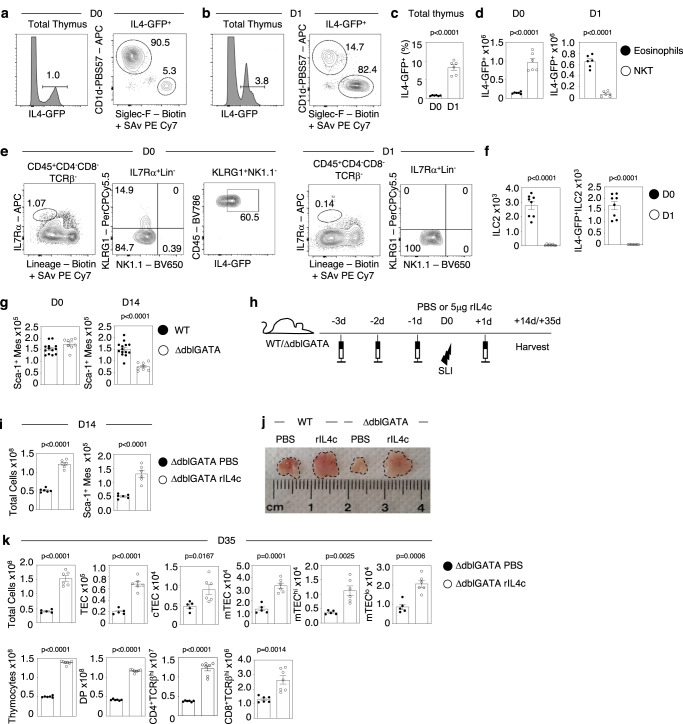
As the primary site of T-cell development, the thymus dictates immune competency of the host. The rates of thymus function are not constant, and thymus regeneration is essential to restore new T-cell production following tissue damage from environmental factors and therapeutic interventions. Here, we show the alarmin interleukin (IL) 33 is a product of Sca1+ thymic mesenchyme both necessary and sufficient for thymus regeneration via a type 2 innate immune network. IL33 stimulates expansion of IL5-producing type 2 innate lymphoid cells (ILC2), which triggers a cellular switch in the intrathymic availability of IL4. This enables eosinophil production of IL4 to re-establish thymic mesenchyme prior to recovery of thymopoiesis-inducing epithelial compartments. Collectively, we identify a positive feedback mechanism of type 2 innate immunity that regulates the recovery of thymus function following tissue injury.


Conflict of interest statement

The authors declare no competing interests.

Figures

Fig. 1
Fig. 1. Selective requirement for the alarmin IL33 in thymus regeneration.
Analysis of thymus regeneration (indicated TEC and thymocyte subsets) at 35 days post-SLI in WT (black circle) and either Il25−/ (a) or Il33−/− (b) (white circle) mice. For (a), TEC WT n = 6 and Il25−/− n = 7 and thymocytes WT and Il25−/ n = 6 animals over 2 independent experiments. For (b), TEC WT n = 6 and Il25−/− n = 7 and thymocytes WT and Il25−/ n = 7 animals over 2 independent experiments. All error bars show the mean ± SEM. P-values were obtained using two-tailed, unpaired Student’s t tests.
Fig. 2
Fig. 2. IL33 boosts thymus regeneration.
a Injection regime for the administration of recombinant IL33 (rIL33), 2.5μg/mouse/injection or PBS control. Three injections were given prior to sub-lethal irradiation (SLI) (1 × 425 rad) and one injection post-SLI exposure. Mice were harvested either 7 or 35 days after SLI. b Effects of IL33 administration on TEC recovery at 7 days post-SLI, and TEC and thymocyte recovery at 35 days post-SLI (c). For (b), PBS and rIL33 n = 8 animals obtained over 2 independent experiments. For (c), TEC PBS and rIL33 n = 6 and thymocytes PBS and rIL33 n = 8 animals obtained over 2 independent experiments. All bars show mean ± SEM. P-values were obtained using two-tailed, unpaired Student’s t tests.
Fig. 3
Fig. 3. IL25 does not enhance thymus regeneration.
a Injection regime for the administration of recombinant IL25 (rIL25), 2.5μg/mouse/injection or PBS control. Three injections were given prior to sub-lethal irradiation (SLI) (1 × 425 rad) and one injection post-SLI exposure. Mice were harvested either 7 or 35 days after SLI. b Effects of IL25 administration on TEC recovery at analysis 7 days post-SLI, and TEC and thymocyte recovery at 35 days post-SLI (c). For (b), PBS and rIL25 n = 8 animals obtained over 2 independent experiments. For (c), TEC PBS and rIL25 n = 8 and thymocytes PBS and rIL25 n = 8 animals obtained over 2 independent experiments. All bars show mean ± SEM. P-values were obtained using two-tailed, unpaired Student’s t tests.
Fig. 4
Fig. 4. IL33 Expands ILC2 In The Thymus.
a Injection regime for the administration of rIL33 or rIL25 in Red5xRagGFP mice, 2.5μg/mouse/injection or PBS control, four injections given. b Representative FACs plots, where n = 6, to illustrate ILC gating and effect of PBS/rIL33/rIL25 administration, total ILC are gated as CD45+RagGFPCD4CD8-TCRβ-IL7Rα+Lin cells, with ILC2 further identified as KLRG1+NK1.1 cells. c Quantitation of effects of rIL33 and rIL25 administration on total thymus cellularity, ILC2 and IL5+ILC2 in Red5xRagGFP mice. Significance is of rIL33 or rIL25 treatment compared to PBS controls, (n = 6 animals for each condition). All analysis was carried out across two independent experiments. All statistical analysis was obtained using one-way ANOVA with Dunnett’s multiple comparisons. All bars show mean ± SEM.
Fig. 5
Fig. 5. IL33 expands ILC2 To enable intrathymic expansion of eosinophils.
a Injection regime of Il7raCre (control) and Il7raCrexRoraf/fl mice with PBS or 2.5μg rIL33, with three injections prior to SLI (1 × 500 rad) and then one injection post-SLI. b Quantitation of TEC recovery (n = 5–7) in control and ILC2 KO mice at 35 days post-SLI following PBS or rIL33 treatment. c Thymic eosinophil numbers in control and ILC2 KO mice at day 7 post-SLI and following PBS or rIL33 treatment (n = 6 animals from 2 independent experiments). Statistical significance is shown comparing Il7raCre (Cre) PBS (n = 8 animals from 4 independent experiments) with Il7raCre (Cre) rIL33 (n = 5 animals from 4 independent experiments) or Il7raCrexRorafl/fl(ILC2KO) PBS (n = 6 animals from 4 independent experiments) with Il7raCrexRorafl/fl(ILC2KO) rIL33 (n = 7 animals from 3 independent experiments). Eosinophils were identified as CD45+CD4CD8-TCRβ-TER119CD11b+Siglec-F+. All statistical analysis was obtained using one-way ANOVA with Šídák’s multiple comparisons. All bars show mean ± SEM.
Fig. 6
Fig. 6. IL33 expression selectively maps to Sca1± thymic mesenchyme.
a Representative FACs plots illustrating the proportion of IL33cit expressing CD45+ thymic cells and total CD45- thymic stromal cells (blue histogram). Red histograms represent florescence levels in control WT mice. b Quantitation of IL33cit expression in defined thymic stromal populations; cTEC (CD45-EpCAM-1UEA1Ly51+), mTEC (CD45-EpCAM-1UEA1+Ly51), mTEChi (CD45-EpCAM-1UEA1+Ly51MHCII+CD80+), mTEClo(CD45-EpCAM-1-UEA1+Ly51MHCII-CD80), Endothelium (TER119CD45EpCAM-1CD31+), Mesenchyme (TER119CD45EpCAM-1CD31Integrinα7), Pericytes (TER119CD45EpCAM-1CD31Integrinα7+), (where n = 7 animals for TEC subsets and n = 5 animals for all other subsets, obtained from 2 independent experiments). c Representative FACs plots showing Sca-1 expression in thymic mesenchyme, and IL33cit expression within Sca-1+ and Sca-1 subsets. Blue histograms are from IL33cit mice, red histograms from control WT mice. d Total thymus cellularity, Sca-1+ mesenchyme numbers/proportions in WT mice following SLI exposure at indicated time points (n = 6 animals obtained from 2 independent experiments) with statistical analysis from a one-way ANOVA comparing means of each group to D0 with Dunnett’s multiple comparisons. e Comparative analysis of TEC (blue line) and Sca-1+ mesenchyme (red line) recovery at indicated time points in WT mice (n = 6 animals obtained from 2 independent experiments). f FACs plots showing IL4Rα expression in Sca-1+ mesenchyme from WT (blue histogram) mice, where against Il4ra−/− mice (red histogram) were used for control staining levels. g Quantitation of Sca1+ mesenchyme in WT and Il4ra−/− mice at steady state (D0) (WT n = 5 and Il4ra−/− n = 6 animals obtained from 2 independent experiments), from a two-tailed unpaired Student’s t test. h Injection and irradiation regime of 5μg recombinant IL4-complexes/PBS into WT mice. Analysis of Sca-1+ mesenchyme was performed at day 7 and day 14 after injection regime, n = 6 minimum. i Numbers of Sca-1+ thymic mesenchyme cells at day 7 and day 14 post-SLI following PBS (D7 n = 6 and D14 n = 7 animals) or IL4c (D7 n = 7 and D14 n = 7 animals) injection, obtained from 2 independent experiments. Statistics from a two-tailed unpaired Student’s t test. All analysis was carried out across at least two independent experiments. All error bars show mean ± SEM.
Fig. 7
Fig. 7. Eosinophil production of IL4 controls thymus regeneration.
a Representative FACs of total thymus cells from IL4GFP mice, with analysis of CD1d-PBS57 tetramer and Siglec-F expression shown in GFP cells at D0 (a) and D1 post-SLI (b). c, d Show quantitation of total IL4GFP, eosinophils and NKT cells within thymus at day 0 and day 1 post-SLI, n = 6 animals obtained from 2 independent experiments. e Representative FACs plots identifying ILC2 in thymus of IL4-GFP mice at D0 and D1 post-SLI. f Quantitation of ILC2 and IL4-GFP+ ILC2 in thymus of IL4-GFP mice D0 (black circle) and D1 post SLI (white circle), n = 8 animals obtained from 2 independent experiments. g Quantitation of Sca-1+ mesenchyme in WT (black circle) and ΔdblGATA (white circle) mice at day 0 (WT n = 13 from 4 independent experiments, ΔdblGATA n = 8 from 2 independent experiments) and day 14 (WT n = 14 from 4 independent experiments, ΔdblGATA n = 8 from 2 independent experiments) post-SLI. h Injection regime of PBS or 5μg rIL4-complex into WT/ΔdblGATA mice, three injections prior to SLI and one after, mice harvested 14 days or 35 days post-SLI. i Analysis day 14 post-SLI of Sca-1+ mesenchyme in ΔdblGATA injected as (h) (n = 6 animals obtained from 2 independent experiments). j Images show gross thymus size at day 35 post-SLI in WT and ΔdblGATA mice injected with either PBS or rIL4c. k Analysis at day 35 post-SLI of total thymus cellularity, and TEC and thymocyte subsets in ΔdblGATA mice following either PBS (black circle) or IL4c injection (white circle), where for TEC analysis PBS n = 5 and IL4c n = 6 and for thymocyte analysis PBS n = 6 and IL4c n = 7 obtained from 2 independent experiments. Statistical analysis was performed using a two-tailed unpaired Student’s t test. All significance shows mean ± SEM.

References

    1. Ohigashi I, Matsuda-Lennikov M, Takahama Y. Peptides for T cell selection in the thymus. Peptides. 2021;146:170671. doi: 10.1016/j.peptides.2021.170671. - DOI - PMC - PubMed
    1. Singer A, Adoro S, Park JH. Lineage fate and intense debate: myths, models and mechanisms of CD4- versus CD8-lineage choice. Nat. Rev. Immunol. 2008;8:788–801. doi: 10.1038/nri2416. - DOI - PMC - PubMed
    1. Alawam AS, et al. Failures in thymus medulla regeneration during immune recovery cause tolerance loss and prime recipients for auto-GVHD. J. Exp. Med. 2022;219:e20211239. doi: 10.1084/jem.20211239. - DOI - PMC - PubMed
    1. Han J, Zuniga-Pflucker JC. A 2020 view of thymus stromal cells in T cell development. J. Immunol. 2021;206:249–256. doi: 10.4049/jimmunol.2000889. - DOI - PMC - PubMed
    1. Ohigashi I, Kozai M, Takahama Y. Development and developmental potential of cortical thymic epithelial cells. Immunol. Rev. 2016;271:10–22. doi: 10.1111/imr.12404. - DOI - PubMed

Publication types