. 2023 Nov 8;14(1):6764.
doi: 10.1038/s41467-023-42327-x.

Inflammation in the tumor-adjacent lung as a predictor of clinical outcome in lung adenocarcinoma

Affiliations

Inflammation in the tumor-adjacent lung as a predictor of clinical outcome in lung adenocarcinoma

Igor Dolgalev et al. Nat Commun. .

Abstract

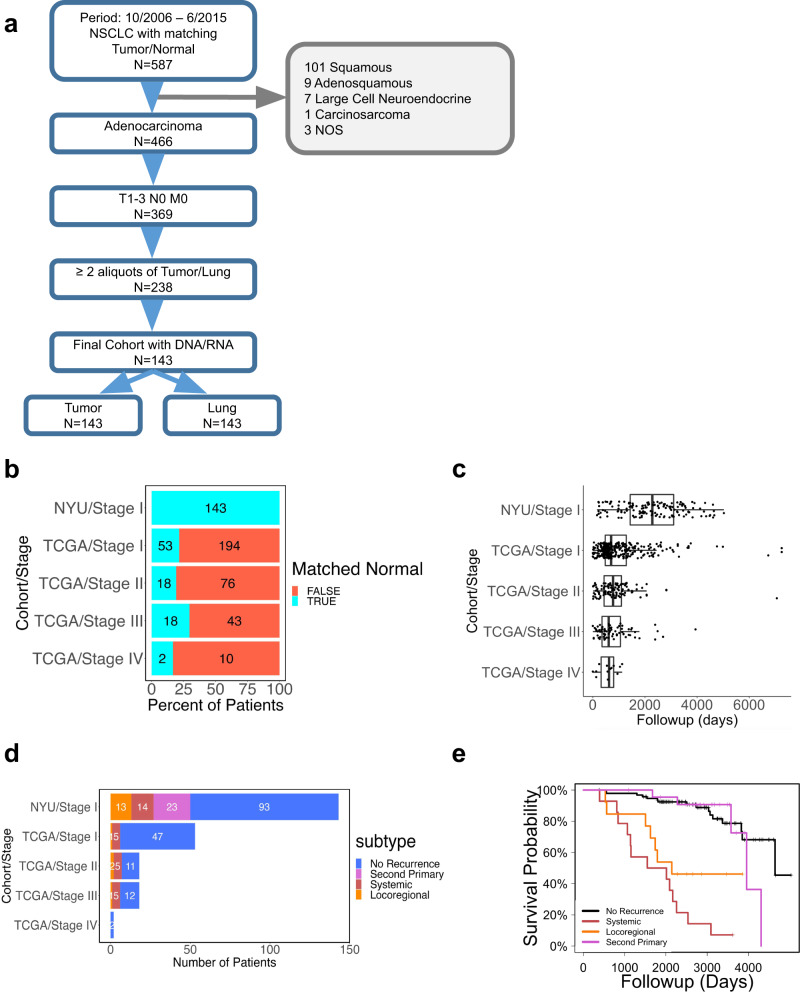
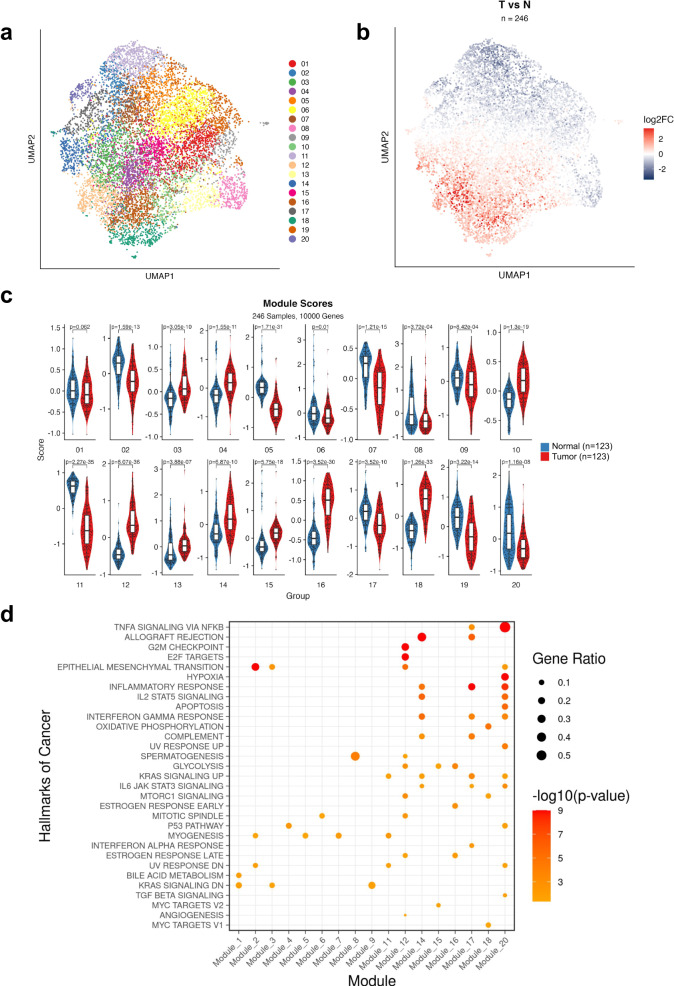
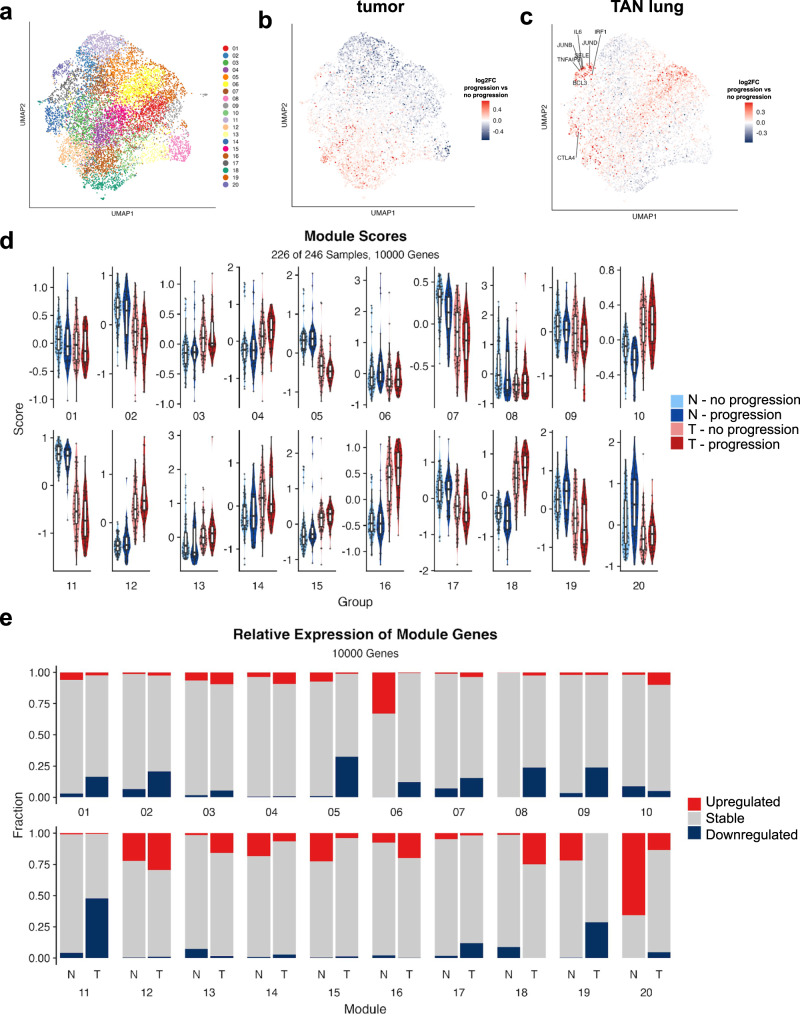
Approximately 30% of early-stage lung adenocarcinoma patients present with disease progression after successful surgical resection. Despite efforts of mapping the genetic landscape, there has been limited success in discovering predictive biomarkers of disease outcomes. Here we performed a systematic multi-omic assessment of 143 tumors and matched tumor-adjacent, histologically-normal lung tissue with long-term patient follow-up. Through histologic, mutational, and transcriptomic profiling of tumor and adjacent-normal tissue, we identified an inflammatory gene signature in tumor-adjacent tissue as the strongest clinical predictor of disease progression. Single-cell transcriptomic analysis demonstrated the progression-associated inflammatory signature was expressed in both immune and non-immune cells, and cell type-specific profiling in monocytes further improved outcome predictions. Additional analyses of tumor-adjacent transcriptomic data from The Cancer Genome Atlas validated the association of the inflammatory signature with worse outcomes across cancers. Collectively, our study suggests that molecular profiling of tumor-adjacent tissue can identify patients at high risk for disease progression.


Conflict of interest statement

A.T. is a scientific advisor to Intelligencia AI. The remaining authors declare no competing interests.

Figures

Fig. 1
Fig. 1. Study design and cohort characteristics.
a CONSORT diagram. b Availability of matched tumor-adjacent normal lung patient samples in the NYU and TCGA cohorts. c Patient follow-up distribution in NYU Stage I (n = 145) cohort and in stage-specific TCGA cohorts (Stage I: n = 300, Stage II: n = 112, Stage III: n = 79, Stage IV: n = 14). Boxplots show medians (horizontal line in each box), interquartile ranges (boxes), 1.5 interquartile (whiskers) and each point represents a patient. d Number of patients with available matched normal lung samples by progression type across the NYU and TCGA cohorts. e Overall survival (OS) of patients with recurrence (systemic, locoregional) or second primary tumors.
Fig. 2
Fig. 2. Multi-omic profiling of matched tumor-normal stage I lung adenocarcinomas.
a Oncoprint of frequently mutated genes in the tumor samples (type T stands for tumor). b Kaplan–Meier progression-free survival (K-M PFS) plots comparing patients with and without KRAS mutation. c K-M PFS plots comparing patients with and without STK11 mutation. d ROC curve and AUC of prediction of 5-year recurrence based on patient TMB values. e ROC curves of elastic net model built on top-200 highly variable genes in tumor to predict 5-year recurrence. 95% confidence intervals was also shown in gray. f ROC curves of elastic net model built on top-200 highly variable genes in tumor-adjacent normal (TAN) tissue to predict 5-year recurrence. 95% confidence intervals was also shown in gray.
Fig. 3
Fig. 3. Gene co-expression modules in tumor and tumor-adjacent normal tissue.
a UMAP representation of 20 gene co-expression modules—each point on the map corresponds to a gene. b UMAP representation annotated by log-fold change tumor vs TAN for each genes on the map. c Boxplots comparing modules scores in tumor and TAN samples in each module. Boxplots show medians (horizontal line in each box), interquartile ranges (boxes), 1.5 interquartile (whiskers) and each point represents a patient. The p-values are calculated using two-sided Wilcoxon rank sum test. d Dot plot of enriched hallmarks across modules (module 10, 13, and 19 have no highly significant associations). The p-values are calculated using Fisher’s exact test (one-tailed) and they are adjusted using False Discovery Rate (FDR).
Fig. 4
Fig. 4. Gene co-expression modules in lung adenocarcinoma progression.
a UMAP representation of 20 gene co-expression modules. b UMAP representation annotated by log-fold change progression (red color) vs no progression (blue color) in tumor samples. c UMAP representation annotated by log-fold change progression (red color) vs no progression (blue color) in normal samples. d Boxplots comparing modules scores by progression status in tumor (T) and normal (N) tissue in each module. Boxplots show medians (horizontal line in each box), interquartile ranges (boxes), 1.5 interquartile (whiskers) and each point represents a patient. e Percentages of up- and downregulated genes (progression vs no progression) in tumor (T) and tumor-adjacent normal (N) tissue in each module.
Fig. 5
Fig. 5. Association of module scores in tumor-adjacent normal tissue with different variables.
a Positive and negative associations of demographic, clinical, histologic, genetic and outcomes with module scores in TAN tissue. Pearson and spearman correlation tests were done for continuous and categorical variables separately. b Kaplan–Meier progression-free survival curve for patients with high (n = 62) and low (n = 61) module 20 scores in TAN tissue. 95% confidence interval was also shown in shaded blue and red. c Multi-variate modeling of time-to-progression (n = 123), log of odds ratio and data are presented as mean values with 95% confidence intervals, p-values are calculated based on Wald test for each variable. d Dot plot of c-index values between module scores and outcome (overall-survival (OS), progression-free survival (PFS) and recurrence-free survival (RFS)) per module in TCGA cohorts grouped by tissue type (non-adjusted).
Fig. 6
Fig. 6. Single-nucleus RNA-seq analysis of tumor-adjacent normal tissue.
a UMAP visualization of all 51,416 adjacent normal nuclei, color-coded based on the broad cell type annotation. b UMAP visualization of all 51,416 adjacent normal nuclei, color-coded based on the cell subtype annotation. c UMAP colored by module 20 score (calculated per nucleus). d Percentage of cells with a positive module 20 score in each cell subtype. e Cell subtypes with significantly upregulated expression of the module 20 signature in patients that eventually progress; statistical significance is calculated using the Mann–Whitney U test (two-sided; the Holm method was used to adjust p-values). Boxplots show medians (horizontal line in each box), interquartile ranges (boxes), 1.5 interquartile (whiskers) and each point represents a patient. f Kaplan–Meier curve for disease-free survival using the monocytes expression profile to calculate module 20 high (n = 62) and low (n = 61) groups. 95% confidence interval was also shown in shaded blue and red. P-value determined by the log-rank test.

References

    1. Wu CF, et al. Recurrence risk factors analysis for stage I non-small cell lung cancer. Medicine. 2015;94:e1337. - PMC - PubMed
    1. Moreira AL, et al. A grading system for invasive pulmonary adenocarcinoma: a proposal from the International Association for the Study of Lung Cancer Pathology Committee. J. Thorac. Oncol. 2020;15:1599–1610. - PMC - PubMed
    1. Luo J, et al. Solid predominant histologic subtype and early recurrence predict poor postrecurrence survival in patients with stage I lung adenocarcinoma. Oncotarget. 2017;8:7050–7058. - PMC - PubMed
    1. Wang X, et al. Prediction of recurrence in early stage non-small cell lung cancer using computer extracted nuclear features from digital H&E images. Sci. Rep. 2017;7:13543. - PMC - PubMed
    1. Yu K-H, et al. Predicting non-small cell lung cancer prognosis by fully automated microscopic pathology image features. Nat. Commun. 2016;7:12474. - PMC - PubMed

Publication types