Meta-Analysis
. 2023 Nov 8;13(1):19374.
doi: 10.1038/s41598-023-45942-2.

Drought-responsive genes in tomato: meta-analysis of gene expression using machine learning

Affiliations
Meta-Analysis

Drought-responsive genes in tomato: meta-analysis of gene expression using machine learning

Rabiul Haq Chowdhury et al. Sci Rep. .

Abstract

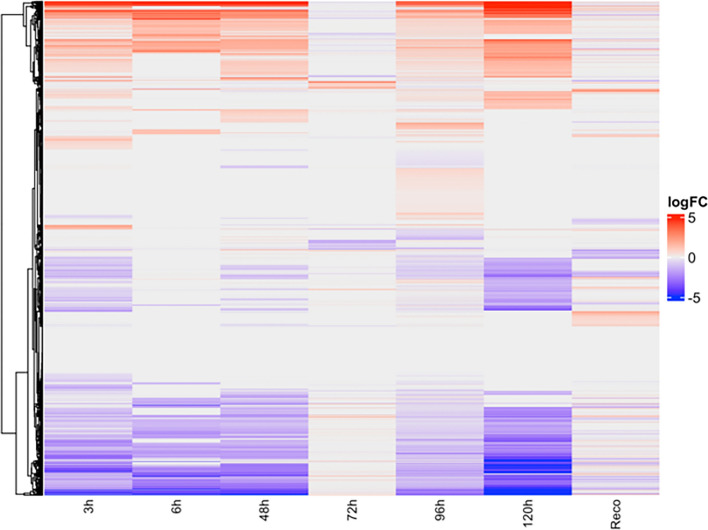
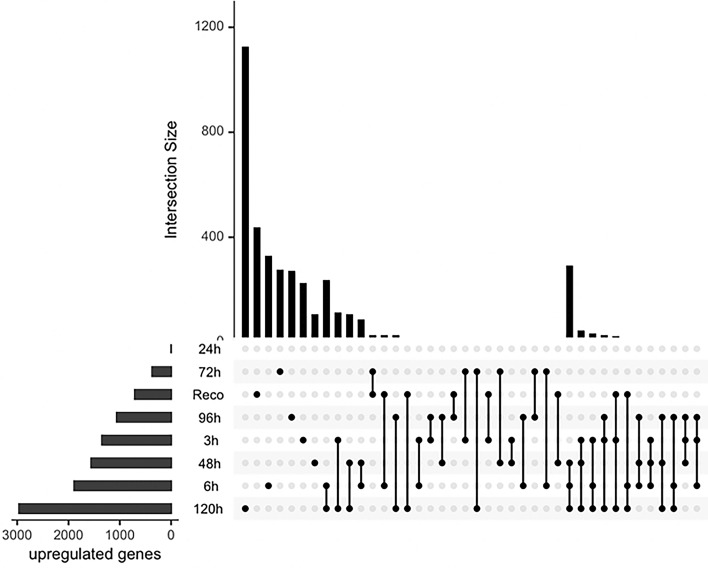
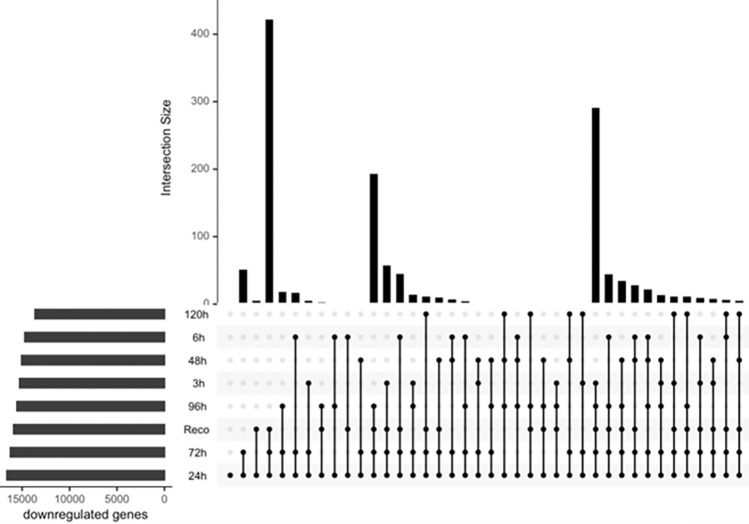
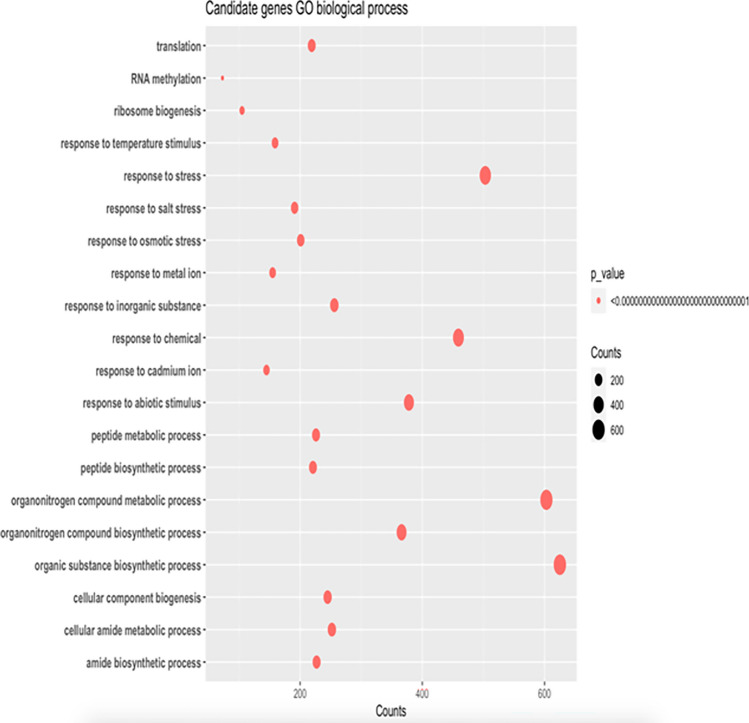
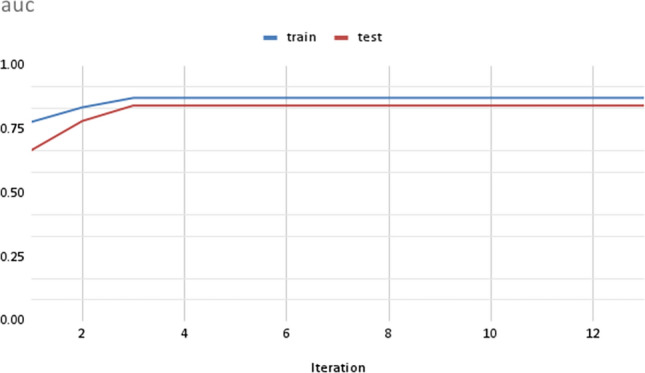
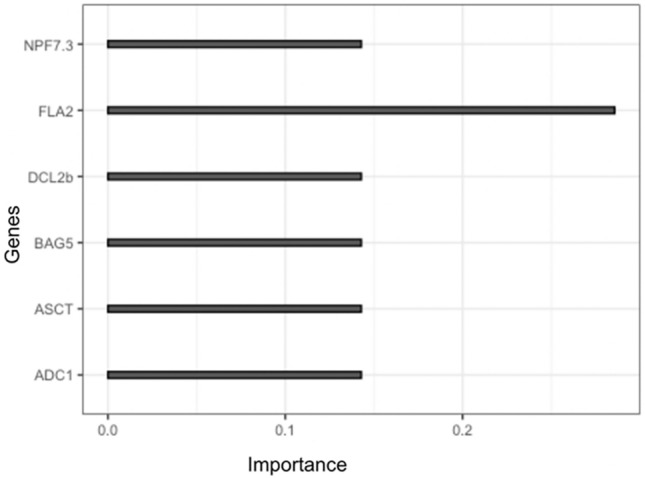
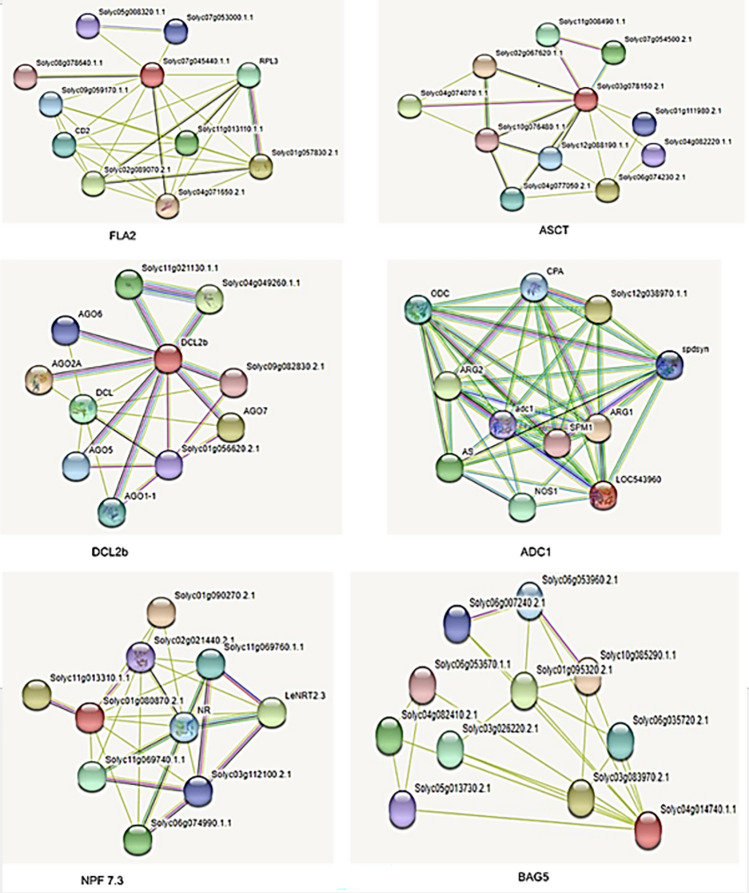
Plants have diverse molecular mechanisms to protect themselves from biotic and abiotic stressors and adapt to changing environments. To uncover the genetic potential of plants, it is crucial to understand how they adapt to adverse conditions by analyzing their genomic data. We analyzed RNA-Seq data from different tomato genotypes, tissue types, and drought durations. We used a time series scale to identify early and late drought-responsive gene modules and applied a machine learning method to identify the best responsive genes to drought. We demonstrated six candidate genes of tomato viz. Fasciclin-like arabinogalactan protein 2 (FLA2), Amino acid transporter family protein (ASCT), Arginine decarboxylase 1 (ADC1), Protein NRT1/PTR family 7.3 (NPF7.3), BAG family molecular chaperone regulator 5 (BAG5) and Dicer-like 2b (DCL2b) were responsive to drought. We constructed gene association networks to identify their potential interactors and found them drought-responsive. The identified candidate genes can help to explore the adaptation of tomato plants to drought. Furthermore, these candidate genes can have far-reaching implications for molecular breeding and genome editing in tomatoes, providing insights into the molecular mechanisms that underlie drought adaptation. This research underscores the importance of the genetic basis of plant adaptation, particularly in changing climates and growing populations.


Conflict of interest statement

The authors declare no competing interests.

Figures

Figure 1
Figure 1
Flow chart showing the transcriptomics data collection. The samples mean the number of records are retrieved from the databases.
Figure 2
Figure 2
Heatmap showing differentially expressed genes under drought stress in different time series data. logFC was calculated by comparing respective controls. The red color in the heatmap denotes upregulation and the blue color denotes downregulation. The Y-axis denotes the differentially expressed genes.
Figure 3
Figure 3
Upset plot showing differentially expressed upregulated gene numbers under drought stress in different time series data. Vertical bars show the unique upregulated genes per time point. Horizontal bars display the total number of upregulated genes per time point. Dots connecting time points denote the unique upregulated genes to respective time points.
Figure 4
Figure 4
Upset plot showing differentially expressed downregulated genes under drought stress in different time series data. Vertical bars show the unique downregulated genes per time point. Horizontal bars display the total number of downregulated genes per time point. Dots connecting time points denote the unique downregulated genes to respective time points.
Figure 5
Figure 5
Functions of differentially expressed genes predicted from GO term of Tomato genome. X-axis shows the number of differentially expressed genes involved in the functions displayed in y-axis. The size of the points in the plot denotes the p-value.
Figure 6
Figure 6
Plot showing the “auc” value for training data and test data sets over iterations.
Figure 7
Figure 7
Candidate genes and their importance scores for drought response. The importance scores were obtained from machine learning models.
Figure 8
Figure 8
Interaction network for candidate genes. The red color nodes in the network correspond to the protein of the respective candidate genes. Purple edges signify experimentally determined interactions, turquoise edges indicate information extracted from curated databases. Green edges represent neighborhood genes, red edges denote gene fusion, dark blue edges signify gene co-occurrence, light green edges are indicative of text mining, black edges indicate co-expression between nodes, and light blue edges signify protein homology.

References

    1. Bergougnoux V. The history of tomato: From domestication to biopharming. Biotechnol. Adv. 2014;32:170–189. doi: 10.1016/j.biotechadv.2013.11.003. - DOI - PubMed
    1. Hayat S, Hasan SA, Fariduddin Q, Ahmad A. Growth of tomato (Lycopersicon esculentum) in response to salicylic acid under water stress. J. Plant Inter. 2008;3:297–304. doi: 10.1080/17429140802320797. - DOI
    1. Kosová K, Vítámvás P, Prášil IT, Renaut J. Plant proteome changes under abiotic stress—Contribution of proteomics studies to understanding plant stress response. J. Proteom. 2011;74:1301–1322. doi: 10.1016/j.jprot.2011.02.006. - DOI - PubMed
    1. Osakabe Y, Osakabe K, Shinozaki K, Tran LS. Response of plants to water stress. Front. Plant Sci. 2014;5:86. doi: 10.3389/fpls.2014.00086. - DOI - PMC - PubMed
    1. Biehler K, Fock H. Evidence for the contribution of the Mehler-peroxidase reaction in dissipating excess electrons in drought-stressed wheat. Plant Physiol. 1996;112:265–272. doi: 10.1104/pp.112.1.265. - DOI - PMC - PubMed

Publication types