. 2022 Apr 20;2(1):39.
doi: 10.1038/s43705-022-00120-9.

Farm-scale differentiation of active microbial colonizers

Affiliations

Farm-scale differentiation of active microbial colonizers

William L King et al. ISME Commun. .

Abstract

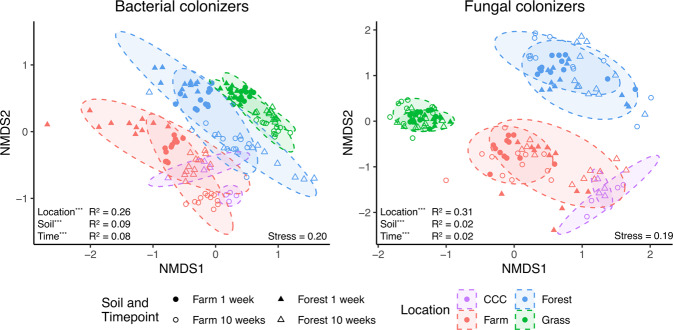
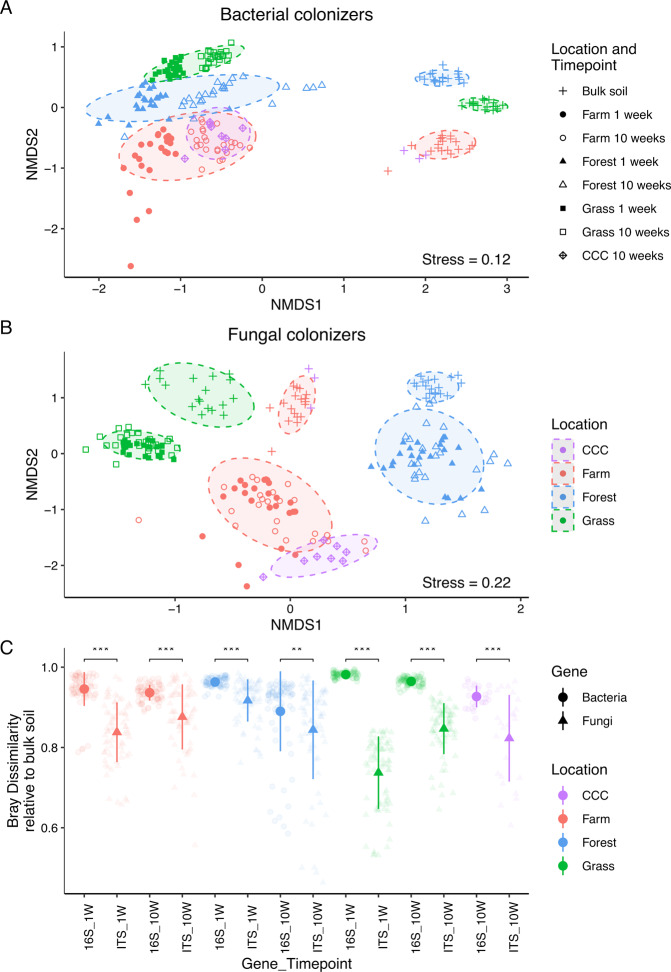
Microbial movement is important for replenishing lost soil microbial biodiversity and driving plant root colonization, particularly in managed agricultural soils, where microbial diversity and composition can be disrupted. Despite abundant survey-type microbiome data in soils, which are obscured by legacy DNA and microbial dormancy, we do not know how active microbial pools are shaped by local soil properties, agricultural management, and at differing spatial scales. To determine how active microbial colonizers are shaped by spatial scale and environmental conditions, we deployed microbial traps (i.e. sterile soil enclosed by small pore membranes) containing two distinct soil types (forest; agricultural), in three neighboring locations, assessing colonization through 16S rRNA gene and fungal ITS amplicon sequencing. Location had a greater impact on fungal colonizers (R2 = 0.31 vs. 0.26), while the soil type within the microbial traps influenced bacterial colonizers more (R2 = 0.09 vs. 0.02). Bacterial colonizers showed greater colonization consistency (within-group similarity) among replicate communities. Relative to bacterial colonizers, fungal colonizers shared a greater compositional overlap to sequences from the surrounding local bulk soil (R2 = 0.08 vs. 0.29), suggesting that these groups respond to distinct environmental constraints and that their in-field management may differ. Understanding how environmental constraints and spatial scales impact microbial recolonization dynamics and community assembly are essential for identifying how soil management can be used to shape agricultural microbiomes.


Conflict of interest statement

The authors declare no competing interests.

Figures

Fig. 1
Fig. 1. Non-metric multidimensional scaling (NMDS) ordinations of active bacterial (16S rRNA gene) and fungal (ITS) colonizer composition.
Samples are colored by location and deployed soil type are different shapes. CCC is the organically managed agricultural field and only includes the 10-week timepoint. 90 % ellipses on the locations are shown. The two individual timepoints are shown as solid or hollow shapes. Ordinations separated by deployed soil type and timepoint are displayed as Supplementary Fig. 2. *** is p ≤ 0.001.
Fig. 2
Fig. 2. Dot plot to identify how scale impacts active colonizers.
Data are Bray–Curtis dissimilarities of replicates within-site, across-sites (between transects within a location) and across locations (between locations within a transect). Lower on the y-axis means greater similarity. Data are mean ± standard deviation. Samples from the CCC organically managed agricultural field were included in within-site and across-location comparisons, but not across-site as only one microbial trap (i.e. one transect) was deployed as a reference plot.
Fig. 3
Fig. 3. Active microbial colonizer ordinations and Bray-dissimilarities relative to bulk soil.
NMDS ordinations of active microbial colonizer and local bulk soil microbial composition (Panels A, B). Samples are colored by location, with shapes representing different soil sources. The two individual timepoints are shown as solid or hollow shapes. Panel C is a dot plot of Bray–Curtis dissimilarity values of local bulk soil relative to recolonized soil at each location and timepoint. Data are mean ± standard deviation. Only comparisons within a transect were chosen because of the transect-level influence on active colonizers. Statistical comparisons were performed per location (Supplementary Table 10) and comparisons between microbial composition at individual timepoints are displayed. Lower on the y-axis means greater similarity between recolonized and local bulk soil. Q values: *** = ≤0.001, ** = ≤0.01, * = ≤0.05.

References

    1. Blagodatskaya E, Kuzyakov Y. Active microorganisms in soil: critical review of estimation criteria and approaches. Soil Biol Biochem. 2013;67:192–211. doi: 10.1016/j.soilbio.2013.08.024. - DOI
    1. Jones SE, Lennon JT. Dormancy contributes to the maintenance of microbial diversity. Proc Natl Acad Sci USA. 2010;107:5881. doi: 10.1073/pnas.0912765107. - DOI - PMC - PubMed
    1. Lennon JT, Jones SE. Microbial seed banks: the ecological and evolutionary implications of dormancy. Nat Rev Microbiol. 2011;9:119–30. doi: 10.1038/nrmicro2504. - DOI - PubMed
    1. Couradeau E, Sasse J, Goudeau D, Nath N, Hazen TC, Bowen BP, et al. Probing the active fraction of soil microbiomes using BONCAT-FACS. Nat Commun. 2019;10:2770. doi: 10.1038/s41467-019-10542-0. - DOI - PMC - PubMed
    1. Carini P, Marsden PJ, Leff JW, Morgan EE, Strickland MS, Fierer N. Relic DNA is abundant in soil and obscures estimates of soil microbial diversity. Nat Microbiol. 2016;2:16242. doi: 10.1038/nmicrobiol.2016.242. - DOI - PubMed