. 2023 Nov;623(7987):608-615.
doi: 10.1038/s41586-023-06704-2. Epub 2023 Nov 8.

Latent human herpesvirus 6 is reactivated in CAR T cells

Affiliations

Latent human herpesvirus 6 is reactivated in CAR T cells

Caleb A Lareau et al. Nature. 2023 Nov.

Abstract

Cell therapies have yielded durable clinical benefits for patients with cancer, but the risks associated with the development of therapies from manipulated human cells are understudied. For example, we lack a comprehensive understanding of the mechanisms of toxicities observed in patients receiving T cell therapies, including recent reports of encephalitis caused by reactivation of human herpesvirus 6 (HHV-6)1. Here, through petabase-scale viral genomics mining, we examine the landscape of human latent viral reactivation and demonstrate that HHV-6B can become reactivated in cultures of human CD4+ T cells. Using single-cell sequencing, we identify a rare population of HHV-6 'super-expressors' (about 1 in 300-10,000 cells) that possess high viral transcriptional activity, among research-grade allogeneic chimeric antigen receptor (CAR) T cells. By analysing single-cell sequencing data from patients receiving cell therapy products that are approved by the US Food and Drug Administration2 or are in clinical studies3-5, we identify the presence of HHV-6-super-expressor CAR T cells in patients in vivo. Together, the findings of our study demonstrate the utility of comprehensive genomics analyses in implicating cell therapy products as a potential source contributing to the lytic HHV-6 infection that has been reported in clinical trials1,6-8 and may influence the design and production of autologous and allogeneic cell therapies.


Conflict of interest statement

Competing interests A.T.S. is a founder of Immunai and Cartography Biosciences and receives research funding from Allogene Therapeutics and Merck Research Laboratories. C.A.L. and L.S.L. are consultants to Cartography Biosciences. N.J.H. is a consultant for Constellation Pharmaceuticals. C.J.W. holds equity in BioNTech Inc and receives research funding from Pharmacyclics. G.G. receives research funds from IBM and Pharmacyclics, and is a founder of, consultant for and holder of private equity in Scorpion Therapeutics. M.V.M. is an inventor on patents related to CAR T cell therapies held by the University of Pennsylvania (some licensed to Novartis), holds equity in TCR2, Century Therapeutics, Genocea, Oncternal and Neximmune, has served as a consultant for multiple companies involved in cell therapies, receives research support from KitePharma and Moderna, and serves on the Board of Directors of 2Seventy Bio. M.J.K. has received research funding from Kite, a Gilead Company, as well as honoraria from Kite, a Gilead Company, Novartis, Takeda, Miltenyi Biotec, BMS/Celgene, Beigene and Adicet Bio. S.G. is a co-inventor on patent applications in the fields of cell or gene therapy for cancer, a consultant for TESSA Therapeutics and a member of the Data and Safety Monitoring Board of Immatics, and has received honoraria from Tidal, Catamaran Bio, Sanofi and Novartis within the past 2 years. J.C.C. and P.G.T. are named on patent applications in the fields of T cell or gene therapy for cancer. G.Y., J.P., R.S., W.L., A.S., A.M., Z.J.R., T.P. and H.D. are employees and shareholders of Allogene Therapeutics. A.K. is a scientific cofounder of Ravel Biotechnology Inc., is on the scientific advisory board of PatchBio Inc., SerImmune Inc., AINovo Inc., TensorBio Inc. and OpenTargets, is a consultant with Illumina Inc. and owns shares in DeepGenomics Inc., Immunai Inc. and Freenome Inc. R.G.M. is a cofounder of and holds equity in Link Cell Therapies and CARGO Therapeutics, and is a consultant for Lyell Immunopharma, NKarta, Arovella Pharmaceuticals, Innervate Radiopharmaceuticals, Aptorum Group, Gadeta, FATE Therapeutics (Data and Safety Monitoring Board) and Waypoint Bio. All other authors declare no competing interests.

Figures

Extended Data Fig. 1 |
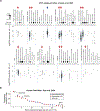
Extended Data Fig. 1 |. Characterization of OX40 and CD21 gene expression in bulk sequencing experiments.
(a) Expression of TNFRSF4 (OX40), the canonical receptor of HHV-6B, in unstimulated and stimulated immune cell populations. OX40 is not expressed in unstimulated immune cells but highly expressed in CD4 and CD8 T cells after activation/stimulation via anti-CD3/anti-CD28 and IL-2. (b) Same as in (a) but for CD21, the canonical receptor for EBV. Gamma-delta T cells are highlighted for their high baseline expression of this receptor. (c) Broad expression of OX40 across healthy tissues from the GTEx bulk atlas. Data is summarized over 948 donors across the tissues shown from the GTEx v8 release. Boxplots: center line, median; box limits, first and third quartiles; whiskers, 1.5× interquartile range.
Extended Data Fig. 2 |
Extended Data Fig. 2 |. Characterization of OX40 gene expression in resting and stimulated endothelial cells.
(a) Refinement of cell-type specific HHV-6B expression patterns using the single-cell GTEx atlas. Data is summarized over 25 donors across the tissues shown from the GTEx v8 release Boxplots: center line, median; box limits, first and third quartiles; whiskers, 1.5× interquartile range. (b) Pseudobulk expression patterns of OX40 from the Human Fetal Atlas.
Extended Data Fig. 3 |
Extended Data Fig. 3 |. Supporting analyses for HHV-6 reactivation using Serratus.
(a) Comparison of read number matching to any of the annotated 16 T-cell libraries from Serratus for HHV-6A or HHV-6B. A distinct library is compared for HHV-6A and HHV-6B, connected by a line, quantification from Serratus. Libraries are sorted by HHV-6B expression, which was higher for all libraries than HHV-6A. (b) Heatmap of HHV-6B transcripts across the four samples with highest RNA expression in libraries from Serratus. Shown are the first 40 genes (based on genomic coordinate order) from the HHV-6B transcriptome and the number of reads that pseudoalign to each transcript. (c) Summary of % RNA molecules aligning to the HHV-6B reference in the naive CD4+ culture from the LaMere et al. dataset; compare to Fig. 1e. (d) Summary of HHV-6-SNV analysis and overlap across the two RNA-seq samples with highest HHV-6 reactivation (from Fig. 1d,e) (e) Summary of HHV-6B expression in a previously reported ATAC-seq atlas, showing sorted T cells from Patient 59, an individual with CTCL, who had detectable levels of HHV-6B DNA within cells. (f) Smoothed coverage (rolling mean of 500 base pairs) over the four libraries from Patient 59, showing the coverage across the HHV-6B reference genome. (g) Schematic and results of previously described adoptive Treg therapy culture showing HHV-6 reactivation after reanalysis of primary data.
Extended Data Fig. 4 |
Extended Data Fig. 4 |. Supporting analyses for HHV-6 expression during in vitro CAR T cell culture.
(a) Summary of observed (red) and permuted (gray) HHV-6B expression for four donors at day 19 in culture. The dotted line is at 10 UMIs, the threshold for a super-expressor. (b) Heatmap of HHV-6B expression for selected cells across 3 donors with detectable super-expressors. Columns are grouped based on HHV-6B gene programs (immediate early; early; late). (c) UMAP for 3 samples, noting marker genes and HHV-6B UMI expression (log transformed). The WPRE feature indicates the presence of the CAR transgene.
Extended Data Fig. 5 |
Extended Data Fig. 5 |. Association of viral DNA and RNA in CAR T cell cultures.
(a) Schematic of the experiment where CAR T cells from D98 were profiled using the 10x Genomics Multiome workflow to detect both viral DNA and RNA. (b) Scatter plot of the abundance of viral DNA and RNA at single-cell resolution. Pearson correlation between the log10 abundances is shown. (c) Per-cell viral gene expression signatures. The proportion of viral gene expression belonging to each class (late, early, immediate early) per cell is shown. (d) Same plot as in (c) but colored by the log2 number of viral DNA fragments. The population of cells highly expressing early HHV-6 transcripts show a corresponding high HHV-6 DNA copy number is highlighted by the arrow. (e) Pearson correlation of HHV-6 transcript signatures with their log abundance of DNA fragments per cell. The two-sided p-value for the Pearson correlation test is noted by each bar. (f) Bulk-level RNA and DNA correspondence in the four donors studied in the day 19 allogeneic CAR products.
Extended Data Fig. 6 |
Extended Data Fig. 6 |. Supporting analyses of HHV-6 expression dynamics during in vitro CAR T cell culture.
(a) Immunofluorescence staining of two viral proteins (p41 and gB) and nuclei (DAPI) over the course of the cell therapy product culture. The donor and day of culture are noted for each panel. Images are representative of independent experiments that confirmed results of qPCR assay. (b) Summary of HHV-6B transcript expression in re-cultured samples for donors D61 and D34. (c) Summary of HHV-6B +/− cells from differential expression testing for host factors. Arrows indicate lymphotoxin α (LTα/LTA) and downregulation of lymphotoxin β (LTβ/LTB). (d) Correlation statistics of HHV-6B transcript signatures with OX40 expression across 3 recultured samples, including p-values from Pearson’s product-moment correlation coefficient. The consistently positive, significant correlation statistic represents an association uniquely between OX40 expression and the immediate early HHV-6B gene signature.
Extended Data Fig. 7 |
Extended Data Fig. 7 |. Quantification of HVV6 expression during the manufacturing of allogeneic CAR T cells from a donor with ciHHV-6 under different conditions.
(a) Schematic of experimental design. PBMCs from a ciHHV-6 donor were activated and subjected to four different conditions to assess the impact of individual steps of the CAR T cell manufacturing process. (b) Quantification of conditions in (a) over the 19 day culture process. HHV-6 copy number is shown and stable over the culture. (c) Per-gene HHV-6 viral RNA abundance at Day 1 and Day 19 of the full CAR T manufacturing process for the ciHHV-6 donor (left) and a donor previously analyzed with scRNA-seq (D98, right).
Extended Data Fig. 8 |
Extended Data Fig. 8 |. Mitigation of HHV-6 reactivation and spreading via foscarnet treatment in vitro.
(a) Schematic of CAR T product reculture experiment. Donor D97, which at day 19 showed a low but detectable level of HHV-6, was selected for reculture for five days. (b) Summary of RT-qPCR at the control and two treatment levels of Foscarnet. Each dot represents a technical replicate over one biological replicate per condition (validated in panel d). HHV-6 was not detected (n.d.) at the 1 mM concentration. Error bars represent the standard error of the mean. Comparison of foscarnet treated to untreated resulted in significantly lower abundance of HHV-6 RNA (p = 0.00026; two-sided ordinary least squares linear model). (c) Schematic of D34 reculture +/− foscarnet at 1 mM. (d) Difference between untreated and treated in the abundance of HHV-6+ cells. Comparing the two 10x Genomics scRNA-seq data channels, foscarnet-treated cells had a lower incidence of HHV-6 positive cells (OR = 6.25; p = 8.3e-122; Fisher’s exact test, two-sided). (e) Reduced dimensionality analysis of treated and untreated D34 cells profiled with scRNA-seq. Host gene expression was used for the analysis, showing overlapping clustering of populations irrespective of treatment status. (f) Differential gene expression analysis comparing foscarnet treated and control CAR T cells. The three most significant differential genes are noted. 0 genes were differentially expressed with a minimum log2 fold-change exceeding 1 (noted by the red).
Extended Data Fig. 9 |
Extended Data Fig. 9 |. Gene expression annotation for the Day 19 PBMC allogeneic CD7 dataset.
Expression of select marker genes supporting the annotations contained in Fig. 4c.
Fig. 1 |
Fig. 1 |. Petabase-scale analysis of viral nucleic acids reveals that HHV-6 is reactivated in human T cells.
a, Schematic of life cycles of endogenous human viruses. Viruses can enter a latent phase after primary infection and become reactivated following environmental cues, including drugs, immunization and other infections. b, Enumeration of BioSamples with human viruses showing signs of reactivation based on expressed viral nucleic acids in human Sequence Read Archive samples. c, Proportion of BioSamples with viral transcriptional expression annotated as T cells. These eight viruses showed evidence of reactivation specifically in T cells whereas the remaining viruses from b showed no such evidence of reactivation. d, Reanalysis of RNA-seq data from ref. . CD4+ T cells from three separate donors were either infected with HIV or mock infected and cultured for about 2 weeks. Shown is the percentage of RNA molecules aligning to the HHV-6B reference transcriptome e, Reanalysis of the data from ref. . Naive and memory CD4+ T cells were separated and cultured for 2 weeks. Shown is the percentage of RNA molecules aligning to the HHV-6B reference transcriptome. f, Quantification of HHV-6B episomal DNA from a reanalysis of ChIP–seq data from ref. . Shown are the percentages of DNA reads uniquely mapping to the HHV-6B transcriptome, noting the percentage of total DNA reads mapping to the HHV-6B reference genome. g, Coverage of the HHV-6B genome across two ChIP–seq libraries from different donors from ref. . Repetitive regions on the ends of the chromosome show no uniquely mapping reads.
Fig. 2 |
Fig. 2 |. scRNA-seq identifies rare HHV-6-expressing cells in CAR T cell culture.
a, Quantification of HHV-6B by qPCR at day 19 for four donors normalized to the cell count. Bars are shown in order of increasing abundance. b, Longitudinal qPCR surveillance of HHV-6B U31 gene copies in CAR T cell culture from two donors. c, Schematic of the single-cell sequencing workflow to detect HHV-6+ cells from the CAR T culture. Two models are presented that would explain HHV-6 reactivation: model 1 (top), in which all cells express HHV-6 transcripts; and model 2 (bottom), in which only a subset of cells express HHV-6B. Both the host and HHV-6B viral RNA can be directly quantified using the 10x Genomics scRNA-seq workflow. d, Summary of HHV-6B expression from an individual donor (98). The top 0.2% of cells contain 99% of the HHV-6B transcript UMIs from this experiment. e, Tabulated summary of scRNA-seq profiling for four CAR T donors, including number of cells profiled, percentage expressing HHV-6, U31 qPCR value and number of shared TCR clones between the HHV-6B+ cells. N/A, not applicable. f, Extended longitudinal sampling of HHV-6B through U31 qPCR. Number at right end of each plot line indicates the fold (×) increase from the first qPCR measurement (day 21) to the final measurement (day 27; black outline) for each donor. g, Schematic and summary of HHV-6B expression in donor 34 after 19 and 25 days, showing evidence of HHV-6B spreading in the culture as depicted in the schematic. h, Correlation analyses of host factor gene expression with HHV-6B RNA abundance in individual cells for donor 34 on day 25. The per-gene correlation statistics are shown in black against a permutation of the HHV-6B expression in grey. Select genes are indicated. i, Pathway enrichment analysis of Molecular Signatures Database Hallmark gene sets for gene set enrichment analysis. A positive normalized enrichment score corresponds to genes that are overexpressed in cells with large amounts of HHV-6B transcript.
Fig. 3 |
Fig. 3 |. HHV-6 reactivation in FDA-approved CAR T cells and clinically used CAR T cells in vitro and in vivo.
a, Schematic and summary of patient cohorts for scRNA-seq profiling, noting different cell therapy products (axicabtagene ciloleucel (axi-cel) and tisagenlecleucel (tisa-cel)) and two different time points for sampling (pre-infusion product and post-infusion blood draws). The numbers of total cells analysed and HHV-6+ cells detected are noted underneath. b, Summary heatmap of gene expression in vivo for 22 HHV-6+ cells from cohort 2 follow up and 6 HHV-6+ cells from cohort 3 post-infusion samples. The number of HHV-6 transcripts is in the blue rectangles; green rectangles indicate nonzero host expression (Methods). c, Heatmap of 86 detected HHV-6B transcripts (columns) across the described 28 individual cells (rows, as in b) grouped by viral gene class (immediate-early, early and late expressing genes as previously described). d, Summary of the clinical timecourse of patient axi-R-15, noting four time points of scRNA-seq data collection (red dots) and the clinical period corresponding to altered mental status. SEs, super-expressors. ***P = 0.00047, day 7 versus day 0; P = 0.00032, day 7 versus day 14 (two-sided binomial tests). e, Summary of the clinical in vivo timecourse of patient SJCAR19–09, including PCR of HHV-6 and T cell scRNA-seq abundance at the indicated time points. Treatment regimen with foscarnet is noted with the initial dose administered on day +24. CPM, counts per million. f, Schematic (left) of an in vitro reculture experiment in which CAR T cells were recovered from the infusion product from SJCAR19–09 and then recultured with TransAct, IL-7 and IL-15, and HHV-6B RNA counts per million over five time points, measured by CAR T cell scRNA-seq (right). HHV-6 was not detected (n.d.) at day 0 but was observed as soon as 3 days following reculture and persisted for the full 14 days of additional culture.
Fig. 4 |
Fig. 4 |. Allogeneic CAR T cells discriminate donor and host reactivation of HHV-6B in vivo.
a, Schematic of data generation for CD7 allogeneic CAR T cells, including the infusion product and PBMCs derived at day 14 and 19 following patient infusion. b, Summary of HHV-6 pseudobulk expression across the three samples from RD13–01-treated patient 5 assayed in the study. c, Uniform manifold approximation and projection (UMAP) of day-19 scRNA-seq data, showing the annotation from genetic demultiplexing (left) and log10[HHV-6 UMIs] across all cells in the experiment (right). d, Summary of HHV-6+ cells from day-19 infusion product. Host and CAR T cells were separated using SouporCell as shown in c. More HHV-6+ cells were detected among the CAR T cells, but the host cell shad more super-expressors (red) and a higher overall UMI count.

Comment in

References

    1. Spanjaart AM, van der Valk FM, van Rooijen G, Brouwer MC & Kersten MJ Confused about confusion. N. Engl. J. Med. 386, 80–87 (2022). - PubMed
    1. Haradhvala NJ et al. Distinct cellular dynamics associated with response to CAR-T therapy for refractory B-cell lymphoma. Nat. Med.28, 1848–1859 (2022). - PMC - PubMed
    1. Wilson TL et al. Common trajectories of highly effective CD19-specific CAR T cells identified by endogenous T cell receptor lineages. Cancer Discov. 10.1158/2159-8290.CD-21-1508 (2022). - DOI - PMC - PubMed
    1. Talleur A et al. Preferential expansion of CD8+ CD19-CAR T cells postinfusion and the role of disease burden on outcome in pediatric B-ALL. Blood Adv. 10.1182/bloodadvances.2021006293 (2022). - DOI - PMC - PubMed
    1. Hu Y et al. Genetically modified CD7-targeting allogeneic CAR-T cell therapy with enhanced efficacy for relapsed/refractory CD7-positive hematological malignancies: a phase I clinical study. Cell Res. 32, 995–1007 (2022). - PMC - PubMed

Publication types

MeSH terms

Substances