. 2023 Nov;623(7988):820-827.
doi: 10.1038/s41586-023-06706-0. Epub 2023 Nov 8.

Targeting of intracellular oncoproteins with peptide-centric CARs

Affiliations

Targeting of intracellular oncoproteins with peptide-centric CARs

Mark Yarmarkovich et al. Nature. 2023 Nov.

Abstract

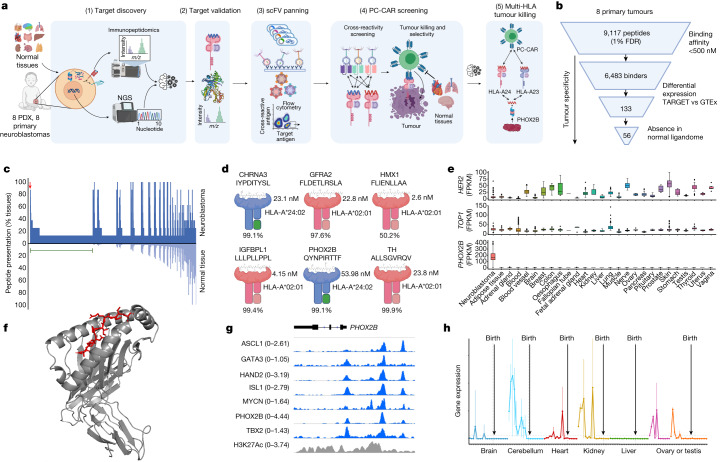
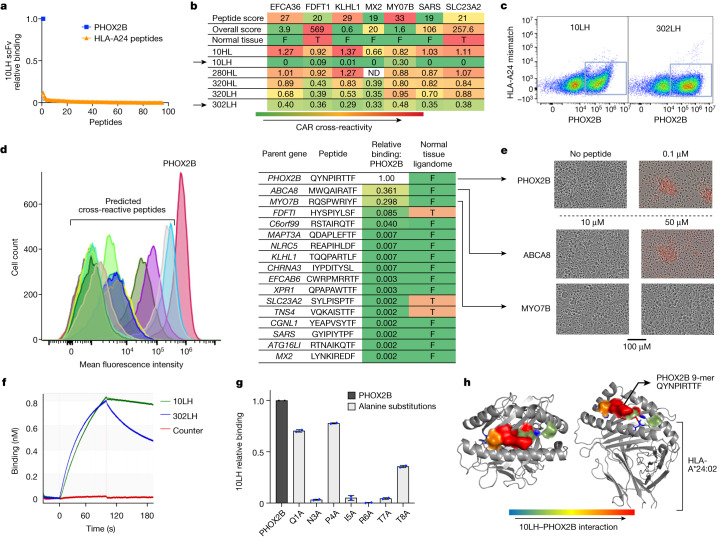
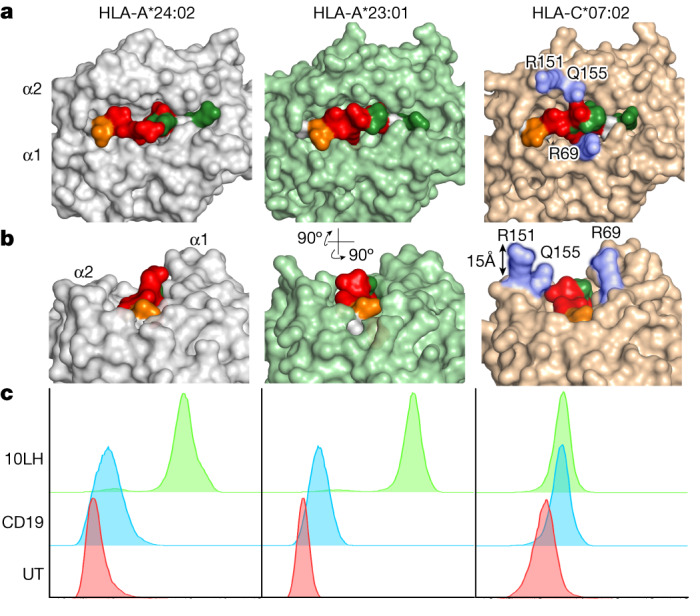
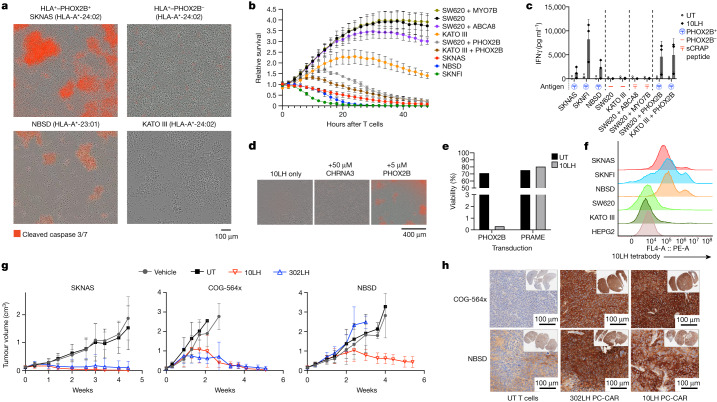
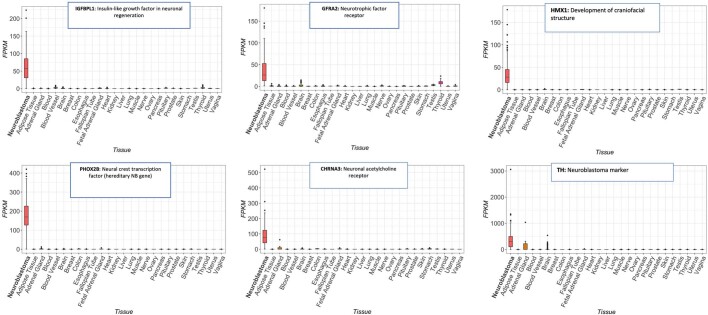
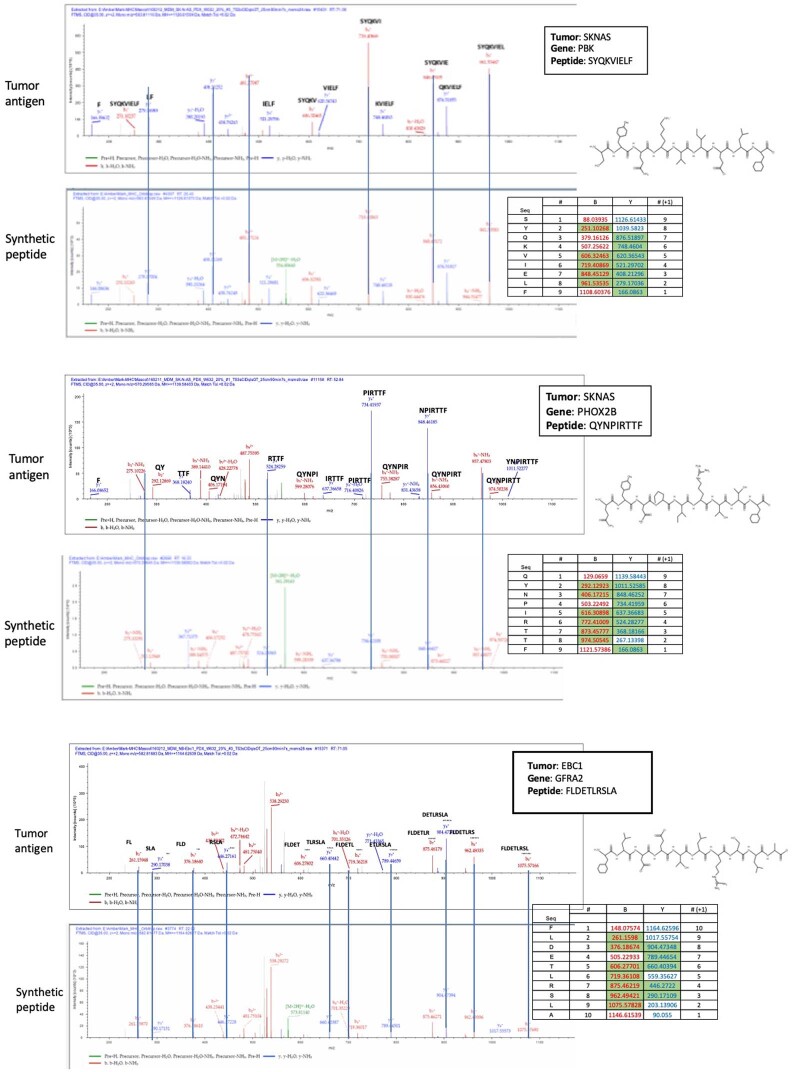
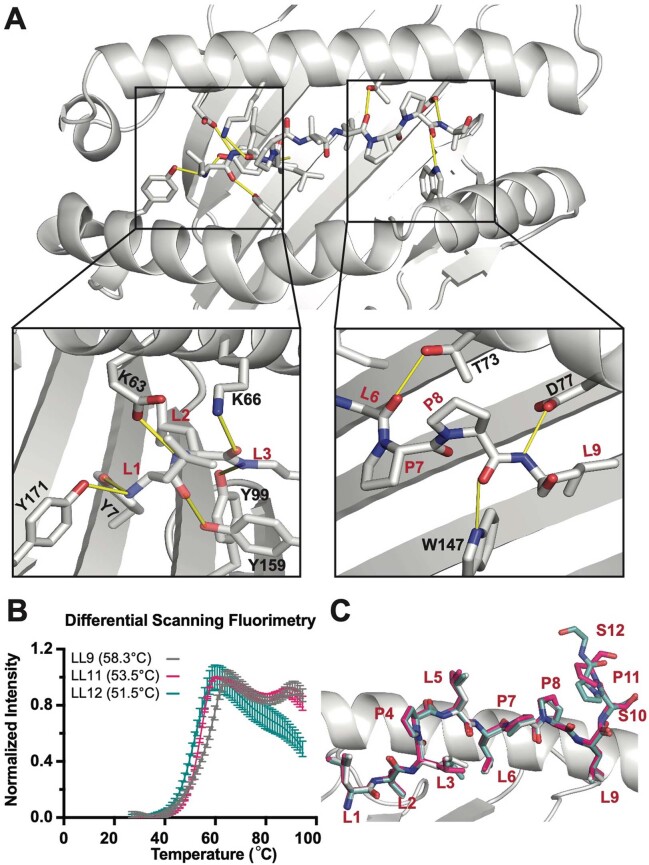
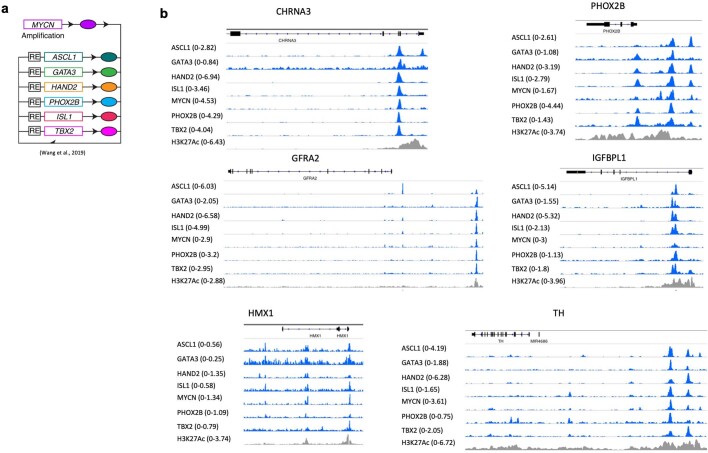
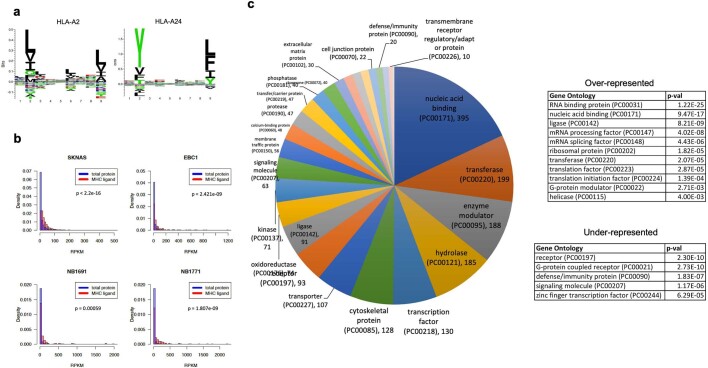
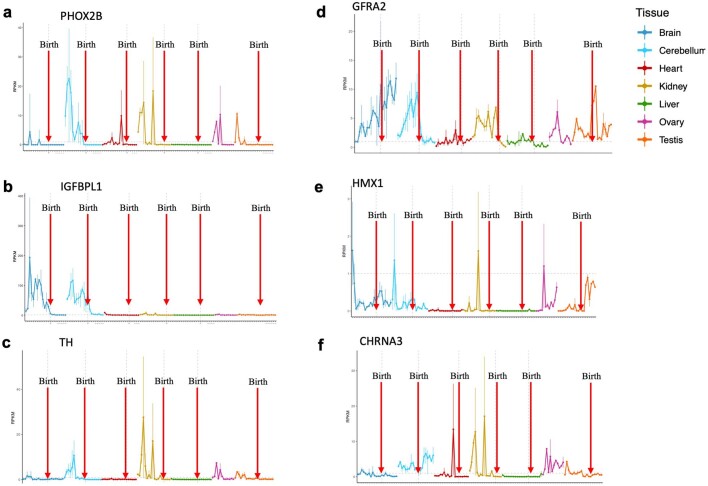
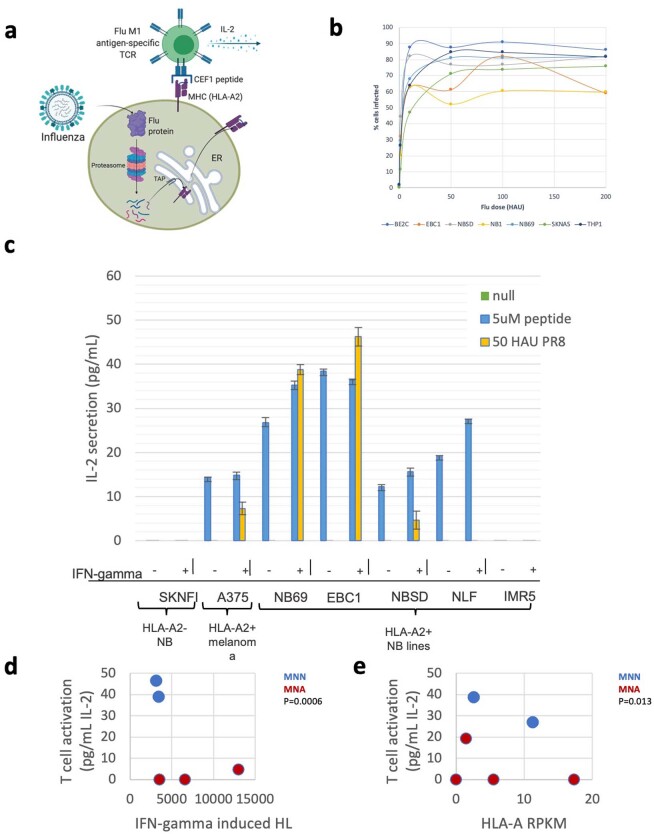
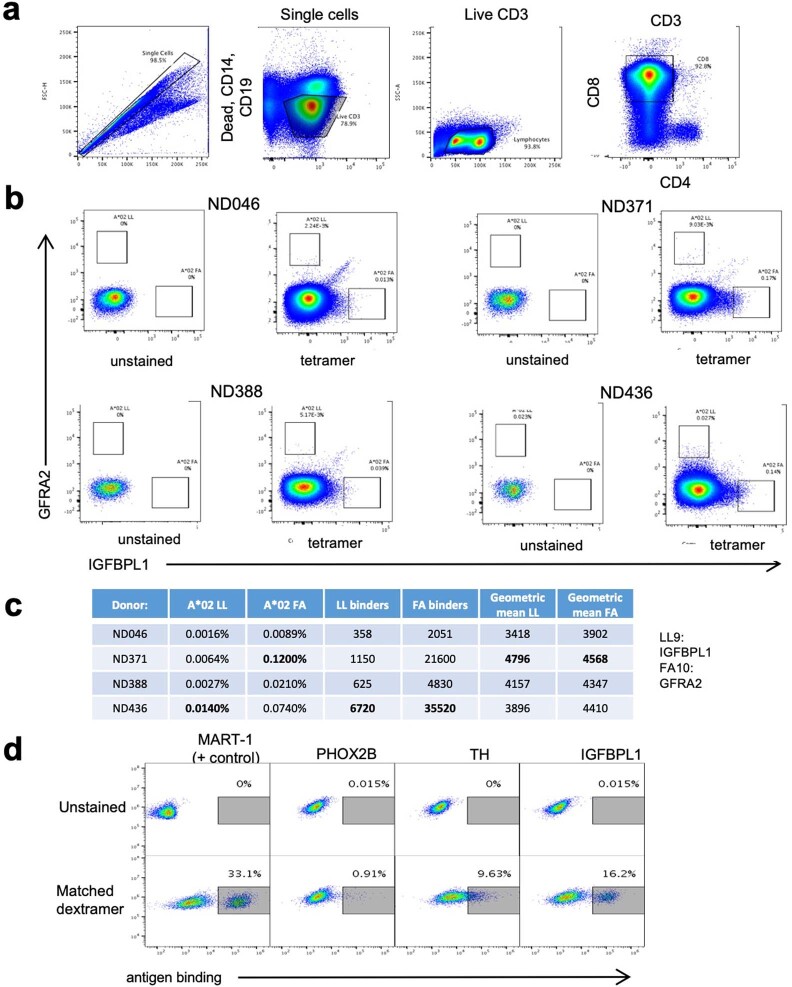
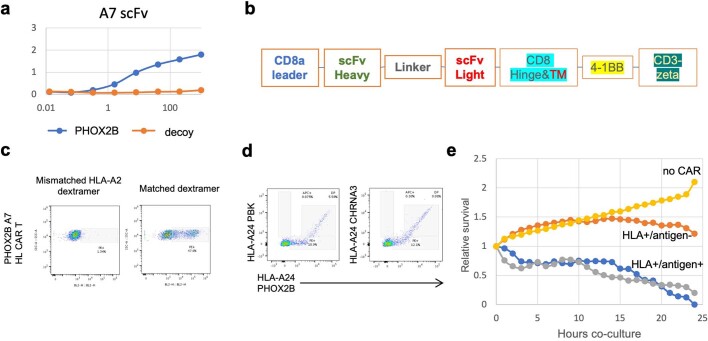
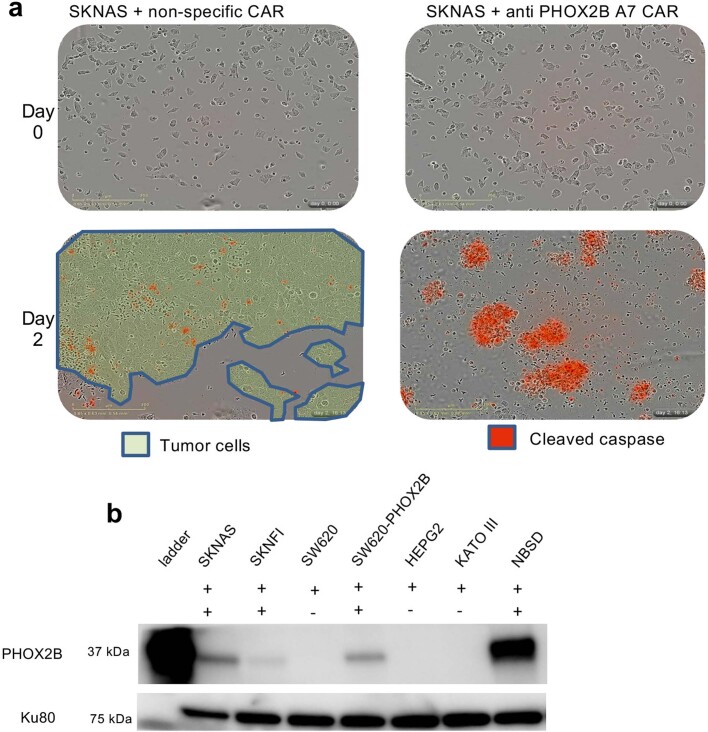
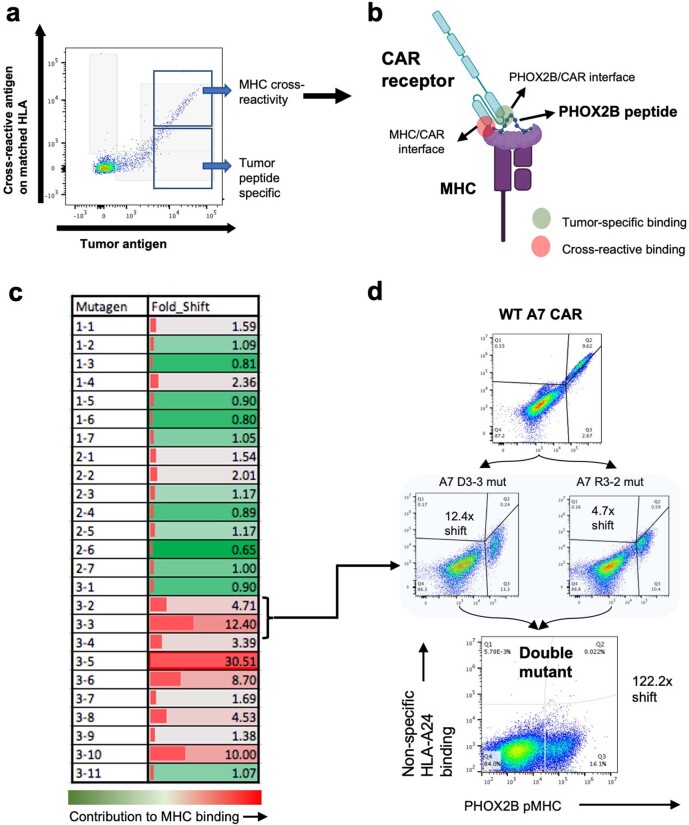
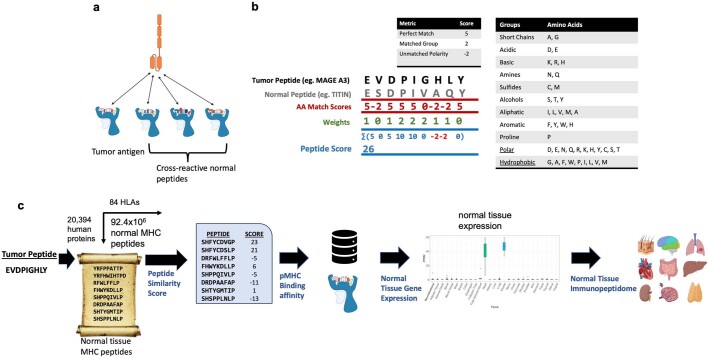
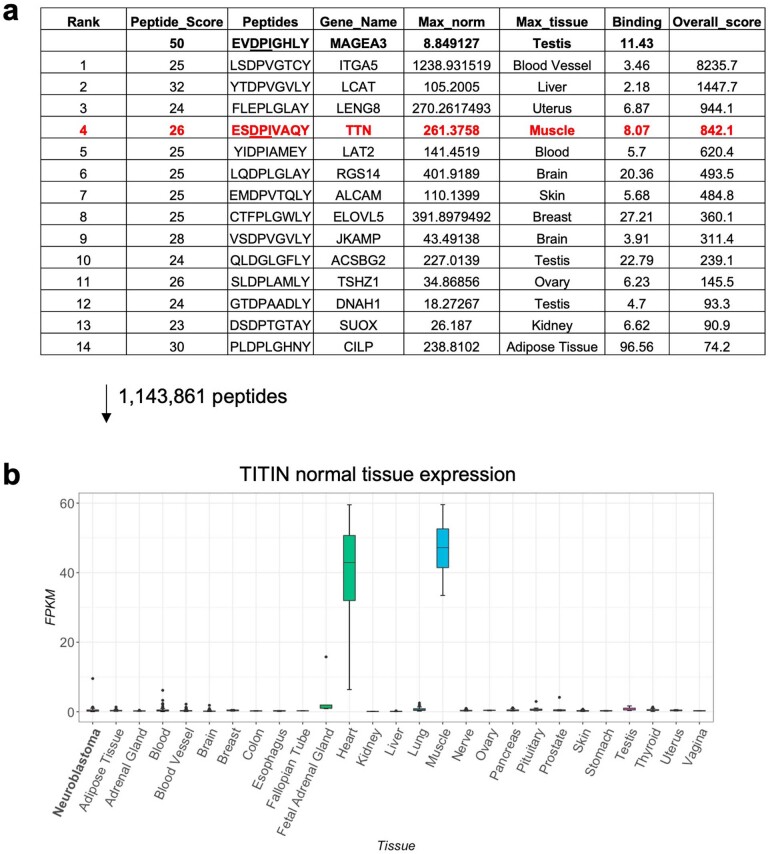
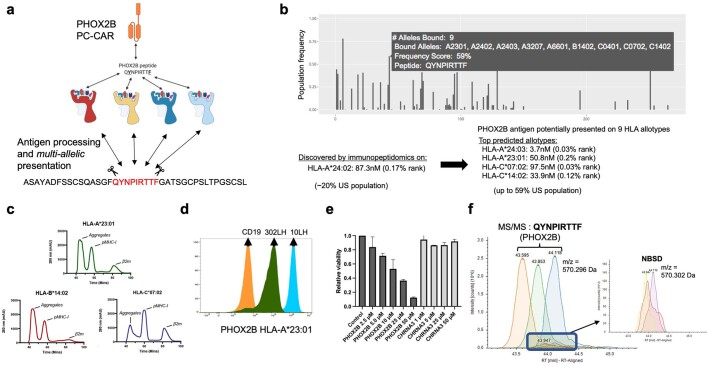
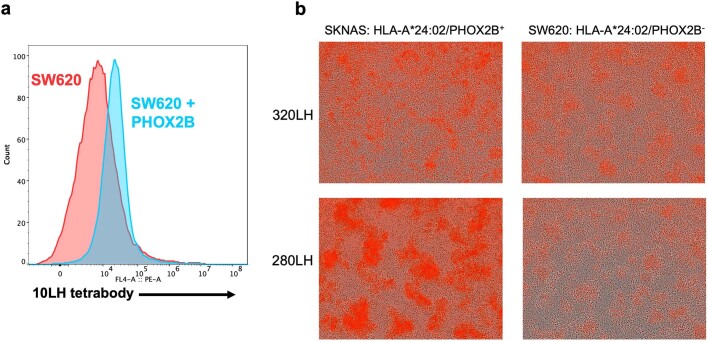
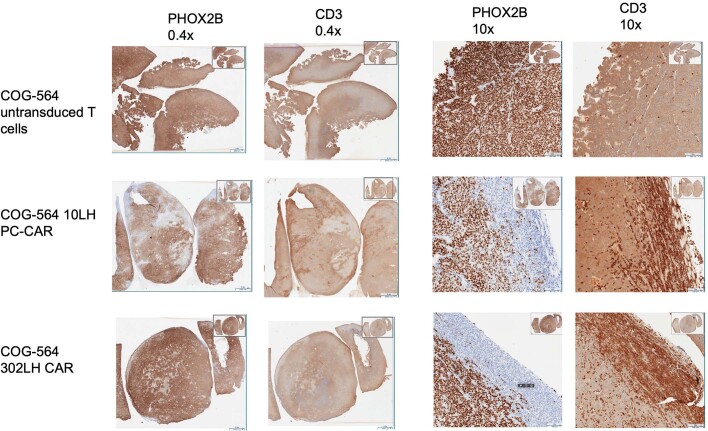
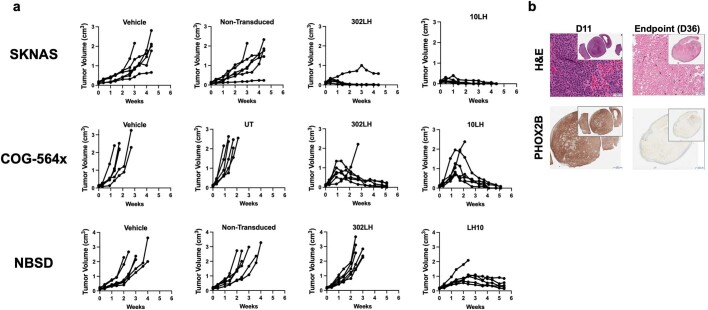
The majority of oncogenic drivers are intracellular proteins, constraining their immunotherapeutic targeting to mutated peptides (neoantigens) presented by individual human leukocyte antigen (HLA) allotypes1. However, most cancers have a modest mutational burden that is insufficient for generating responses using neoantigen-based therapies2,3. Neuroblastoma is a paediatric cancer that harbours few mutations and is instead driven by epigenetically deregulated transcriptional networks4. Here we show that the neuroblastoma immunopeptidome is enriched with peptides derived from proteins essential for tumorigenesis. We focused on targeting the unmutated peptide QYNPIRTTF discovered on HLA-A*24:02, which is derived from the neuroblastoma-dependency gene and master transcriptional regulator PHOX2B. To target QYNPIRTTF, we developed peptide-centric chimeric antigen receptors (PC-CARs) through a counter panning strategy using predicted potentially cross-reactive peptides. We further proposed that PC-CARs can recognize peptides on additional HLA allotypes when presenting a similar overall molecular surface. Informed by our computational modelling results, we show that PHOX2B PC-CARs also recognize QYNPIRTTF presented by HLA-A*23:01, the most common non-A2 allele in people with African ancestry. Finally, we demonstrate potent and specific killing of neuroblastoma cells expressing these HLAs in vitro and complete tumour regression in mice. These data suggest that PC-CARs have the potential to expand the pool of immunotherapeutic targets to include non-immunogenic intracellular oncoproteins and allow targeting through additional HLA allotypes in a clinical setting.


Conflict of interest statement

J.M.M. and M.Y. have equity stake in Tantigen Bio and HuLA Therapeutics. Both companies have interest in commercializing technologies described herein. B.R.K. is an employee of and has equity interests in Myrio Therapeutics. R.P. and N.L.C. are employees of Myrio Therapeutics. J.M.M., M.Y., N.G.S. and B.R.K. are co-inventors on a patent filed regarding the PHOX2B PC-CAR.

Figures

Fig. 1
Fig. 1. Antigen discovery and prioritization process identifies PHOX2B as an immunotherapy target.
a, Summary of tumour antigen discovery and CAR engineering workflow: (1) integrated genomics and immunopeptidomics process, (2) target validation, (3) scFv screening, (4) CAR engineering and (5) tumour killing across HLA allotypes. NGS, next-generation sequencing. b, Computational filtering of 9,117 peptide instances identified by immunopeptidomics in primary tumours (1% FDR) resulted in 56 neuroblastoma-specific peptides (33 unique peptides) derived from 29 unique proteins. c, Primary neuroblastoma tumour immunopeptidome compared with 190 normal tissues. Each point on the x axis represents one of 5,832 unique peptides identified in primary tumours, with the proportion of neuroblastoma tumours presenting a given peptide annotated above the axis in dark blue and the proportion of normal tissue expressing the identical peptide below the axis in light blue. Green line overlayed with 1,492 peptides not previously observed in normal tissue immunopeptidome. Parent genes from neuroblastoma-specific peptides resulted in the top two gene ontology enrichment terms noradrenergic neuron differentiation and sympathetic nervous system development. Arrow denotes 351 recurring peptides presented in neuroblastoma not previously detected in normal tissues. d, Five antigens further prioritized from PDX and primary tumours by differential expression, HLA allele frequency, relative peptide abundance (percentile rank annotated below pMHC), predicted pMHC binding affinity and relevance to neuroblastoma tumorigenesis. e, PHOX2B expression in RNA sequencing of 153 neuroblastoma tumours versus 1,641 normal tissues in GTEx. PHOX2B expression is tumour-restricted, in contrast to the immunotherapy target HER2 and neuroblastoma chemotherapy target TOP1 (note differences in the y axis scale). Lower and upper bounds of box plots correspond to the first and third quartiles (the 25th and 75th percentiles); whiskers represent minima and maxima or 1.5× interquartile range (IQR). FPKM, fragments per kilobase million. f, Crystal structure of PHOX2B 9-amino-acid-long QYNPIRTTF (red) refolded with HLA-A*24:02 (grey). g, ChIP–seq data in neuroblastoma shows binding of all CRC proteins at the PHOX2B locus and association with a H3K27ac super-enhancer mark. h, RNA sequencing of fetal tissue demonstrates expression of PHOX2B in early development and downregulated before birth across seven tissues. Panels a and d were created using BioRender (https://biorender.com).
Fig. 2
Fig. 2. Engineering pMHC-specific CARs.
a, Ranked binding affinity of 10LH scFv to PHOX2B and a panel of 95 peptides presented on HLA-A*24:02 peptides demonstrate high target binding and negligible binding to HLA-A*24:02 pMHC complexes. b, Cross-reactivity algorithm identifies CAR constructs with significant off-target binding and informs prioritization of highly selective receptors (selective receptors marked with arrows). Peptide score represents the predicted cross-reactivity based on the amino acid sequences of normal tissue peptides; overall score calculated based on peptide score, binding affinity and normal tissue expression. F, absent in normal immunopeptidome; T, peptides reported in the normal tissue immunopeptidome. c, Example counterstaining of top CAR clones with target (x axis) and off-target (y axis) peptides on HLA-A*24:02 reveals selective target binding in 10LH and 302LH constructs. d, Flow cytometry plot (left) of predicted cross-reactive peptides compared with PHOX2B shows cross-reactive binders ABCA8 (light blue) and MYO7B (gray). FDFTI is in purple and C6orf99 in dark olive green. Flow mean fluorescence intensity quantified by relative binding to PHOX2B is in table; right. e, Functional screening of ABCA8 and MYO7B shows CAR killing only through ABCA8 at a supraphysiological concentration of 50 µM compared with PHOX2B killing at 0.1 µM. ABCA8 and MYO7B were not detected in the normal tissue immunopeptidome, and none of the peptides predicted by sCRAP that were detected in the normal immunopeptidome (FDFTI, SLC23A2 and TNS4) demonstrate binding to 10LH. Experiment was performed once on entire panel of CAR constructs and repeated for 10LH and 302LH on expanded panel of peptides. f, Representative BLItz plot at 200 nM shows a fast on-rate for 10LH and 302LH and slow off-rate for 10LH (Kd = 7.6 × 10−4 s–1). g, Alanine scan of QYNPIRTTF reveals that mutations in five residues (N3A, I5A, R6A, T7A and T8A) result in significant abrogation of binding to PC-CAR 10LH (n = 2; data presented as mean). h, PHOX2B–HLA-A*24:02 crystal structure paired with alanine scan of 10LH using MHC class I tetramers allows mapping of the peptide–receptor interface, revealing spatial conformation of five receptor contact residues.
Fig. 3
Fig. 3. Structural basis of CARs binding the PHOX2B peptide presented on multiple HLAs.
a, PHOX2B–HLA-A*2:024 crystal structure and models of PHOX2B in complex with HLA-A*23:01 and HLA-C*07:02. b, R151, Q155 and R69 charged and polar residues of HLA-C*07:02 align with key 10LH interaction residues I5, R6 and I7 (MHC residues in blue and PHOX2B–10LH interaction residues in red). R151, Q155 and R69 can create steric and charged hindrance of key peptide binding residues. c, Staining of PHOX2B PC-CAR 10LH (bottom) reveals binding to HLA-A*24:02 and HLA-A*23:01, but not to HLA-C*07:02. 10LH, PHOX2B PC-CAR; CD19, CD19-directed CAR; UT, untransduced T cells.
Fig. 4
Fig. 4. PHOX2B-specific PC-CAR T cells induce potent tumour killing in vitro and in vivo and kill different HLA allotypes.
ac, 10LH CAR induces specific killing and IFNγ release in neuroblastoma cells expressing HLA-A*24:02 and HLA-A*23:01 and PHOX2B (SKNAS, NBSD and SKNFI), but not in HLA-A*24:02–PHOX2B non-neuroblastoma tumour cells (SW620, HEPG2 and KATO III), unless PHOX2B peptide is added. No T cell activity was observed in SW620 cells when pulsed with 10 μM of predicted cross-reactive peptides ABCA8 or MYO7B (b,c). Cytotoxicity was visualized by T cell clustering and cleaved caspase in a, relative loss of confluence measured by loss of green fluorescence in GFP-transduced cancer cells in b and IFNγ release measured by ELISA in c. Assays performed using T cells from n = 3 donors, each in triplicate; plots presented as the mean ± s.d. d, Pulsing HLA-A*24:02–PHOX2B cell line SW620 with 5 μM PHOX2B induces complete cell killing when cultured with 10LH CAR, but no killing when pulsed with 50 μM CHRNA3. Repeated across three experiments with similar results. e, 10LH CAR specifically and specifically kills SW620 control cells transduced with PHOX2B, but not with PRAME. f, Staining cancer cells with tetramerized 10LH scFv enables the detection of PHOX2B pMHC on neuroblastoma cells but not in HLA-matched controls. g, PHOX2B-specific PC-CAR T cells induce potent tumour killing in mice engrafted with neuroblastoma PDX tumours, including the fast-growing line COG-564x and HLA-A*23:01 line NBSD. n = 6 mice enrolled per group (individual plots shown in Extended Data Fig. 17); data shown are representative from one of two independent, in vivo studies for each PDX line; shown as the mean ± s.d. h, Treatment with 10LH and 302LH PC-CARs potently upregulate HLA expression in PDX tumours collected from lone mice in each group reaching tumour burden compared with mice treated with untransduced T cells (COG-564x collected 11 days after treatment; NBSD collected 14 days after treatment for UT and 17 days after treatment for 10LH and 302LH; both tumours collected from one experiment).
Extended Data Fig. 1
Extended Data Fig. 1. Prioritized peptides from immunopeptidome are highly differentially expressed in neuroblastoma.
Differential expression between 153 neuroblastoma tumors from TARGET compared to 1643 normal tissues in GTEx, as described in Fig. 1e. Lower and upper bounds of boxplot correspond to the first and third quartiles (the 25th and 75th percentiles); whiskers represent minima/maxima or 1.5*IQR.
Extended Data Fig. 2
Extended Data Fig. 2. Validation of antigens discovered by immunopeptidomics using LC/MS/MS of synthetic peptide.
Peptide sequences imputed from immunopeptidomics spectra were synthesized and LC/MS/MS was under matched conditions. Synthetic peptides show complete concordance with tumor-eluted peptides across all b and y ions; masses highlighted in green represent detected peaks corresponding to matched b and y ions found in both tumor-eluted peptide spectra and synthetic peptide spectra.
Extended Data Fig. 3
Extended Data Fig. 3. Crystal structures solved for IGFBPL1 presented as three distinct peptides on HLA-A2.
Crystallographic analysis of IGFBPL1 peptide bound to HLA-A*02:01. a. X-ray structure of HLA-A*02:01 presenting the IGFBPL1 nonameric peptide (LLLPLLPPL), where yellow lines represent polar contacts between the HLA groove and peptide. b. Differential Scanning Fluorimetry (DSF) of HLA-A*02:01 refolded with IGFBPL1 peptides of different lengths. The legend indicates the sequence of the IGFBPL1 peptide and the corresponding melting temperature of the resulting peptide/MHC-I complexes. Mean of triplicate samples reported with error bars representing SD. c. Overlay of IGFBPL1 9mer, 11mer, and 12mer in MHC groove reveals that core peptides and anchor residues are maintained across peptides of varying length, and that additional amino acids in the 11mer and 12mer protrude at C terminus downstream of the L9 anchor position.
Extended Data Fig. 4
Extended Data Fig. 4. Tumor antigens derived from parent genes are under control of neuroblastoma core regulatory circuit.
a. Illustration of core-regulatory circuit in which transcription factors bind to one another’s promoters, acting as feed-forward loop b. ChIP Seq data at prioritized neuroblastoma antigens parent gene loci are bound by each of the 7 core-regulatory circuit (CRC) proteins MYCN, ASCL1, GATA3, HAND2, PHOX2B, ISL1, and TBX2. All CRC binding sites are associated with a H3K27Ac super-enhancer element.
Extended Data Fig. 5
Extended Data Fig. 5. Properties of neuroblastoma immunopeptidome.
a. Logo plots of peptides eluted from HLA-A2 and HLA-A24 show canonical binding motifs for both alleles. b. Peptides detected by immunopeptidomics are enriched for highly expressed parent genes as compared to the entire cellular transcriptome (p = 2.2 × 10⁻¹⁶ – 0.00059 across cell lines). c. Gene ontology analysis of the parent genes of peptides of the neuroblastoma immunopeptidome compared to the cellular transcriptome. The most significantly enriched ontology groups are nucleic acid binding proteins (RNA binding protein ontology p = 1.22e−25 and nucleic acid binding ontology p = 9.47e−17; Gene Ontology analyses were performed using PANTHER (http://geneontology.org/) and p-values calculated using Fischer’s Exact test).
Extended Data Fig. 6
Extended Data Fig. 6. Prioritized antigen parent genes are expressed during tissue development and downregulated in normal tissue after birth.
a-f. Temporal transcriptomic analysis of prioritized neuroblastoma target antigens reveals high expression during development and downregulation prior to birth in the majority of target genes. Expression shown for each tissue from shown from 4 weeks post-conception to 58–63 years with birth marked by red arrows. PHOX2B (a), TH (b), IGFBPL1 (c), and CHRNA3 (d) exhibit developmentally restricted expression patterns. HMX1 (e) shows expression in testes post-birth. GFRA2 (f) expression in brain may make this target more amenable to targeting by antibody-based therapies that do not cross blood-brain barrier.
Extended Data Fig. 7
Extended Data Fig. 7. Neuroblastoma antigen processing, presentation, and immunogenicity.
a. Schematic of immunogenicity experiment. HLA-A2 neuroblastoma cells were either infected with H1N5 or pulsed with synthetic CEF1 peptide and co-cultured with M1 antigen-specific T cell hybridoma line. T cell activation was evaluated by IL-2 release. b. Viral titration of neuroblastoma cells using H1N5 influenza virus measured by FACS staining of viral nucleoprotein expression at 0–200 heamagglutination (HAU). c. Experimental schematic of assay: 1) HLA-A2 neuroblastoma cells are pulsed with 5 μM CEF1 peptide and co-cultured with M1 antigen-specific hybridoma and IL-2 release is measured by ELISA; 2) Neuroblastoma cells are infected with 50 HAU of H1N5, co-cultured with M1 antigen-specific hybridoma, measured by IL-2 secretion. Four of seven tested HLA-A*02:01 elicit T hybridoma response when pulsed with CEF1 peptide; three of seven lines induce a response when infected with H1N5 virus. n = 3 independent experiments, each performed in triplicate; plots show mean +/− SD. d-e. T hybridoma activation is not associated with HLA expression, but activation is lower in MYCN amplified tumors (MNA) as compared to non-amplified tumors (MNN). Created with BioRender.com.
Extended Data Fig. 8
Extended Data Fig. 8. Detection of tumor self-antigen specific CD8 T cells in normal donors.
a. Gating used to select CD8 T cells. Similar gating strategy was used to select live singlets for Jurkat and primary cells transduced with CAR constructs (without selection for CD3 and exclusion of CD14, CD19, and CD4). b. Four normal donors stained with IGFBPL1 dextramer on x-axis and GFRA2 on y-axis shows rare population of antigen-specific cells varying by donor and antigen (left panel showing unstained and right panel showing tetramer stained). c. Frequencies and MFIs of antigen specific cells across donors. d. Top constructs generated from normal donor-derived antigen-specific TCRs found by single-cell sequencing show range of antigen binding PHOX2B, TH, and IGFBPL1 as compared to DMF5 receptor targeting MART-1. Screening for antigen specific T cells in 3 donors reveals that PHOX2B TCRs have minimal target binding, suggesting that PHOX2B self-antigen is immunogenically silent and warrants targeting using synthetic scFv receptors.
Extended Data Fig. 9
Extended Data Fig. 9. Development of antigen-specific CARs for neuroblastoma antigens.
a. ELISA of PHOX2B scFv A7 using PHOX2B p/MHC and decoy peptide on HLA-A*24:02. b. Schematic of second-generation CAR constructs. c. A7 CAR transduced into primary CD8 cells binds PHOX2B dextramer but not HLA-A*02:01 dextramer. d. A7 CAR preferentially binds PHOX2B dextramer but cross-reacts with mismatched peptides PBK and CHRNA3 on HLA-A*24:02 at high affinity. e. A7 CAR potently kills HLA-A*24:02 neuroblastoma lines, but also kills HLA+/antigen tumor cells. f. Tetramer and dextramer gating strategy for pMHC staining.
Extended Data Fig. 10
Extended Data Fig. 10. PHOX2B A7 CAR.
a. SKNAS tumor cells co-cultured with A7 CAR shows potent killing. SKNAS cells plated on day 0 (top), non-targeting CAR (left) and A7 CAR (right) added after 18 h; measuring tumor confluence (green) and cleaved caspase (red) on day 2 (bottom) shows tumor outgrowth with non-specific CAR and killing of all tumor cells with A7 CAR. Representative images shown from experiment repeated three times using n = 3 replicates in each experiment. b. PHOX2B is expressed in neuroblastoma cell lines (SKNAS, SKNFI, and NBSD), and not in HLA-matched controls (SW620, KATO III, and HEPG2). PHOX2B is expressed in SW620 cells transduced with full-length PHOX2B. For gel source data from single experiment, see Supplementary Fig. 1.
Extended Data Fig. 11
Extended Data Fig. 11. Saturation mutagenesis of A7 construct resulted in single-antigen-specific population.
a-b. Cross-reactive binding to mismatched HLA-A24 peptides. Flow cytometry of Jurkat cells transduced with A7 CAR stained with PHOX2B dextramer on x-axis and mismatched PBK peptide on HLA-A*24:02 on y-axis. c. Saturation mutagenesis was performed on CDR loops 1–3 of the heavy chain. Each pool of mutants was stained with target pMHC and counter-stained with mismatched pMHC. Contribution of each CDR binding loop (mutagens labeled CDR loop # - position #) to binding HLA-A*24:02 is shown (green: no contribution to binding; red: significant HLA binding at specific amino acid). Contribution of each position to HLA binding was calculated as follows: (MFItarget(mut)/MFImismatch(mut))/(MFItarget(WT)/MFImismatch(WT)). d. Mutations of A7 CAR at CDR3 positions 2 and 3 result in 12.4x and 4.7x shifts towards single specificity, respectively. Double mutation of D3A and R2A resulted in modified A7 CAR with no MHC cross-reactivity and reduced binding to target. Created with BioRender.com.
Extended Data Fig. 12
Extended Data Fig. 12. sCRAP cross-reactivity algorithm.
a. Cross-reactivity algorithm was developed to identify peptides presented on normal tissue with similar biophysical properties to tumor antigens such as to pre-emptively predict cross-reactivities and screen for specificity. b. Illustration of peptide scoring system described in methods. c. Schematic of algorithm workflow describing how tumor peptides are scored against each peptide predicted to be presented from the normal proteome (totaling 92.4 × 10⁶ potential MHC peptides). Binding affinity is predicted for each normal peptide and maximum gene expression of parent gene are factored into the overall score of each peptide. Peptides are referenced against a normal tissue immunopeptidomics database. Created with BioRender.com.
Extended Data Fig. 13
Extended Data Fig. 13. pMHC Cross-Reactivity Algorithm sCRAP Predicts MAGE-A3 toxicity through TITIN.
a. Table of top predicted cross-reactive peptides to MAGE-A3 peptide EVDPIGHLY reveals cross-reactivity with Titin peptide ESDPIVAQY ranks 4th out of 1,143,861 potential peptides presented on HLA-A*01:01. b. TITIN is highly expressed in GTEx RNA-sequencing of heart (n = 108) and muscle (n = 138) tissues. Lower and upper bounds of boxplot correspond to the first and third quartiles (the 25th and 75th percentiles); whiskers represent minima/maxima or 1.5*IQR.
Extended Data Fig. 14
Extended Data Fig. 14. Presentation of the PHOX2B peptide by multiple HLA allotypes.
a. Schematic of hypothesis proposing that PHOX2B peptide QYNPIRTTF detected by immunopeptidomics can be presented by additional HLA alleles after undergoing a common antigen processing pathway. b. Population-scale presentation across the length of the PHOX2B protein (all potential 9mers on x-axis) generated by ShinyNAP predicts PHOX2B peptide QYNPIRTTF to be presented by an additional 8 HLA alleles in addition to HLA-A*24:02. Additionally, QYNPIRTTF was found to bind additional common HLA alleles HLA-C*07:01, HLA-C*06:02, HLA-A*29:02, and HLA-A*32:01 using NetMHCpan 4.1 and also predicted by HLAthena. c. Size exclusion chromatography of PHOX2B peptide QYNPIRTTF refolded with HLA-A*23:01, HLA-B*14:02, and HLA-C*07:02 shows formation of stable pMHC complex with HLA-A*23:01 and HLA-C*07:02, and minimal complex with HLA-B*14:02. d. PC-CAR 10LH binds PHOX2B on HLA-A*23:01 demonstrates higher binding than 302LH, in concordance with observed in vivo activity (Fig. 4g). e. 10LH CAR kills HLA-A*23:01/PHOX2B WM873 cells when pulsed with PHOX2B peptide but not with CHRNA3 peptide n = 2 technical replicates; reported as mean +/− SD. f. Matched peptide search identifies unfragmented peaks in additional neuroblastoma tumors (NBSD shown). Unfragmented NBSD peaks are within 0.006 Da m/z of peaks in which PHOX2B peptide QYNPIRTTF was identified by MS/MS in other samples and eluted within one minute of fragmented peaks. While validated MS/MS peaks were found in 2/8 PDX tumors and 2/8 primary tumors, peaks with m/z and retention times matched to validated QYNPIRTTF peaks were identified in 6/8 PDX tumors and 7/8 primary tumors. Created with BioRender.com.
Extended Data Fig. 15
Extended Data Fig. 15. Tetramerized 10LH binds to PHOX2B pMHC.
a. Pulsing SW620 HLA-A*24:02 with 50 μM PHOX2B peptide results in 10LH tetrabody binding. b. CARs predicted to be cross-reactive show killing in HLA-matched cells. CARs 320LH and 280LH predicted to cross-react with peptides presented on normal tissue demonstrate significant cross-reactivity in HLA-matched SW620 cells. Representative images shown from n = 3 technical replicates.
Extended Data Fig. 16
Extended Data Fig. 16. Immunohistochemistry of tumors collected from mice exceeding tumor burden.
COG-564x tumor-bearing mice treated with 10LH and 302LH PC-CARs show T cell infiltration as measured by CD3, co-localized with loss of PHOX2B target expression and tissue necrosis. No evidence of T cell infiltration observed in mice treated with untransduced T cells. Tumors were collected from one of each mouse in treatment arms reaching tumor burden 11 days after receiving T cells. All other mice in treatment arms went on to achieve complete responses. Images shown from tumors collected from lone mice reaching tumor burden each study arm in single experiment.
Extended Data Fig. 17
Extended Data Fig. 17. PC-CARs result in tumor ablation in mice engrafted with patient-derived xenografts.
a. Tumor regression in individual mice in vivo treated with PC-CARs (n = 6; source data provided in Supplementary Table 3). b. COG-564x tumors collected from 302LH PC-CAR-treated mice collected at when mice reached tumor burden on day 11 (left) and endpoint of study on day 38 (right). Though tumors are detectable at endpoint, H&E and PHOX2B staining of 302LH PC-CAR-treated tumors reveals entirely necrotic tissue by endpoint of the study. Single available tumor collected from mouse reaching tumor burden for D11 and single endpoint tumor in one experiment collected for immunohistochemistry shown.

References

    1. Pearlman AH, et al. Targeting public neoantigens for cancer immunotherapy. Nat. Cancer. 2021;2:487–497. doi: 10.1038/s43018-021-00210-y. - DOI - PMC - PubMed
    1. Alexandrov LB, et al. Signatures of mutational processes in human cancer. Nature. 2013;500:415–421. doi: 10.1038/nature12477. - DOI - PMC - PubMed
    1. Leko V, Rosenberg SA. Identifying and targeting human tumor antigens for T cell-based immunotherapy of solid tumors. Cancer Cell. 2020;38:454–472. doi: 10.1016/j.ccell.2020.07.013. - DOI - PMC - PubMed
    1. Durbin AD, et al. Selective gene dependencies in MYCN-amplified neuroblastoma include the core transcriptional regulatory circuitry. Nat. Genet. 2018;50:1240–1246. doi: 10.1038/s41588-018-0191-z. - DOI - PMC - PubMed
    1. Majzner RG, Mackall CL. Clinical lessons learned from the first leg of the CAR T cell journey. Nat. Med. 2019;25:1341–1355. doi: 10.1038/s41591-019-0564-6. - DOI - PubMed

Publication types

MeSH terms