. 2023 Nov;623(7987):616-624.
doi: 10.1038/s41586-023-06708-y. Epub 2023 Nov 8.

Deconstruction of rheumatoid arthritis synovium defines inflammatory subtypes

Fan Zhang #  1   2   3   4   5   6 Anna Helena Jonsson #  1   7 Aparna Nathan #  1   2   3   4   5 Nghia Millard #  1   2   3   4   5 Michelle Curtis  1   2   3   4   5 Qian Xiao  1   2   3   4   5 Maria Gutierrez-Arcelus  1   2   3   4   5   8 William Apruzzese  9 Gerald F M Watts  1 Dana Weisenfeld  1 Saba Nayar  10   11 Javier Rangel-Moreno  12 Nida Meednu  12 Kathryne E Marks  1 Ian Mantel  13   14 Joyce B Kang  1   2   3   4   5 Laurie Rumker  1   2   3   4   5 Joseph Mears  1   2   3   4   5 Kamil Slowikowski  4   5   15 Kathryn Weinand  1   2   3   4   5 Dana E Orange  13   16 Laura Geraldino-Pardilla  17 Kevin D Deane  7 Darren Tabechian  12 Arnoldas Ceponis  18 Gary S Firestein  18 Mark Maybury  10   19 Ilfita Sahbudin  10   19 Ami Ben-Artzi  20 Arthur M Mandelin 2nd  21 Alessandra Nerviani  22   23 Myles J Lewis  22   23 Felice Rivellese  22   23 Costantino Pitzalis  22   23   24 Laura B Hughes  25 Diane Horowitz  26 Edward DiCarlo  27 Ellen M Gravallese  1 Brendan F Boyce  28 Accelerating Medicines Partnership: RA/SLE NetworkLarry W Moreland  7   29 Susan M Goodman  13   14 Harris Perlman  21 V Michael Holers  7 Katherine P Liao  1   4 Andrew Filer  10   11   19 Vivian P Bykerk  13   14 Kevin Wei  1 Deepak A Rao  1 Laura T Donlin  13   14 Jennifer H Anolik  12 Michael B Brenner  1 Soumya Raychaudhuri  30   31   32   33   34
Collaborators, Affiliations

Deconstruction of rheumatoid arthritis synovium defines inflammatory subtypes

Fan Zhang et al. Nature. 2023 Nov.

Abstract

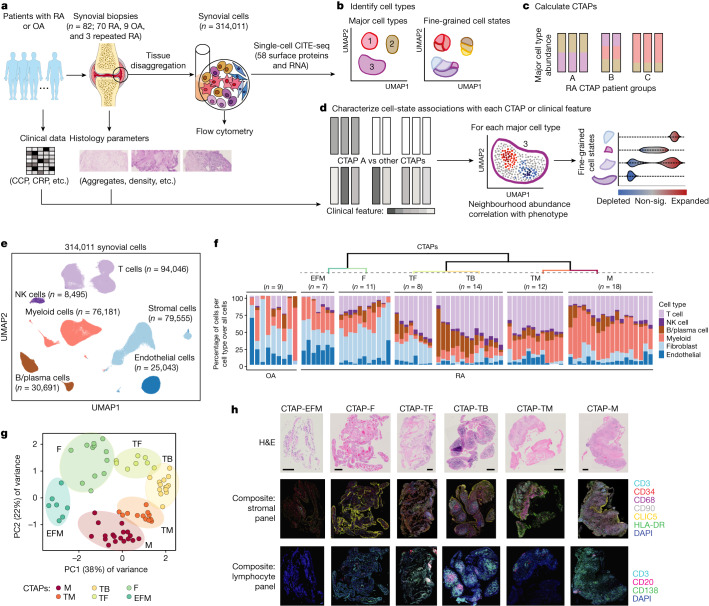
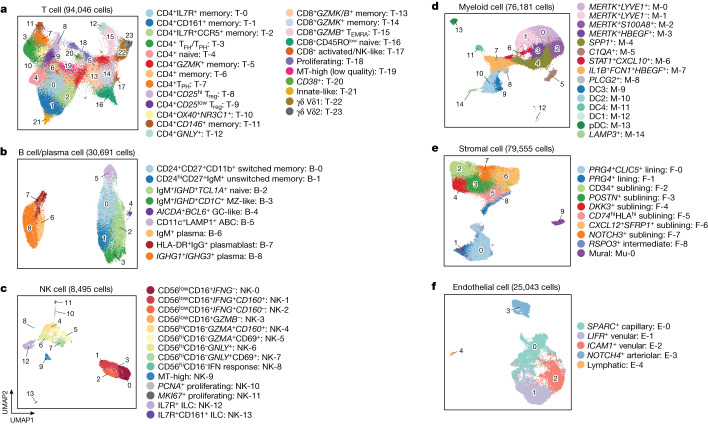
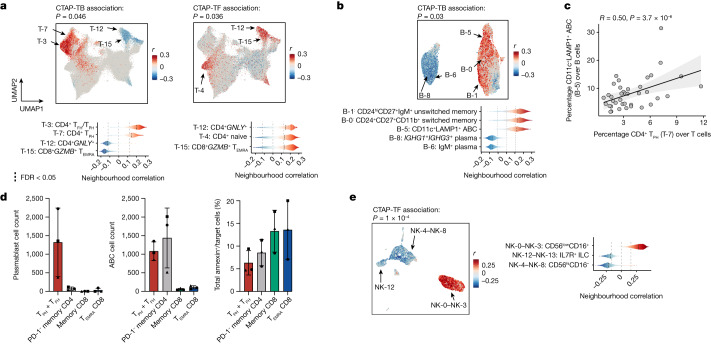
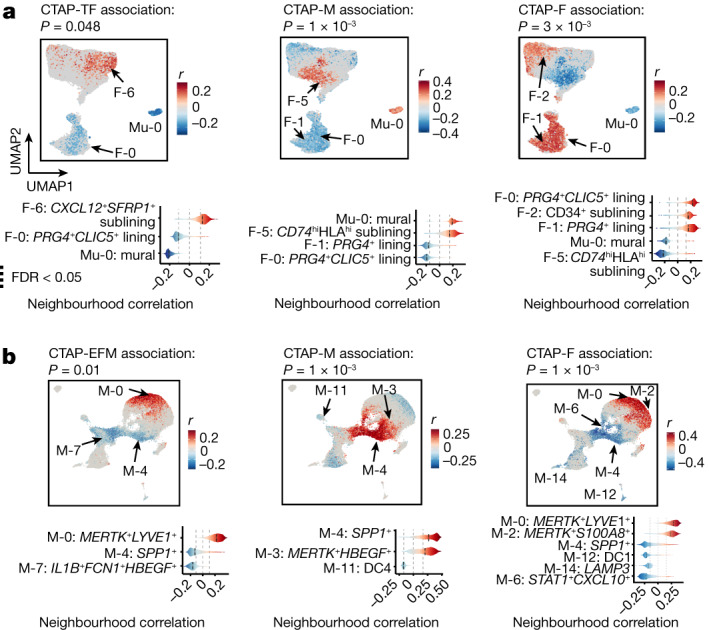
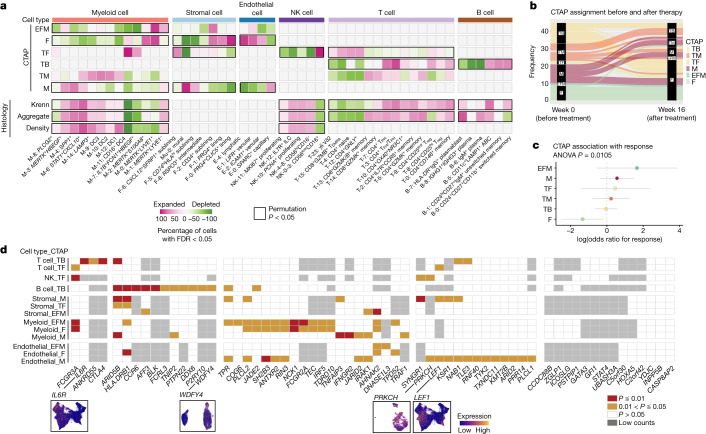
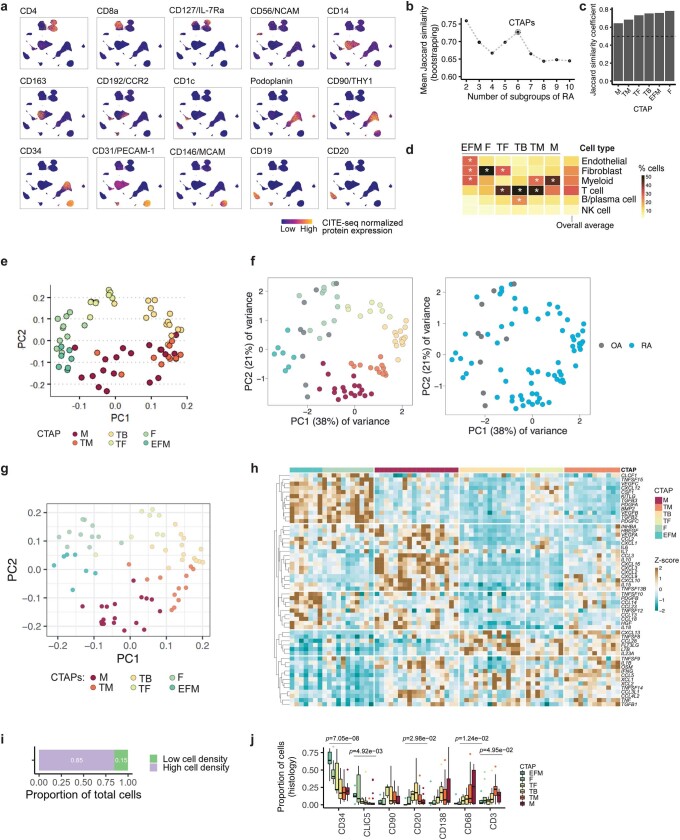
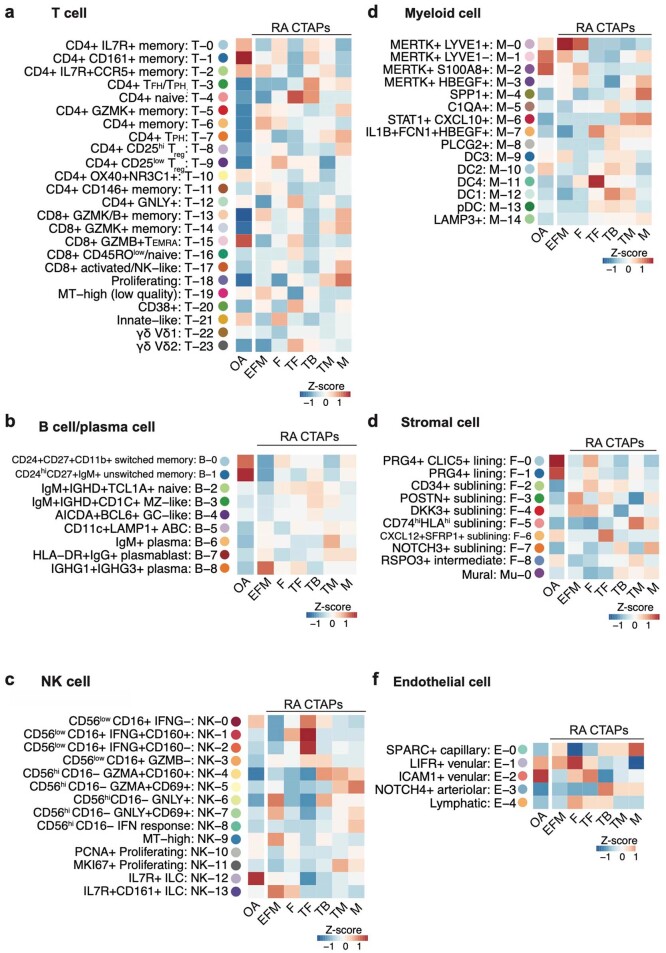
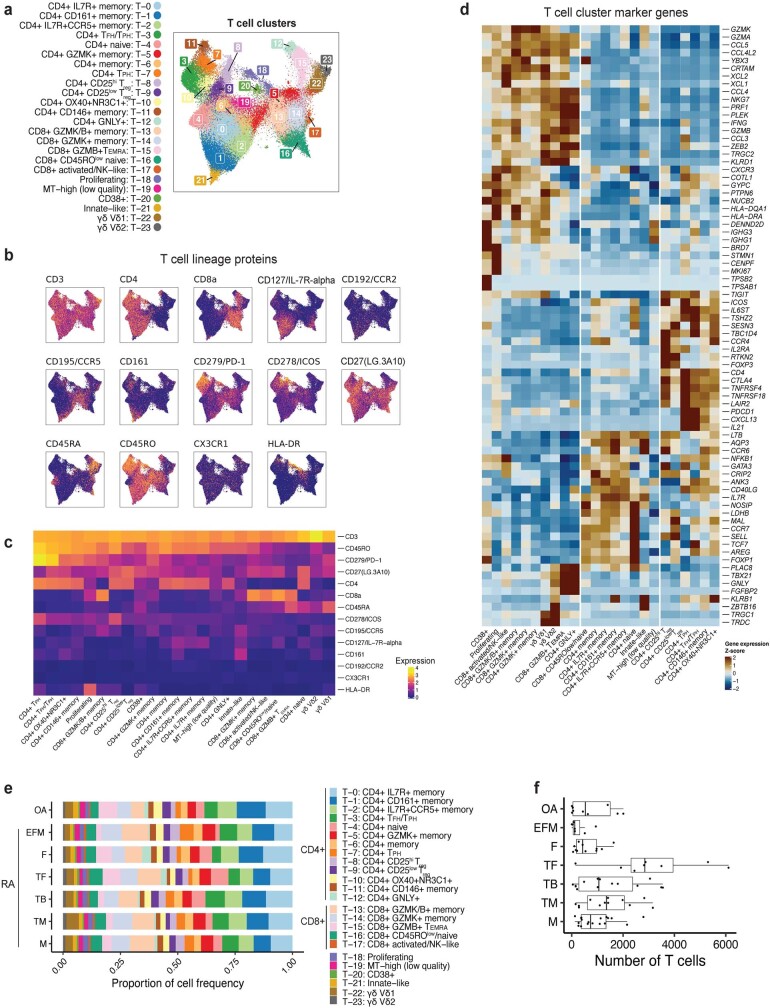
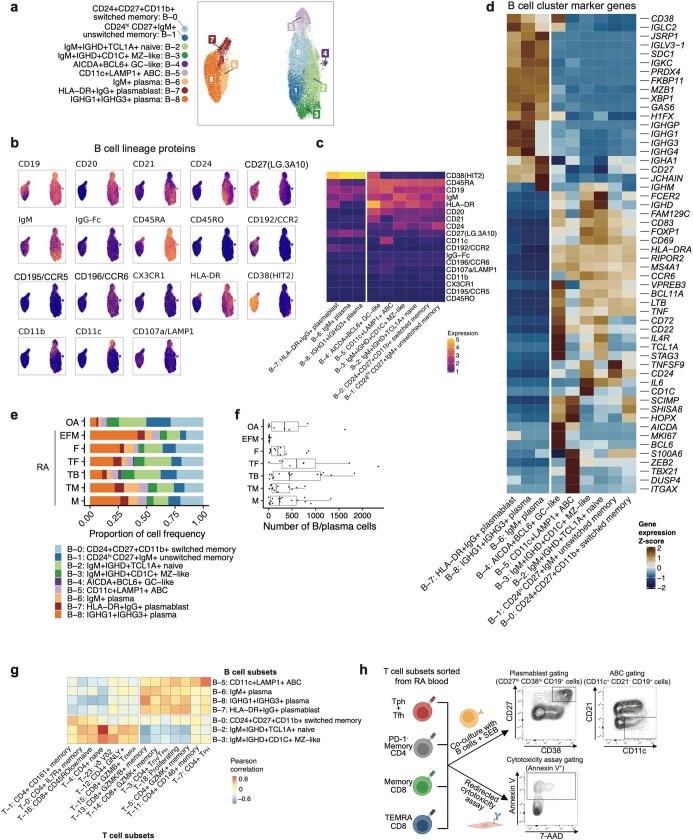
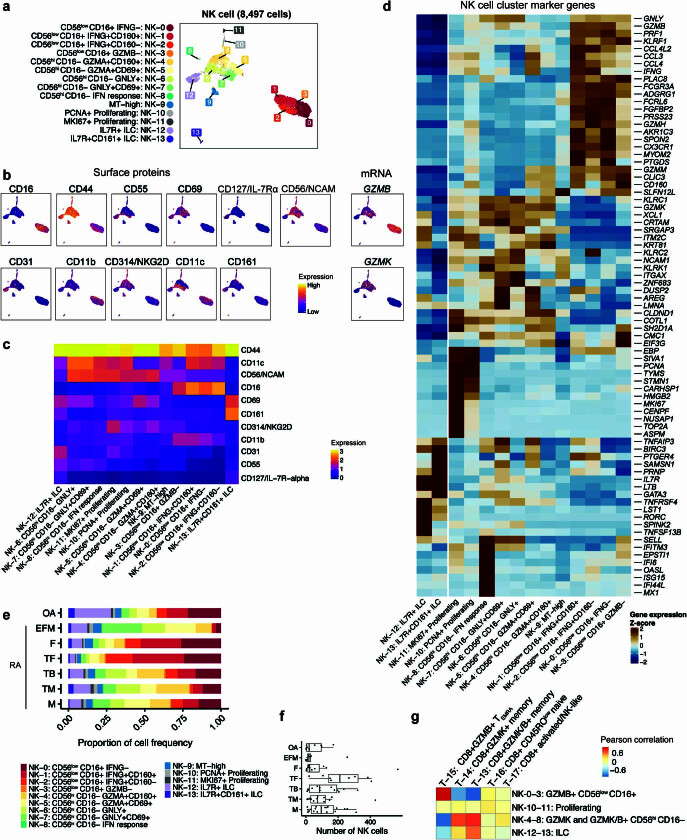
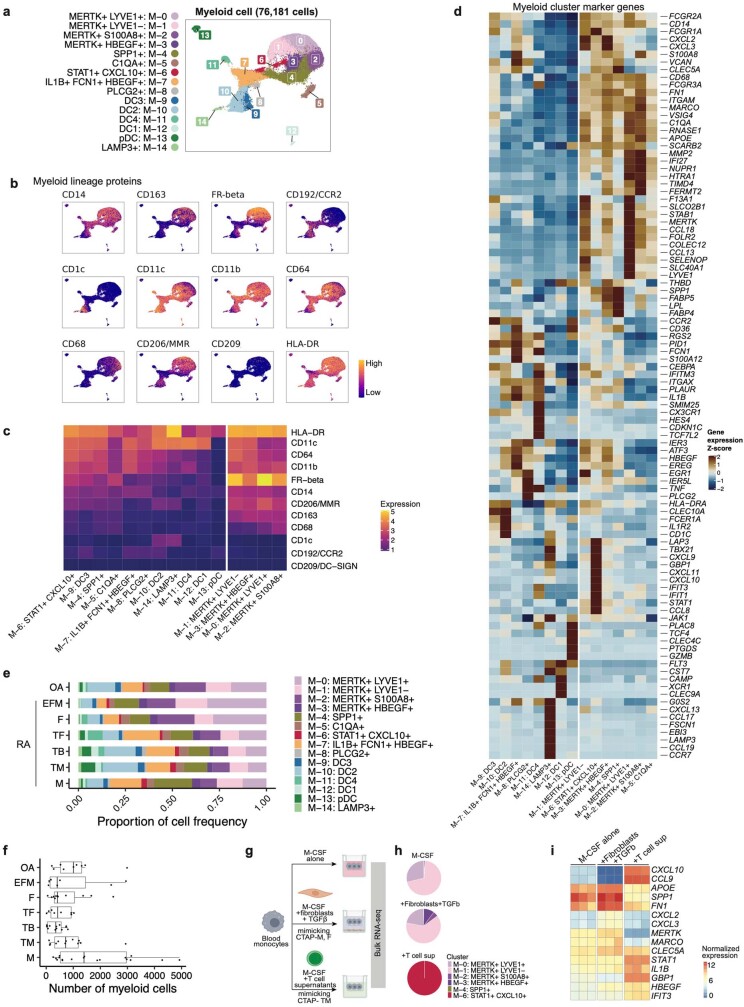
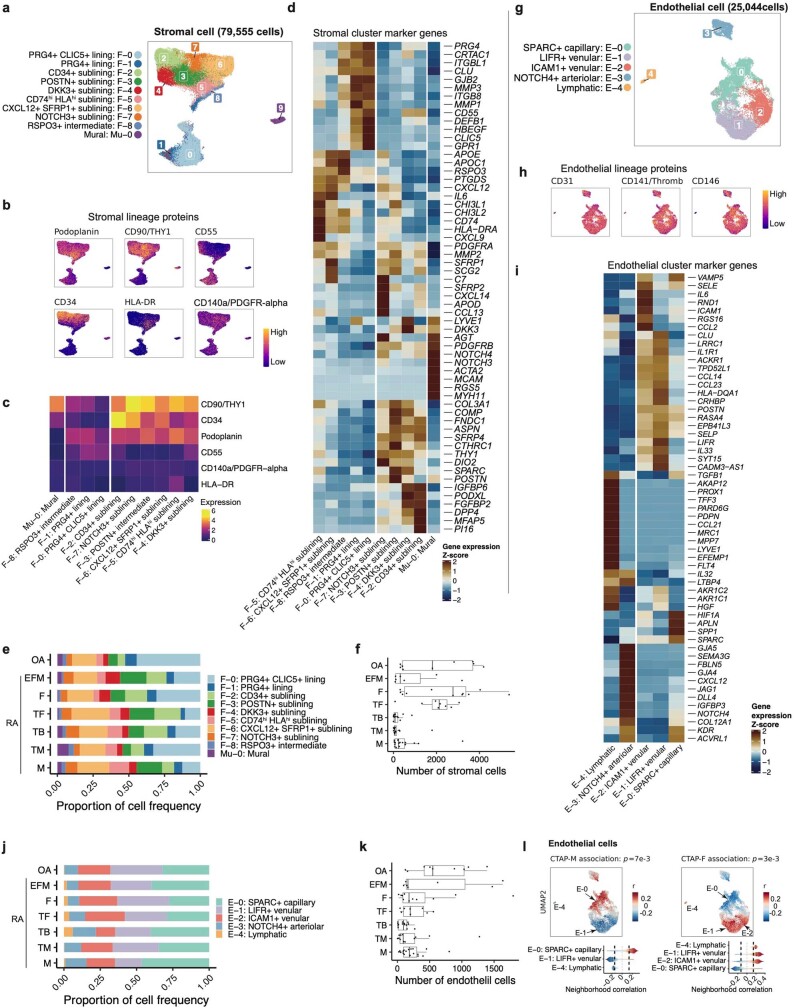
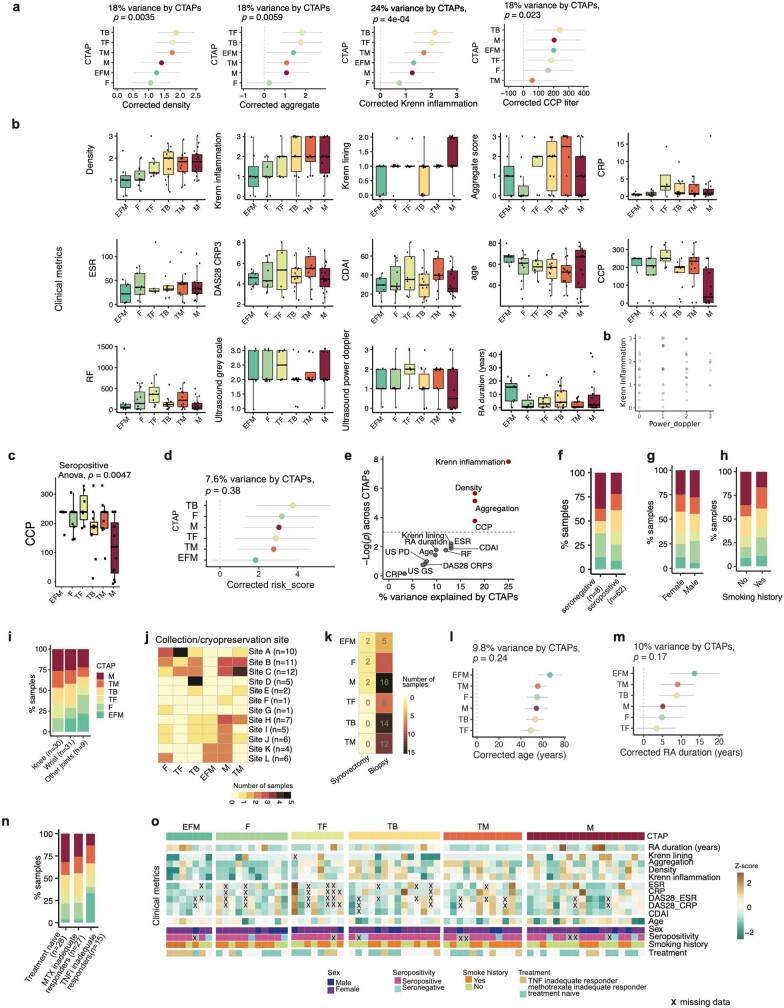
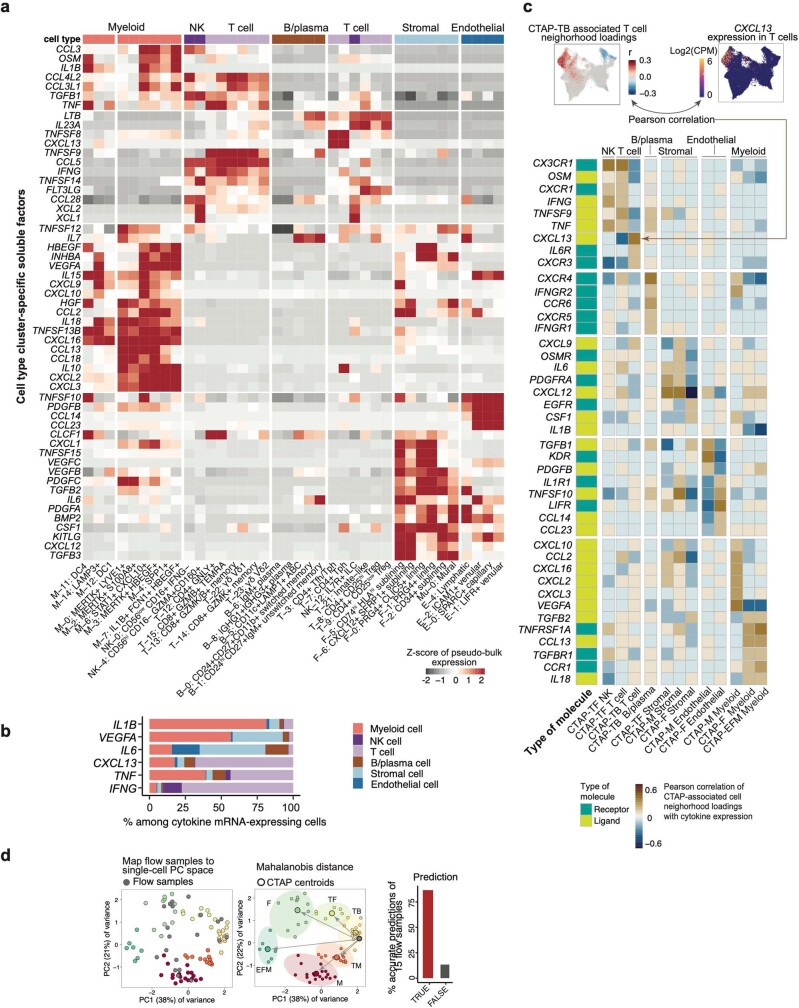
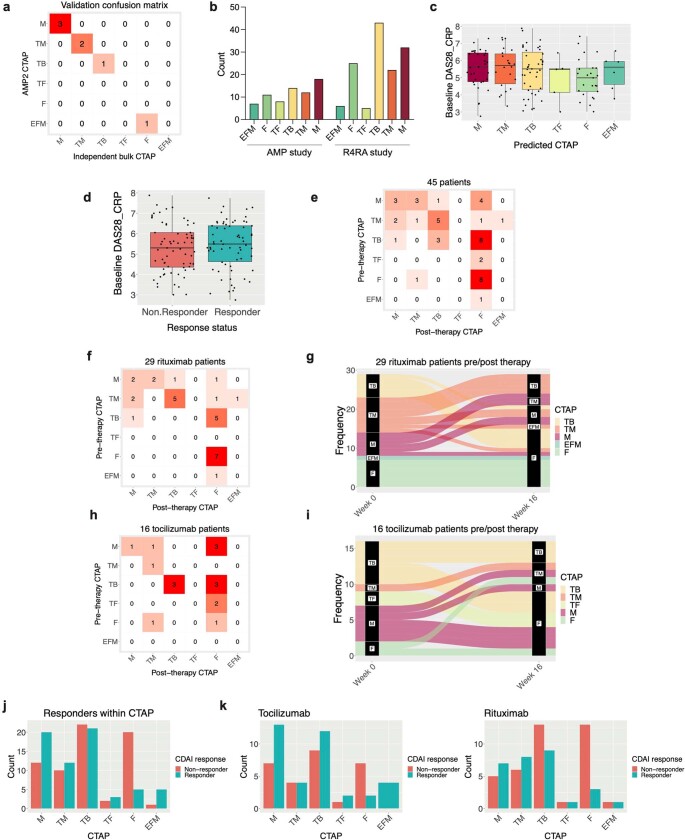
Rheumatoid arthritis is a prototypical autoimmune disease that causes joint inflammation and destruction1. There is currently no cure for rheumatoid arthritis, and the effectiveness of treatments varies across patients, suggesting an undefined pathogenic diversity1,2. Here, to deconstruct the cell states and pathways that characterize this pathogenic heterogeneity, we profiled the full spectrum of cells in inflamed synovium from patients with rheumatoid arthritis. We used multi-modal single-cell RNA-sequencing and surface protein data coupled with histology of synovial tissue from 79 donors to build single-cell atlas of rheumatoid arthritis synovial tissue that includes more than 314,000 cells. We stratified tissues into six groups, referred to as cell-type abundance phenotypes (CTAPs), each characterized by selectively enriched cell states. These CTAPs demonstrate the diversity of synovial inflammation in rheumatoid arthritis, ranging from samples enriched for T and B cells to those largely lacking lymphocytes. Disease-relevant cell states, cytokines, risk genes, histology and serology metrics are associated with particular CTAPs. CTAPs are dynamic and can predict treatment response, highlighting the clinical utility of classifying rheumatoid arthritis synovial phenotypes. This comprehensive atlas and molecular, tissue-based stratification of rheumatoid arthritis synovial tissue reveal new insights into rheumatoid arthritis pathology and heterogeneity that could inform novel targeted treatments.


Conflict of interest statement

A.H.J. reports research support from Amgen outside the submitted work. K. Wei is a consultant for Mestag Therapeutics and Gilead Sciences and reports grant support from Gilead Sciences. S.M.G. reports research support from Novartis and is a consultant for UCB, outside the submitted work. V.M.H. is a co-founder of Q32 Bio and has previously received sponsored research from Janssen and been a consultant for Celgene and BMS, outside the submitted work. A.F. reports personal fees from Abbvie, Roche and Janssen and grant support from Roche, UCB, Nascient, Mestag, GlaxoSmithKline and Janssen, outside the submitted work. D.A.R. reports personal fees from Pfizer, Janssen, Merck, Scipher Medicine, GlaxoSmithKline and Bristol-Myers Squibb and grant support from Janssen and Bristol-Myers Squibb, outside the submitted work. In addition, D.A.R. is a co-inventor on a patent submitted on T peripheral helper cells. M.B.B. is a founder for Mestag Therapeutics and a consultant for GlaxoSmithKline, 4FO Ventures and Scailyte AG. S.R. is a founder for Mestag Therapeutics, a scientific advisor for Janssen and Pfizer, and a consultant for Gilead and Rheos Medicines.

Figures

Fig. 1
Fig. 1. Overview of the multi-modal single-cell synovial tissue pipeline and cell-type abundance analysis that reveals distinct rheumatoid arthritis CTAPs.
ad, Description (a) of the patient recruitment, clinical and histologic metrics, synovial sample processing pipeline and computational analysis strategy, including identification of major cell types and fine-grained cell states (b), definition of distinct rheumatoid arthritis CTAPs (c), and cell neighbourhood associations with each CTAP or with clinical or histologic parameters for each major cell type (d). OA, osteoarthritis; RA, rheumatoid arthritis; sig., significant. e, Integrative uniform manifold approximation and projection (UMAP) based on mRNA and protein discriminated major cell types, f, Hierarchical clustering of cell-type abundances captures six rheumatoid arthritis subgroups, referred to as CTAPs. The nine osteoarthritis samples are shown as a comparison. Each bar represents one synovial sample, coloured by the proportion of each major cell type. g, PCA of major cell-type abundances. Each dot represents a sample, plotted based on its PC1 and PC2 projections and coloured by CTAPs. h, Representative synovial tissue fragments from each of the CTAPs. Top row, haematoxylin and eosin (H&E) staining. Middle row, immunofluorescence microscopy for CD3, CD34, CD68, CD90, CLIC5 and HLA-DR. Bottom row, immunofluorescence microscopy for CD3, CD20 and CD138. Scale bars: 100 μm (CTAP-EFM) and 250 μm (all other images). Single-colour images are presented in Supplementary Fig. 4. A total of 150 fragments from 36 donors were stained in batches and analysed as a single cohort. Parts of Fig. 1a were generated using Servier Medical Art, provided by Servier, licensed under a Creative Commons Attribution 3.0 unported license.
Fig. 2
Fig. 2. Cell-type-specific single-cell analysis captures 77 distinct cell states in rheumatoid arthritis synovium.
af, Cell-type-specific reference UMAPs for T cells (a) B/plasma cells (b), NK cells (c), myeloid cells (d), stromal cells (e) and endothelial cells (f), coloured by fine-grained cell-state clusters. MT, mitochondrial; MZ, marginal zone; pDC, plasmacytoid dendritic cell.
Fig. 3
Fig. 3. Different T cell, B cell and NK cell populations are associated with rheumatoid arthritis CTAPs.
a, Associations of T cell neighbourhoods with CTAP-TB and CTAP-TF. P values are from the CNA test for each CTAP within T cells. b, Associations of B/plasma cell neighbourhoods with CTAP-TB. c, Percentage of TPH (T-7) as a proportion of T cells and CD11c+ LAMP1+ ABCs (B-5) as a proportion of B/plasma cells for each donor sample. R and P values are calculated from Pearson correlation and two-sided t-tests, respectively. The shaded region represents 95% confidence interval. d, Plasmablast count (left), ABC count (centre) or percentage of annexin+ cells (right) stratified by co-cultured T cell subset. Points represent samples and shapes correspond to samples from the same donor, which were tested in independent experiments (n = 3). Data are mean ± s.d. e, Associations of NK cell neighbourhoods with CTAP-TF. a,b,d, For all CNA results, cells in UMAPs are coloured red (positive) or blue (negative) if their neighbourhood is significantly associated with the CTAP (false discovery rate (FDR) < 0.05), and grey otherwise. Distributions of neighbourhood correlations are shown for clusters with more than 50% of neighbourhoods correlated with the CTAP at FDR < 0.05. Global P values were obtained based on permutation testing from the CNA package.
Fig. 4
Fig. 4. Different stromal, myeloid and endothelial cell populations are associated with rheumatoid arthritis CTAPs.
a, Association of stromal cell neighbourhoods with CTAP-TF, CTAP-M and CTAP-F. b, Association of myeloid cell neighbourhoods with CTAP-EFM, CTAP-M and CTAP-F for all CNA results. Cells in UMAPs are coloured red (positive) or blue (negative) if their neighbourhood is significantly associated with the CTAP (FDR < 0.05), and grey otherwise. Distributions of neighbourhood correlations are shown for clusters with more than 50% of neighbourhoods correlated with the CTAP at FDR < 0.05. Global P values were obtained based on the permutation testing from the CNA package.
Fig. 5
Fig. 5. Single-cell CNA reveals significant association of cell states with disease indicators, genetic factors and treatment response.
a, Heat map of CNA associations of specific cell states with each rheumatoid arthritis CTAP. Colours represent the percentage of cell neighbourhoods from each cell state with local (neighbourhood-level) phenotype correlations passing FDR < 0.05 significance from white to pink (expanded) or green (depleted). Cell types significantly associated globally (at cell-type level) with a phenotype at permutation P < 0.05 are boxed in black. b, Alluvial plot showing CTAP classification of samples prior to and at week 16 after starting treatment with either tocilizumab or rituximab (n = 45). c, Associations between clinical response and CTAPs after correcting for sex, age, treatment and CCP status in the baseline (week 0) samples from the R4RA study (n = 133). The percentage of variance explained by CTAPs alone and P value are calculated with ANOVA tests. Dots represent odds ratios and bars represent 95% confidence intervals. d, Significance of correlations between rheumatoid arthritis risk gene expression and CTAP-associated cells. Significance levels are shown in red (P < 0.01), yellow (0.01 < P < 0.05), and white (P > 0.05). Genes with low counts (more than one unique molecular identifier among less than 5% of cells with a given cell type) were not analysed in that cell type (grey boxes). Bottom, UMAPs displaying normalized expression levels of selected genes in T cells (IL6R and LEF1), B cells (WDFY4) and endothelial cells (PRKCH).
Extended Data Fig. 1
Extended Data Fig. 1. Robust CTAP definition and quantitative cellular histology analysis.
a, UMAPs of CITE-seq antibody-based expression of cell-type lineage protein markers. Cells are colored based on expression from blue (low) to yellow (high). b, Mean Jaccard similarity coefficient to test CTAP stability by bootstrapping 10,000 times for each tested number of patient subgroups ranging from 2 to 10. c, Mean Jaccard similarity coefficient for each CTAP, comparing full clustering and 10,000 bootstrapped datasets. d, Average proportions of each major cell type among samples in each CTAP. Overall average proportions across all the samples are shown as a comparator. Asterisk represents the proportion that is greater than the overall average for that cell type, e, PCA of samples based on cell-type abundances, adjusting for disease duration and treatment. Each dot represents a sample, plotted based on its PC1 and PC2 projections and colored by CTAPs. f, Projection of OA samples onto PCA of samples based on cell-type abundances from Fig. 1j. OA samples are marked with gray points; RA samples are colored based on CTAP (left) or in blue (right). g, PCA of samples based on pseudo-bulk gene expression of 55 soluble immune mediators. Each dot represents a sample, plotted based on its PC1 and PC2 projections and colored by CTAPs. h, Heatmap of pseudo-bulk gene expression of soluble immune mediators across samples, grouped by CTAP. Boxes are colored based on the gene’s scaled pseudo-bulk expression across samples. i, Bar graph of the proportion of total cells located in high-density and low-density fragments, as captured by histology imaging. Quantitation of total cellular composition demonstrated that fragments with highest cell density (top 50%) contained 86% of total cells and are therefore likely the primary drivers of CTAP classification. j, Box plots of the proportion of cells in high-density fragments (N = 76) expressing each marker in histology imaging, stratified by CTAP. Points represent outlier samples (> 1.5 * IQR from median). Box plots show median (vertical bar), 25th and 75th percentiles (lower and upper bounds of the box, respectively) and 1.5 x IQR (or minimum/maximum values; end of whiskers). P-values are calculated with one-way ANOVA tests with Bonferroni correction.
Extended Data Fig. 2
Extended Data Fig. 2. Relative enrichment of fine-grain cell clusters across CTAPs and OA.
a-f, Heatmaps show the average proportions of each cluster in the given cell type across patient samples in each RA CTAP and OA, scaled within each cluster.
Extended Data Fig. 3
Extended Data Fig. 3. T cell-specific analysis.
a, T cell UMAP colored by fine-grained cell-state clusters, b, Expression of selected surface proteins among T cells. Cells are colored from blue (low) to yellow (high), c, Heatmap of surface protein expression in T cell clusters colored according to the average normalized expression across cells in the cluster, d, Heatmap of gene expression in T cell clusters colored according to the average normalized expression across cells in the cluster, scaled for each gene across clusters, e, Distribution of T cells across clusters, stratified by CTAP. The size of each segment of each bar corresponds to the average proportion of cells in that cluster across donors from that CTAP. f, Number of T cells per individual, stratified by CTAP. Points represent individuals (N = 82); OA (N = 9), (EFM (N = 7), F (N = 11), TF (N = 8), TB (N = 14), TM (n = 12), M (N = 18). Box plots show median (vertical bar), 25th and 75th percentiles (lower and upper bounds of the box, respectively) and 1.5 x IQR (or minimum/maximum values; end of whiskers).
Extended Data Fig. 4
Extended Data Fig. 4. B/plasma cell-specific analysis.
a, B/plasma cell UMAP colored by fine-grained cell state clusters, b Expression of selected surface proteins among B/plasma cells. Cells are colored from blue (low) to yellow (high), c, Heatmap of surface protein expression in B/plasma cell clusters colored according to the average normalized expression across cells in the cluster, d, Heatmap of gene expression in B/plasma cell clusters colored according to the average normalized expression across cells in the cluster, scaled for each gene across clusters, e, Distribution of B/plasma cells across clusters, stratified by CTAP. The size of each segment of each bar corresponds to the average proportion of cells in that cluster across donors from that CTAP. f, Number of B/plasma cells per individual, stratified by CTAP. Points represent individuals (N = 82); OA (N = 9), EFM (N = 7), F (N = 11), TF (N = 8), TB (N = 14), TM (N = 12), M (N = 18). Box plots show median (vertical bar), 25th and 75th percentiles (lower and upper bounds of the box, respectively) and 1.5 x IQR (or minimum/maximum values; end of whiskers). g, Heatmap of correlations between select T and B cell subsets, colored by Pearson correlation between per-donor proportions. h, Schematic representation of the experimental design of the T cell functional assays and representative flow cytometry plots showing gating of plasmablasts (CD27hi CD38hi CD19+ cells), ABC B cells (CD11c+ CD21 CD19+ cells) and dead target cells (Annexin V+). Parts of this schematic were created using BioRender.
Extended Data Fig. 5
Extended Data Fig. 5. NK cell-specific analysis.
a, NK cell UMAP colored by fine-grained cell state clusters, b, Expression of selected surface proteins or mRNA transcripts among NK cells colored from blue (low) to yellow (high), c, Heatmap of surface protein expression in NK cell clusters colored according to the average normalized expression across cells in the cluster, d, Heatmap of gene expression in NK cell clusters colored according to the average normalized expression across cells in the cluster, scaled for each gene across clusters, e, Distribution of NK cells across clusters, stratified by CTAP. The size of each segment of each bar corresponds to the average proportion of cells in that cluster across donors from that CTAP. f, Number of NK cells per individual, stratified by CTAP. Points represent individuals (N = 82); OA (N = 9), EFM (N = 7), F (N = 11), TF (N = 8), TB (N = 14), TM (N = 12), M (N = 18). Box plots show median (vertical bar), 25th and 75th percentiles (lower and upper bounds of the box, respectively) and 1.5 x IQR (or minimum/maximum values; end of whiskers). g, Heatmap colored by Pearson correlation between per-donor CD8+ T cell and NK cell cluster abundances.
Extended Data Fig. 6
Extended Data Fig. 6. Myeloid cell-specific analysis.
a, Myeloid cell UMAP colored by fine-grained cell state clusters, b, Expression of selected surface proteins among myeloid cells colored from blue (low) to yellow (high), c, Heatmap of surface protein expression in myeloid cell clusters colored according to the average normalized expression across cells in the cluster, d, Heatmap of gene expression in myeloid cell clusters colored according to the average normalized expression across cells in the cluster, scaled for each gene across clusters, e, Distribution of myeloid cells across clusters, stratified by CTAP. The size of each segment of each bar corresponds to the average proportion of cells in that cluster across donors from that CTAP. f, Number of myeloid cells per individual, stratified by CTAP. Points represent individuals (N = 82); OA (N = 9), EFM (N = 7), F (N = 11), TF (N = 8), TB (N = 14), TM (N = 12), M (N = 18). Box plots show median (vertical bar), 25th and 75th percentiles (lower and upper bounds of the box, respectively) and 1.5 x IQR (or minimum/maximum values; end of whiskers). g, Schematic representation of the experimental design of the myeloid cell assays. Parts of this schematic were created using BioRender. h, Linear discriminant analysis classification of bulk RNA-seq obtained from myeloid cells cultured in the indicated conditions. Each condition was performed with three biological replicates, and cluster proportions in each pie chart were calculated from the mean of the posterior probability values across replicates. i, Heatmap showing expression of selected CTAP-relevant genes in bulk RNA-seq of blood monocytes cultured in the indicated conditions. Columns correspond to three biological replicates for each condition, and boxes are colored by normalized gene expression.
Extended Data Fig. 7
Extended Data Fig. 7. Stromal- and endothelial-specific analysis.
a, Stromal cell UMAP colored by fine-grained cell state clusters, b, Expression of selected surface proteins among stromal cells colored from blue (low) to yellow (high), c, Heatmap of surface protein expression in stromal cell clusters colored according to the average normalized expression across cells in the cluster, d, Heatmap of gene expression in stromal cell clusters colored according to the average normalized expression across cells in the cluster, scaled for each gene across clusters, e, Distribution of stromal cells across clusters, stratified by CTAP. The size of each segment of each bar corresponds to the average proportion of cells in that cluster across donors from that CTAP, f, Number of stromal cells per individual, stratified by CTAP. Points represent individuals (N = 82); OA (N = 9), (EFM (N = 7), F (N = 11), TF (N = 8), TB (N = 14), TM (N = 12), M (N = 18). Box plots show median (vertical bar), 25th and 75th percentiles (lower and upper bounds of the box, respectively) and 1.5 x IQR (or minimum/maximum values; end of whiskers), g, Endothelial cell UMAP colored by fine-grained cell state clusters, h, Expression of selected surface proteins among endothelial cells colored from blue (low) to yellow (high), i, Heatmap of gene expression in endothelial cell clusters colored according to the average normalized expression across cells in the cluster, scaled for each gene across clusters, j, Distribution of endothelial cells across clusters, stratified by CTAP. The size of each segment of each bar corresponds to the average proportion of cells in that cluster across donors from that CTAP. k, Number of endothelial cells per individual, stratified by CTAP. Points represent individuals (N = 82); OA (N = 9), EFM (N = 7), F (N = 11), TF (N = 8), TB (N = 14), TM (n = 12), M (N = 18). Box plots show median (vertical bar), 25th and 75th percentiles (lower and upper bounds of the box, respectively) and 1.5 x IQR (or minimum/maximum values; end of whiskers). l, Association of endothelial cell neighborhoods with CTAP-M and CTAP-F. For these CNA results, cells in UMAPs are colored in red (positive) or blue (negative) if their neighborhood is significantly associated with the CTAP (FDR < 0.05), and gray otherwise. Distributions of neighborhood correlations are shown for clusters with >50% of neighborhoods correlated with the CTAP at FDR < 0.05; global p-values were obtained based on the permutation testing from the CNA package.
Extended Data Fig. 8
Extended Data Fig. 8. Association of single-cell RA CTAPs with different clinical characteristics.
a, Associations between clinical features and CTAPs (N = 70), adjusting covariates for age, sex, cell number, and clinical collection site. Percentage of variance explained by CTAPs alone and p-value are calculated with ANOVA tests. Points represent odds ratios and bars represent 95% confidence intervals. b, Clinical, histologic, and ultrasound parameters of patients in each CTAP. For all box plots, each dot represents an individual (N = 70); boxes show median (vertical bar), 25th and 75th percentiles (lower and upper bounds of the box, respectively) and 1.5 x IQR (or minimum/maximum values; end of whiskers), c, Dotplot of Krenn inflammation versus power doppler scores. Each point is a patient. d, CCP levels among seropositive patients alone (N = 59). Points represent individuals and box plots show median (vertical bar), 25th and 75th percentiles (lower and upper bounds of the box, respectively) and 1.5 x IQR (or minimum/maximum values; end of whiskers)., e, Corrected RA HLA-DRB1 risk scores and their associations with CTAPs, percent of variance explained by CTAPs only and p-value are calculated with ANOVA test, f, Clinical, demographic, and histologic metrics plotted by percentage of variance explained by CTAPs and the ANOVA p-value for its association with CTAPs. Features in red are significant at p < 0.05. g, CTAP frequency among seropositive (CCP-positive, RF-positive, or both) versus seronegative patients. h, CTAP frequency by sex. i, CTAP frequency by smoking history, j, CTAP frequency by anatomic site of synovial biopsy. k, Number of samples per CTAP in each collection/cryopreservation site. l, Number of patient samples for each CTAP between biopsy and synovectomy, m-n, Association of age and RA duration with CTAPs (N = 70), adjusting covariates for age, sex, cell number, and clinical collection site. Points represent odds ratios and bars represent 95% confidence intervals. Percentage of variance explained by CTAPs alone and p-values are calculated with one-way ANOVA tests. o, Sample distributions across CTAPs by recruitment cohort, p, Heatmap of clinical variables for patient samples grouped by CTAP. Boxes are colored based on z-score of the metric across samples. “X” represents missing data.
Extended Data Fig. 9
Extended Data Fig. 9. Correlations of cytokines/receptors with CTAP-associated cells.
a, Heatmap depicting expression profiles of cell type cluster-specific soluble factors, b, Percent contribution among cytokine mRNA-expressing cells from each major cell type, c, At top, expression of CXCL13, a representative cytokine that is significantly correlated with CTAP-associated cell neighborhoods. Cells in UMAPs of CTAP associations are colored in red (positive) or blue (negative) if their neighborhood is significantly associated with the CTAP (FDR < 0.05), and gray otherwise. Cells in expression UMAPs are colored from blue (low) to yellow (high). Below, an aggregate heatmap visualizing the cytokines and receptors whose expressions are significantly correlated (r > 0.5) with CTAP-associated cells; we then hierarchically clustered them based on cell type-specific CTAPs. Each gene is labeled with receptor/ligand designation. d, Pipeline and results to map and classify flow cytometry samples by single-cell RA CTAPs. Bar plot shows accuracy of flow sample classification (i.e., assigned to the same CTAP as a single-cell sample from the same patient).
Extended Data Fig. 10
Extended Data Fig. 10. Assigning CTAP labels to bulk RNA-seq samples and clinical association analysis.
a, Confusion matrix showing CTAP assignment by the single-cell CITE-seq panel (gold standard) versus classification of synovial tissue bulk RNA-seq obtained from the same individuals (N = 7). b, Patients per CTAP category in the current AMP study, which enrolled a clinically diverse patient cohort, versus the published R4RA study, which restricted enrollment to patients with inadequate response to TNF inhibitor therapies. c, Baseline DAS28-CRP scores stratified by predicted CTAP (N = 133 patients). d, Baseline DAS28-CRP score stratified by clinical response status ( ≥ 50% improved CDAI after treatment) (N = 133 patients). In c and d, Points represent individuals and box plots show median (vertical bar), 25th and 75th percentiles (lower and upper bounds of the box, respectively) and 1.5 x IQR (or minimum/maximum values; end of whiskers). e, Confusion matrix showing predicted CTAP assignment of pre-treatment (week 0) and post-treatment (week 16) synovial tissue samples obtained from 45 patients. f-g, Confusion matrix and alluvial plot showing predicted CTAP assignment before and after treatment with rituximab (N = 29). h-i, Confusion matrix and alluvial plot showing predicted CTAP assignment before and after treatment with tocilizumab (N = 16). j, Graph of responder and non-responders stratified by CTAP (N = 133) among all patients in the R4RA study. k, Graph of responders and non-responders among patients receiving tocilizumab (left, N = 65) or rituximab (right, N = 68), stratified by CTAP.

References

    1. Gravallese EM, Firestein GS. Rheumatoid arthritis—common origins, divergent mechanisms. N. Engl. J. Med. 2023;388:529–542. doi: 10.1056/NEJMra2103726. - DOI - PubMed
    1. Alivernini S, Laria A, Gremese E, Zoli A, Ferraccioli G. ACR70-disease activity score remission achievement from switches between all the available biological agents in rheumatoid arthritis: a systematic review of the literature. Arthritis Res. Ther. 2009;11:R163. doi: 10.1186/ar2848. - DOI - PMC - PubMed
    1. Alamanos Y, Voulgari PV, Drosos AA. Incidence and prevalence of rheumatoid arthritis, based on the 1987 American College of Rheumatology criteria: a systematic review. Semin. Arthritis Rheum. 2006;36:182–188. doi: 10.1016/j.semarthrit.2006.08.006. - DOI - PubMed
    1. Viatte S, Barton A. Genetics of rheumatoid arthritis susceptibility, severity, and treatment response. Semin. Immunopathol. 2017;39:395–408. doi: 10.1007/s00281-017-0630-4. - DOI - PMC - PubMed
    1. Oliver J, Plant D, Webster AP, Barton A. Genetic and genomic markers of anti-TNF treatment response in rheumatoid arthritis. Biomark. Med. 2015;9:499–512. doi: 10.2217/bmm.15.18. - DOI - PubMed

Publication types

MeSH terms