. 2023 Dec;624(7990):109-114.
doi: 10.1038/s41586-023-06644-x. Epub 2023 Nov 8.

Revising the global biogeography of annual and perennial plants

Affiliations

Revising the global biogeography of annual and perennial plants

Tyler Poppenwimer et al. Nature. 2023 Dec.

Erratum in

Abstract

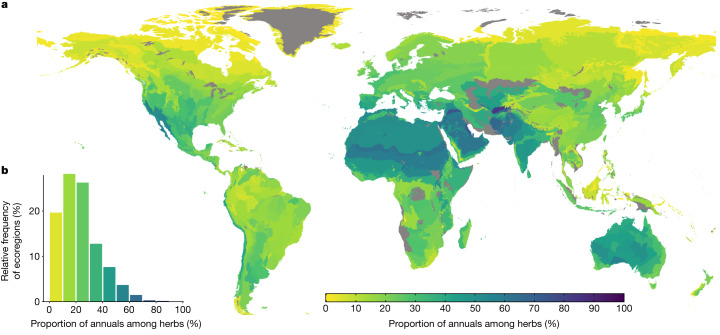
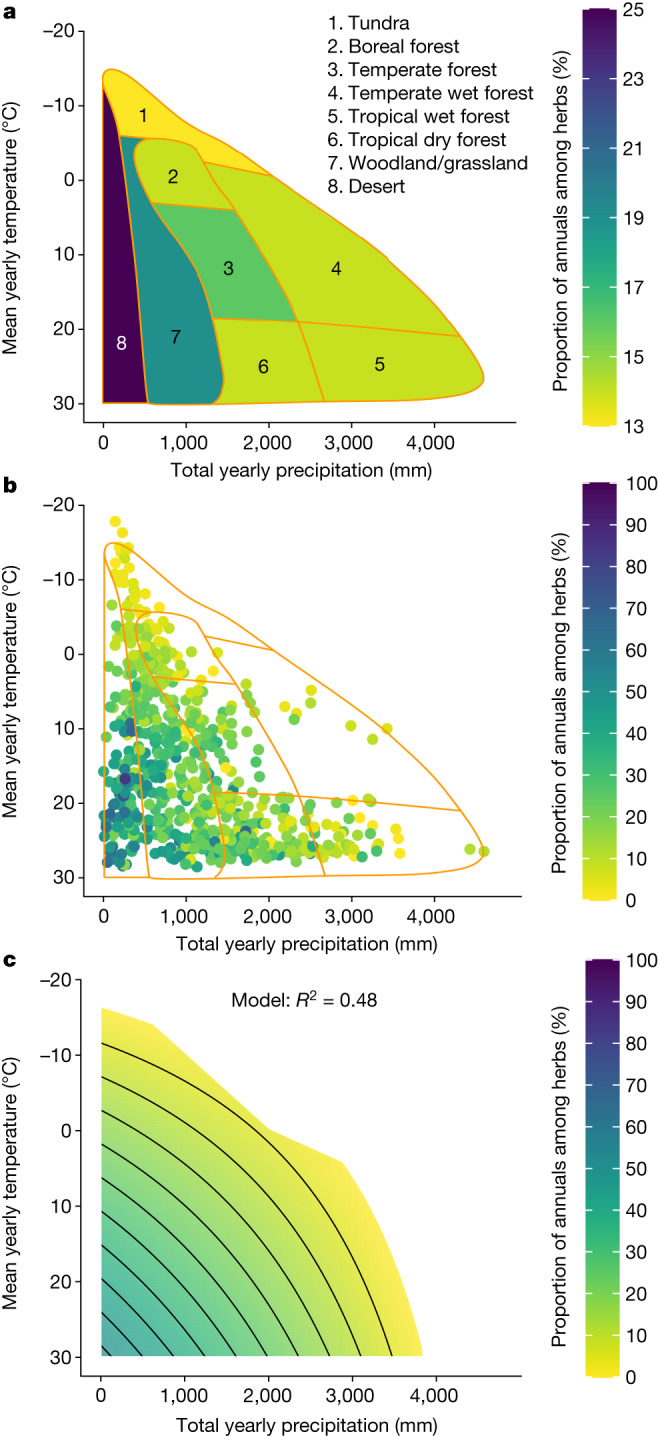
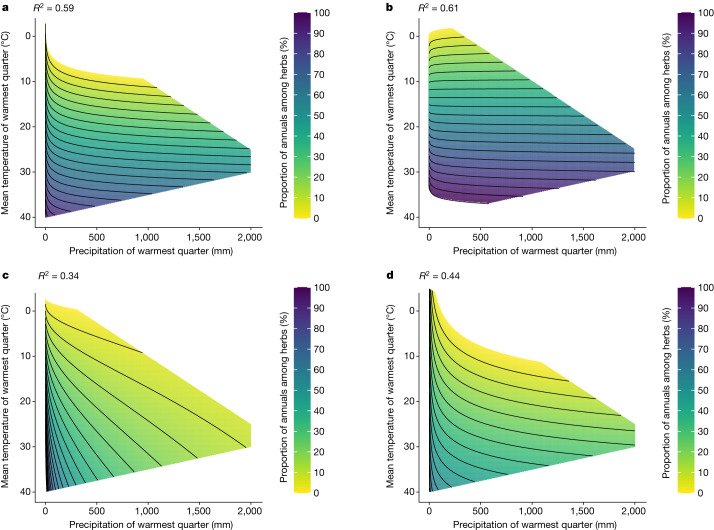
There are two main life cycles in plants-annual and perennial1,2. These life cycles are associated with different traits that determine ecosystem function3,4. Although life cycles are textbook examples of plant adaptation to different environments, we lack comprehensive knowledge regarding their global distributional patterns. Here we assembled an extensive database of plant life cycle assignments of 235,000 plant species coupled with millions of georeferenced datapoints to map the worldwide biogeography of these plant species. We found that annual plants are half as common as initially thought5-8, accounting for only 6% of plant species. Our analyses indicate that annuals are favoured in hot and dry regions. However, a more accurate model shows that the prevalence of annual species is driven by temperature and precipitation in the driest quarter (rather than yearly means), explaining, for example, why some Mediterranean systems have more annuals than desert systems. Furthermore, this pattern remains consistent among different families, indicating convergent evolution. Finally, we demonstrate that increasing climate variability and anthropogenic disturbance increase annual favourability. Considering future climate change, we predict an increase in annual prevalence for 69% of the world's ecoregions by 2060. Overall, our analyses raise concerns for ecosystem services provided by perennial plants, as ongoing changes are leading to a higher proportion of annual plants globally.


Conflict of interest statement

The authors declare no competing interests.

Figures

Fig. 1
Fig. 1. The worldwide biogeography of annual plant prevalence.
a, A map of the proportion of annual species (among herbaceous species) in each ecoregion. b, The distribution of annual plant proportions among ecoregions. Ecoregions with insufficient data (Methods) are coloured grey, resulting in 682 coloured ecoregions.
Fig. 2
Fig. 2. The effects of total yearly precipitation and mean yearly temperature on the proportion of annuals (among herbaceous species).
a, The proportion of annuals in each of Whittaker’s biomes. b, The proportion of annuals in each ecoregion (the outline of Whittaker’s biomes is marked by orange lines). c, Predictions of a linear regression model of the proportion of annuals as a function of the mean yearly precipitation and temperature (contour lines every 5%). Note that the scale is different for a. n = 682.
Fig. 3
Fig. 3. The effects of the precipitation and mean temperature of the warmest quarter on the proportion of annuals (among herbaceous species).
a, The proportion of annuals in each ecoregion. b, The predictions of a linear regression model of annual proportion as a function of precipitation and mean temperature of the warmest quarter with contour lines every 5%. n = 682.
Fig. 4
Fig. 4. The effects of the precipitation and mean temperature of the warmest quarter on the proportion of annuals (among herbaceous species) in the four most annual-rich families (predictions of the linear regression model).
a, The effects in Asteraceae (1,566 species). n = 465. b, The effects in Brassicaceae (767 species). n = 262. c, The effects in Fabaceae (1,332 species). n = 382. d, The effects in Poaceae (1,738 species). n = 513. Contour lines are drawn every 5% for all panels.
Extended Data Fig. 1
Extended Data Fig. 1. The global biogeography of the proportion of annual species and the effects of yearly and quarterly climate patterns.
A, the global proportion of annuals in ecoregions with sufficient data; ecoregions with insufficient data (see Methods) are coloured grey resulting in 723 coloured cells. B, The distribution of annual proportions among ecoregions. C, The annual proportions in each of Whittaker’s Biomes. D, A scatterplot of the effects of mean yearly precipitation and temperature (the outline of Whittaker’s biomes is marked by orange lines). e, Predictions of a regression model of the annual proportions as a function of mean yearly temperature and precipitation (contour lines every 5%). F, A scatterplot of the effects of total precipitation and mean temperature of the warmest quarter. G, Predictions of a regression model of the annual proportions as a function of total precipitation and mean temperature of the warmest quarter (contour lines every 5%). Note that the scale is different for panel C. N = 723.
Extended Data Fig. 2
Extended Data Fig. 2. The predictions of alternative regression methods for the yearly and quarterly models.
A and B depict a logit transformation for the proportion of annual herbs, with A showing the yearly model and B showing the quarterly model. C and D depict the predictions of a Poisson Generalized Linear Model (GLM) with an offset (log10 of the species in an ecoregion) to obtain a rate for the proportion of annual herbs, with c showing the yearly model and D showing the quarterly model. Contour lines are every 5%.
Extended Data Fig. 3
Extended Data Fig. 3. The predicted change in the proportion of annual herbs in 2100 based on expected climate patterns.
A, The absolute change in the proportion of annual herbs in ecoregions with sufficient data; those with insufficient data are coloured grey, resulting in 723 ecoregions. B, The current distribution of annual herbs proportions among ecoregions with the mean and median marked by vertical lines. C, The predicted future distribution of annual herbs proportions among ecoregions with mean and median demarcated. D, The absolute change in the proportion of annual herbs in ecoregions grouped by Whittaker Biome (the colour scale is the same as in A-C). N = 723.
Extended Data Fig. 4
Extended Data Fig. 4. The global biogeography of the proportion of annual herbs and the effects of yearly and quarterly climate patterns using a gridded system.
A, The global proportion of annuals herbs in cells with sufficient data; cells with insufficient data (see Methods) are coloured grey resulting in 5,824 coloured cells. B, The distribution of annual herbs proportions among grid cells. C, A scatterplot of the effects of mean yearly precipitation and temperature (the outline of Whittaker’s biomes is marked by orange lines). D, Predictions of a regression model of the annual herbs proportion as a function of mean yearly temperature and precipitation (contour lines every 5%). E, A scatterplot of the effects of total precipitation and mean temperature of the warmest quarter. F, Predictions of a regression model of the annual herbs proportions as a function of total precipitation and mean temperature of the warmest quarter (contour lines every 5%). N = 5,824. G, A sample of how enlarged grid cells (150 km × 150 km) omit islands/coastal regions.
Extended Data Fig. 5
Extended Data Fig. 5. An exploration of the potential biases in the dataset.
A-C depicts the proportion of present GBIF species the dataset is missing, A as a global distribution map, B as a distribution of ecoregions, and c organized according to Whittaker Biomes. D-F shows the correlation of annual herbs (D and E) and annuals (F and G) with the number of GBIF species and observations. The blue lines depict the best-fit line. H, The distribution of the proportion of species in each family the dataset is missing.
Extended Data Fig. 6
Extended Data Fig. 6. Scatter plots depicting the correlation between the Human Footprint and various BioClim Features.
A-C show the correlation of the Human Footprint with yearly temperature and precipitation individually A, B and together C. D-F show the correlation of the Human Footprint with quarterly temperature and precipitation individually D, E and together F. The blue lines depict the best-fit line. Note that the correlation in E and F are fitted to the log transformation of the quarterly precipitation.

References

    1. Friedman J. The evolution of annual and perennial plant life histories: ecological correlates and genetic mechanisms. Annu. Rev. Ecol. Evol. Syst. 2020;51:461–481. doi: 10.1146/annurev-ecolsys-110218-024638. - DOI
    1. Raunkiær, C. Über das Biologische Normalspektrum (Andr. Fred. Host & Son, Kgl. Hof-Boghandel, 1918).
    1. Glover JD, et al. Increased food and ecosystem. Science. 2010;328:1638–1640. doi: 10.1126/science.1188761. - DOI - PubMed
    1. Vico G, Manzoni S, Nkurunziza L, Murphy K, Weih M. Trade-offs between seed output and life span—a quantitative comparison of traits between annual and perennial congeneric species. N. Phytol. 2016;209:104–114. doi: 10.1111/nph.13574. - DOI - PubMed
    1. Whittaker, R. H. Communities and Ecosystems (Macmillan, 1975).

Publication types