. 2023 Dec;624(7990):182-191.
doi: 10.1038/s41586-023-06716-y. Epub 2023 Nov 8.

Plant carbonic anhydrase-like enzymes in neuroactive alkaloid biosynthesis

Affiliations

Plant carbonic anhydrase-like enzymes in neuroactive alkaloid biosynthesis

Ryan S Nett et al. Nature. 2023 Dec.

Abstract

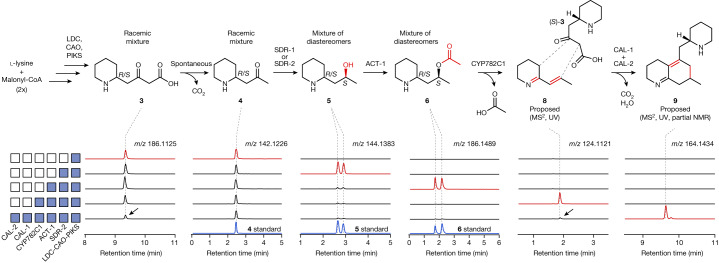
Plants synthesize numerous alkaloids that mimic animal neurotransmitters1. The diversity of alkaloid structures is achieved through the generation and tailoring of unique carbon scaffolds2,3, yet many neuroactive alkaloids belong to a scaffold class for which no biosynthetic route or enzyme catalyst is known. By studying highly coordinated, tissue-specific gene expression in plants that produce neuroactive Lycopodium alkaloids4, we identified an unexpected enzyme class for alkaloid biosynthesis: neofunctionalized α-carbonic anhydrases (CAHs). We show that three CAH-like (CAL) proteins are required in the biosynthetic route to a key precursor of the Lycopodium alkaloids by catalysing a stereospecific Mannich-like condensation and subsequent bicyclic scaffold generation. Also, we describe a series of scaffold tailoring steps that generate the optimized acetylcholinesterase inhibition activity of huperzine A5. Our findings suggest a broader involvement of CAH-like enzymes in specialized metabolism and demonstrate how successive scaffold tailoring can drive potency against a neurological protein target.


Conflict of interest statement

The authors declare no competing interests.

Figures

Fig. 1
Fig. 1. Assessing unknown steps in Lycopodium alkaloid biosynthesis.
a, An unknown series of chemical transformations are necessary to convert early precursors into the diverse Lycopodium alkaloid scaffolds found in club mosses. Note that the scaffold types shown in red/blue here are not compounds observed in nature but are visual representations of the main structural classes in the Lycopodium alkaloids. Shown in boxes are representative Lycopodium alkaloids, including the AChE inhibitor, HupA (17). b, Overview of transcriptomic-guided workflow for identifying new biosynthetic enzyme candidates. c.p.m., counts per million. The image of Phlegmariurus tetrastichus is adapted with permission from ref. (Nett et al.), National Academy of Sciences. Source Data
Fig. 2
Fig. 2. Stepwise discovery of early biosynthetic enzymes contributing to scaffold formation.
Shown are the extracted ion chromatograms (EICs) pertaining to the relevant m/z value for each proposed intermediate (m/z values shown under each compound) upon the transient co-expression of candidate biosynthetic genes from P. tetrastichus (blue boxes) in N. benthamiana. In general, compounds were observed as the [M + H]+ ion. For 9, the in-source fragment m/z 164.1434 ([M-C5H9N + H]+) is the principal detected ion and thus serves as a diagnostic for this compound. All compounds were detected through LC–MS using a HILIC column, with the exception of 6 diastereomers, which were observed by using a C18 column. Note that y axes for each set of chromatograms are on different scales but scales are constant within an EIC plot. Black arrows indicate observed depletion of substrates on addition of CAL-1 and CAL-2. The natures of compounds 46 were confirmed through comparison to synthesized or commercially available standards. The structure of 8 is proposed on the basis of MS2 and UV analysis (Extended Data Fig. 2). The structure of 9 is proposed on the basis of MS2, UV analysis and partial NMR of purified 9 (Extended Data Fig. 3 and Supplementary Figs. 10 and 11), as well as MS2 and full NMR of an oxidized byproduct (9′, Extended Data Fig. 3 and Supplementary Figs. 12–18).
Fig. 3
Fig. 3. Neofunctionalized CAL enzymes in Lycopodium alkaloid biosynthesis.
a, Proposed mechanism for biosynthesis of 9 by PtCAL-1a/PtCAL-2a. b, Representative western blot of 6xHis-tagged CALs expressed alone or co-expressed with untagged gene constructs in N. benthamiana. A 6xHis-tagged LcLDC construct was included as an intracellular protein control. This experiment was performed more than three times with similar results routinely observed. c, EICs for production of 9 (m/z 164.1434) by apoplastic PtCAL-1a and PtCAL-2a (alone or co-expressed) with different substrate combinations. d, Time course of 9 production by apoplastic PtCAL-1a/PtCAL-2a compared to a GFP apoplast control. n = 3 reactions per condition. e, Assessment of which 3 enantiomer is used as a substrate in the formation of 9. Because 3 enantiomers could not be directly observed, chirality was inferred by measuring 4 enantiomers, which form through spontaneous decarboxylation of 3. Enantiomers were analysed as N-acetylated derivatives. Average ratios are above each bar. n = 3 reactions per condition. f, Proposed condensation of 1 and 2 catalysed by PtCAL-3 to produce (S)-3. g, Co-expression of PtCAL-3 with the rest of the pathway required to produce 9. n = 3 infiltrated leaves per condition. h, EICs for 3 (m/z 186.1125) production by PtCAL-3 apoplast protein with different substrates. i, Formation of 3 over time by apoplastic PtCAL-3 with 1 and 2 as substrates, as compared to a GFP apoplast control. n = 3 reactions per condition. j, Assessment of enantiospecific product formation by PtCAL-3 through chiral LC–MS analysis of 4 enantiomers (after N-acetylation). k, Ratio of (S)-4 and (R)-4 over time in the apoplastic PtCAL-3 reaction. For bar and line graphs, plotted values represent the mean, with error bars representing ±s.d. Statistical analyses were performed using a two-tailed Welch’s t-test assuming unequal variance. Source Data
Fig. 4
Fig. 4. A prominent role for CAL enzymes in early Lycopodium alkaloid biosynthesis.
a, Biosynthetic proposal for the early chemical transformations in Lycopodium alkaloid biosynthesis. Note that transport of intermediates across the membrane is speculative. b, Phylogenetic tree (MUSCLE alignment, neighbour-joining tree) of CAH family proteins from several kingdoms of life. Bootstrap values (100 replicates) are located at nodes. Also shown are the main active site residues for each aligned protein, with numbering corresponding to human carbonic anhydrase 2 (HsCA2, UniProt ID: P00918). Changes to the canonical/conserved sequence are highlighted in coloured boxes. Stars indicate proteins that have verified canonical CAH activity. An expanded alignment/phylogenetic tree can be found in Supplementary Fig. 2.
Fig. 5
Fig. 5. A metabolic network for the generation of an optimized AChE inhibitor, HupA (17).
New enzymes or new reactions for previously described enzymes, are coloured purple. Any Lycopodium alkaloids with common names have been verified with authentic standards. Shown below Lycopodium alkaloids are their IC50 values for the inhibition of AChE, if previously tested. Citations for these values can be found in the Methods. Note that the stereochemistry of the methyl group in 9 is predicted on the basis of the typical stereochemistry observed in isolated Lycopodium alkaloids.
Extended Data Fig. 1
Extended Data Fig. 1. Functional characterization of PtSDR-1, PtSDR-2 and PtACT-1.
a) Transient expression of PtSDR-1 and PtSDR-2 together with a biosynthetic module for 4 production (PtLDC, PtCAO, and PtPIKS) in N. benthamiana. Shown are LC–MS extracted ion chromatograms (EICs) for 4 ([M + H]+ = m/z 142.1226) and products of PtSDR-1 and PtSDR-2 (A, B, C and D) that each pertain to a single reduction ([M + H]+ = m/z 144.1383), which are shown to represent stereoisomers of 5 via comparison to authentic standards. b) MS2 spectra (m/z 144.1383, 20 V) for the new compounds produced by PtSDR-1 (A and B) and PtSDR-2 (C and D) in comparison to the co-eluting stereoisomers of 5 standard. c) Chiral LC–MS analysis of the biosynthetic products produced in N. benthamiana. Samples were N-acetylated to allow for retention and separation on a chiral column. Note that hydroxy groups were also acetylated under our derivatization conditions. The left panel shows biosynthetic N-acetyl (NAc)-4 enantiomers ([M + H]+ = m/z 184.1332) in comparison to synthesized standards, while the right panel shows biosynthetic NAc, O-acetyl (OAc)-5 stereoisomers ([M + H]+ = m/z 228.1594) in comparison to authentic standards. d) Quantification of 4 enantiomers (as N-acetylated derivatives) that are consumed by PtSDR-1 and PtSDR-2 and 5 diastereomers that are produced in the N. benthamiana transient expression system. n = 3 for each gene combination. Each bar graph shows the mean +/− standard deviation. e) Transient expression of PtACT-1 with a biosynthetic module for production of 5 diastereomers (PtLDC, PtCAO, PtPIKS and PtSDR-1 or PtSDR-2) in N. benthamiana. Shown are LC–MS EICs for 5 diastereomers ([M + H]+ = m/z 144.1383) and products of PtACT-1 (E, F, G and H) that each pertain to the addition of an acetyl group ([M + H]+ = m/z 186.1489), which are shown to represent diastereomers of 6 via comparison to a synthesized standard (which consists of multiple stereoisomers). f) MS2 spectra (m/z 186.1489, 20 V) for the new compounds produced by PtACT-1 (E and F for experiments with PtSDR-1; G and H for experiments with PtSDR-2) in comparison to the co-eluting stereoisomers of 6 standard. g) Chiral LC–MS analysis of the biosynthetic products produced by PtACT-1 in N. benthamiana. Samples were N-acetylated to allow for retention and separation on a chiral column. Note that hydroxy groups were also acetylated under our derivatization conditions, so products of PtSDR-1/PtSDR-2 would also gain an O-acetyl moiety. Shown are biosynthetic NAc-6 diastereomers ([M + H]+ = m/z 228.1594) in comparison to authentic standards. h) Biosynthetic proposal for the activities of PtSDR-1, PtSDR-2 and PtACT-1 to yield 6 diastereomers. spon., spontaneous. Source Data
Extended Data Fig. 2
Extended Data Fig. 2. Functional characterization of PtCYP782C1.
a) Transient expression of PtCYP782C1 with a biosynthetic module for the production of 6 diastereomers (PtLDC, PtCAO, PtPIKS, PtSDR-1 or PtSDR-2 and PtACT-1) in N. benthamiana. Shown are LC–MS extracted ion chromatograms (EICs) for 6 diastereomers ([M + H]+ = m/z 186.1489) and a product from PtCYP782C1 activity that represents both an oxidation and elimination of the O-acetyl group ([M + H]+ = m/z 124.1121). Note that 6 is detected here with C18 analysis, while m/z 124.1121 is observed with HILIC analysis. b) The two new mass features (putative 7, left panel, [M + H]+ = m/z 184.1332; putative 8, right panel, [M + H]+ = m/z 124.1121) generated by PtCYP782C1 activity were detected in leaf extract that was prepared under cold conditions, but were mostly lost upon incubation at room temperature. c) MS2 spectra of the two new compounds produced by PtCYP782C1 (m/z 184.1332, 20 V and m/z 124.1121, 20 V), along with predicted ion fragment structures. d) UV analysis of 8 produced via the activity of yeast microsomes enriched with PtCYP782C1, with 6 and NADPH as substrates. Shown in the top panel are the DAD (λ = 254 nm) and extracted ion (m/z 124.1121) chromatograms from LC-DAD-MS analysis. The bottom panel shows the background-extracted UV spectrum of 8 from LC-DAD analysis. Note that retention time differences between this panel and panel b are due to different columns and LC methods. e) In vitro assays with yeast microsomes containing PtCYP782C1 protein. Shown are HILIC LC–MS chromatograms representing 6, as well as the two mass features (7, m/z 184.1332 and 8, m/z 124.1121) previously identified as putative products of PtCYP782C1. We note that diastereomers of 6 are not resolved during HILIC analysis (as they are in C18 analysis) and thus only one co-eluting peak is observed here. f) Formation of 7 and 8 over the course of an in vitro reaction with PtCYP782C1-enriched yeast microsomes. Product abundance is calculated as the integration of the peak generated in the EIC for each mass ion. g) Relative activity of PtCYP782C1 microsomes at varying pH, as determined via production of both 7 and 8. Note that the scales differ between the left and right axes. h) Biosynthetic proposal for the activity of PtCYP782C1 on 6 diastereomers to produce 7 and 8. i) Possible catalytic mechanisms for the conversion of 6 into 8. Source Data
Extended Data Fig. 3
Extended Data Fig. 3. Functional characterization of PtCAL-1 and PtCAL-2 in Nicotiana benthamiana.
a) Transient expression of PtCAL-1a and PtCAL-2a with a biosynthetic module for producing 8 (PtLDC, PtCAO, PtPIKS, PtSDR-2, PtACT-1 and PtCYP782C1). Shown is an LC–MS extracted ion chromatogram (EIC) for the major ion ([M + H]+ = m/z 164.1434) associated with the activity of PtCAL-1a/PtCAL-2a when they are both co-expressed in the transient expression system. b) Quantification of new product (m/z 164.1434) abundance through the activity of PtCAL-1 and PtCAL-2 homologues in different combinations. Each bar graph shows the mean +/− standard deviation. n = 3 infiltrated leaves for each condition. c) Multiple mass ions were found to co-elute with m/z 164.1434, suggesting that this ion could be an artefact of in-source fragmentation. d) MS1 profile of the new compound generated by PtCAL-1/PtCAL-2. Note the presence of presumed parent mass ions ([M + H]+ = m/z 247.2169, [M + 2H]2+ = m/z 124.1121), which suggest that m/z 164.1434 results from an in-source loss of 1-piperideine from the proposed product 9 during ionization in the mass spectrometer. e) LC–MS EICs (m/z 164.1434, m/z 124.1121 and m/z 247.2169) comparing the biosynthetic product of PtCAL-1/PtCAL-2 (9, proposed) to a co-eluting compound in the new growth leaf tissue of Phlegmariurus tetrastichus. f) MS2 spectra (m/z 164.1434, 40 V) comparing the biosynthetic product (9) to the compound identified in P. tetrastichus extract. g) Proposed structures for major ion fragments shown in panel f. h) MS2 spectrum (m/z 247.2169, 10 V) of the parent ion for the new compound (9) with predicted structures of fragments. i) UV analysis of 9 produced via biosynthetic reconstitution in N. benthamiana. Shown in the top panel are the DAD (λ = 280 nm) and extracted ion (m/z 164.1434) chromatograms from LC-DAD-MS analysis. The bottom panel shows the background-extracted UV spectrum of 9 from LC-DAD analysis. Note that retention time differences between this panel and panels a, c and e are due to different columns and LC methods. j) Co-infiltration of 6 (m/z 186.1489, left panel) as a substrate for transiently expressed PtCYP782C1, with PtCAL-1 and PtCAL-2a co-expressed, leads to production of 8 (m/z 124.1121, middle panel). However, as shown in panel k, this does not lead to production of 9. k) Deconvolution of the substrates required for PtCAL-1/PtCAL-2 activity. For this, PtCYP782C1, PtCAL-1 and PtCAL-2 were transiently expressed in N. benthamiana and 6 was co-infiltrated as substrate. With this established, different combinations of upstream genes were included in the transient co-expression system to provide putative cosubstrates necessary for the formation of 9 (m/z 164.1434). l) Production of 9 (m/z 164.1434) coincides with the depletion of 3 (m/z 186.1125) and 8 (m/z 124.1121). Relative product abundance was quantified via integration of peaks generated in EICs. Each bar graph shows the mean +/− standard deviation. n = 3 infiltrated leaves for each condition. m) Observations of major (9-A) and minor (9-B) diastereomers of 9 upon biosynthetic reconstitution. Shown here is an EIC LC–MS chromatogram of 9, as well as MS2 comparison between the two diastereomers. n) Chiral chromatography of N-acetylated precursors was performed to assess which enantiomer of 3 (measured here via consumption of 4) serves as the substrate for production of 9. Each bar graph shows the mean +/− standard deviation. n = 3 infiltrated leaves for each condition. Statistical comparisons were made using a two-tailed Welch’s t-test assuming unequal variance. o) HILIC LC–MS analysis of a new major compound ([M + H]+ = m/z 263.2118) purified while trying to isolate 9. This compound corresponds to the addition of an oxygen, suggesting this to be an oxidized product of 9. We also observed an in-source ion fragment that pertains to the addition of a water ([M + H]+ = m/z 281.2224). p) MS2 spectrum (m/z 263.2118, 20 V) of putative 9’ and proposed oxidation of 9 to produce 9’, which can undergo water addition during ionization. q) Predicted structures of major MS2 ion fragments. The corresponding NMR data for 9’ can be found in Supplementary Figs. 12–18. r) Biosynthetic proposal for the condensation of (S)-3 and 8 by PtCAL-1 and PtCAL-2 to produce the proposed phlegmarane scaffold of 9. Partial NMR data for the structural characterization of 9 can be found in Supplementary Figs. 10 and 11. Source Data
Extended Data Fig. 4
Extended Data Fig. 4. In vitro characterization of PtCAL-1 and PtCAL-2 from isolated apoplast extract.
a) Enzymatic and synthetic reactions used to produce substrates for assays with PtCAL-1a and PtCAL-2a apoplast extracts. b) Confirmation of PtCAL-1a/PtCAL-2a (co-expressed) apoplast activity when the PIKS reaction or 1 and 2 are provided as substrates along with the CYP782C1 reaction. Shown is a LC–MS extracted ion chromatogram (EIC) for 9 (m/z 164.1434). Note that production of 9 in this system was dramatically higher when 1 and 2 were used as substrates (to generate 3) with the CYP782C1 reaction. For all other panels in this figure, indication of +3 indicates that 1 and 2 were used to produce this substrate spontaneously in vitro. c) In vitro apoplast extract reactions with different combinations of apoplast extracts and substrates. The different conditions are listed and numbered to the left of this panel. Shown are the EICs for the substrates (3 and 8) as well as the product (9). Note that in these experiments, 3 is generated by the spontaneous condensation of 1 and 2. d) Time course of 9 production, as measured via ion abundance (m/z 164.1434) Shown are GFP apoplast extracts (control) or PtCAL-1a/PtCAL-2a (co-expressed) extracts with 3 and 8 generated as in vitro substrates. Additionally, the presence of PtCAL-3 in this reaction was assessed here. n = 3 individual reactions for each condition. Shown in the inset are P values for the statistical comparison between PtCAL-1a/PtCAL-2a +/− PtCAL-3. e) Chiral LC–MS EICs analysing the abundance of N-acetylated 4 enantiomers in the PtCAL-1a/PtCAL-2a +3, +8 reaction. Note the decrease in the abundance of NAc-(S)-4 in the presence of PtCAL-1a/PtCAL-2a (indicated with arrow). This is quantified in Fig 3e. f) Two possible mechanisms to initiate formation of the 9 scaffold. g) Analysis to determine if PtCAL-1a/PtCAL-2a accelerates decarboxylation of 3. Shown are the ratios of 4 to 3 ion abundances over two hours when 3 is included as a substrate alone with either GFP or PtCAL-1a/PtCAL-2a. n = 3 individual reactions for each condition. n.s. = not significant, P > 0.05. h) Eight-hour time point for assessing the potential decarboxylation of 3 by PtCAL-1a/PtCAL-2a apoplast. n = 3 individual reactions for each condition. i) Effect of a zinc (Zn) chelator (2,6-pyridinedicarboxylic acid, PDCA) and zinc supplementation of the enzyme activity of PtCAL-1a/PtCAL-2a, as measured by 9 ion abundance. n = 3 individual reactions for each condition. For all statistical analyses in this figure, a two-tailed Welch’s t-test assuming unequal variance was used. All bar graphs in this figure show the mean +/− standard deviation. Source Data
Extended Data Fig. 5
Extended Data Fig. 5. Functional characterization of PtCAL-3 in Nicotiana benthamiana and in vitro with isolated apoplast extract.
a) Transient expression of PtCAL−3 with the pathway to produce 9 (PtLDC, PtCAO, PtPIKS, PtSDR-2, PtACT-1, PtCYP782C1, PtCAL-1a and PtCAL-2a). Shown are LC–MS extracted ion chromatograms (EICs) for the 5 diastereomer (m/z 144.1383) intermediates that remain in this biosynthetic system. b) Chiral LC–MS analysis of N-acetylated products from a transient expression system that generates 4 (NAc-4 = m/z 184.1332) with or without co-expression of PtCAL-3. c) Effect on the ratio of (S)-4 to (R)-4 when PtCAL-3 is included with PtLDC, PtCAO and PtPIKS in N. benthamiana. n = 3 infiltrated leaves for each condition. d) Effect of PtCAL-3 on the total accumulation of 4 in N. benthamiana. For both panels c and d, each bar graph shows the mean +/− standard deviation. n = 3 infiltrated leaves for reach condition. The statistical comparison was made using a two-tailed Welch’s t-test assuming unequal variance. e) Effect of including PtCAL-3 on the ratio of 9 diastereomers (m/z 164.1434), as observed via LC–MS. f) Quantification of the ratio of 9 diastereomers when PtCAL-3 is absent or co-expressed with the rest of the pathway for 9 biosynthesis. Bar graphs show the mean +/− standard deviation, with the mean shown above each bar. n = 3 infiltrated leaves for each condition. The statistical comparison was made using a two-tailed Welch’s t-test assuming unequal variance. g) Biosynthetic proposal for the function of PtCAL-3 based upon its effect on pathway reconstitution in N. benthamiana. The specific production of (S)-3 by PtCAL-3 explains the enrichment of (S,S)-5 shown in panel a, the enrichment of (S)−4 shown in panels b and c, as well as the increase in the major 9 diastereomer (9-A) shown in panels e and f. We propose that the minor 9 diastereomer (9-B) is formed via the low incorporation of (R)-3 as a cosubstrate with 8. spon., spontaneous. h) In vitro assay with PtCAL-3-enriched apoplast and purified PtPIKS. Shown here are chiral LC–MS EICs for N-acetylated 4 enantiomers (m/z 184.1332). Apoplast from plants expressing GFP was used as a negative control. Reactions contained an enzymatic mixture for the production of 2, 3 and 4 (purified PtPIKS-1 +malonyl-CoA, +1), as defined in Extended Data Fig 4a. Note the enrichment of (S)−4 over time in the reactions that contain PtCAL-3. i) LC–MS analysis (HILIC) of in vitro PtCAL-3 apoplast reactions where 1 and 2 are used as substrates. Shown are EICs for 3 (m/z 186.1125) over time. Biosynthetic 3 (shown as a positive control) was generated via transient expression of PtLDC, PtCAO and PtPIKS in N. benthamiana, as usual. j) In vitro assay with PtCAL-3 apoplast where either racemic 4 or 1 and 2 (which can spontaneously condense to produce 3 and subsequently, 4) are included as substrates. Shown here are chiral LC–MS EICs for N-acetylated 4 enantiomers (m/z 184.1332). The ratio of enantiomers is listed next to the peaks for each reaction. k) Assessment of PtCAL-3 apoplast activity at different pH conditions. This was measured by determining the ratio of (S)-4 to (R)-4 (N-acetylated derivatives) via chiral LC–MS at the end point of each reaction. l) Two possible mechanisms for the PtCAL-3-catalysed condensation of 1 and 2 to produce (S)-3. m) Analysis to determine if PtCAL-3 accelerates decarboxylation of 2. Shown are the ion abundance ratios of 2 ([M+Na]+ = m/z 169.0107) to acetoacetic acid ([M+Na]+ = m/z 125.0209) over four hours when 2 is included as a substrate alone with either GFP or PtCAL-3. n = 3 individual reactions for each condition. n.s. = not significant, P > 0.05. n) Effect of a zinc (Zn) chelator (2,6-pyridinedicarboxylic acid, PDCA) and zinc supplementation on the enzyme activity of PtCAL-3, as measured by 3 ion abundance. n = 3 individual reactions for each condition. Boiled PtCAL-3 was included as a negative control since spontaneous formation of 3 can occur when 1 and 2 are co-incubated. For all statistical analyses in this figure, a two-tailed Welch’s t-test assuming unequal variance was used. All bar graphs in this figure show the mean +/− standard deviation. Source Data
Extended Data Fig. 6
Extended Data Fig. 6. Structural modelling of CAL proteins.
a) Structures of PtCAL-1a, PtCAL-2a and PtCAL-3 were modelled using AlphaFold2 via ColabFold (v1.5.2). The predicted N-terminal signal peptide for each CAL protein was removed prior to structural prediction. Shown here are the highest-ranked models for each structure, which are coloured according to the predicted local distance difference test (pLDDT) confidence score for each residue. Note that the top left, disordered region of each protein corresponds to the N-terminal sequence immediately downstream from the predicted signal peptide. b) Comparison of overall structure and active site architecture of modelled P. tetrastichus CALs compared to human carbonic anhydrase 2 (CA2, PDB structure 2VVA). For clarity, the disordered N-terminal regions were removed from the CAL proteins in this panel. Residues are numbered based upon the full-length version of each protein.
Extended Data Fig. 7
Extended Data Fig. 7. Functional characterization of Pt2OGD-4.
a) Transient expression of Pt2OGD-4 in N. benthamiana with co-infiltration of 10 as substrate. Shown are LC–MS extracted ion chromatograms (EICs) for the 10 substrate ([M + H]+ = m/z 289.2274, left panel) and a product (*) of Pt2OGD-4 that corresponds to the addition of a carbonyl ([M + H]+ = m/z 303.2067, right panel). b) MS2 spectra of the new compound (m/z 303.2067, 20 V) in comparison to that of 18 (m/z 261.1961). Note the similarity in major ion fragments, which suggests that the new compound (proposed as 11) bears structural similarity to 18. c) Minor products (peaks A and B) pertaining to the addition of a hydroxyl ([M + H]+ = m/z 305.2224) are also generated by Pt2OGD-4 activity. d) MS2 spectra (m/z 305.2224, 20 V) for compounds “A” and “B” generated by Pt2OGD-4. e) Putative structures of the ion fragments shown in bold in panel d. f) Biosynthetic proposal for the conversion of 10 into 11 by Pt2OGD-4. Note that the right panel shows the same chemistry as the left panel, but in a different 3D orientation.
Extended Data Fig. 8
Extended Data Fig. 8. Functional characterization of Pt2OGD-5.
a) Transient expression of Pt2OGD-5 with Pt2OGD-4 in N. benthamiana with co-infiltration of 10 as substrate. Shown are LC–MS extracted ion chromatograms (EICs) for the product of Pt2OGD-4 (11, m/z 303.2067, left panel) and a product (A) of Pt2OGD-5 that corresponds to a desaturation ([M + H]+ = m/z 301.1911, right panel). b) MS2 spectra of the new compound “A” (m/z 301.1911, 20 V) in comparison to that of 14 (m/z 259.1805). Note the similarity in major ion fragments, which suggests that the new compound (proposed as 13) bears structural similarity to 14. c) Transient expression of Pt2OGD-5 alone in N. benthamiana with co-infiltration of 10 as substrate. Shown are LC–MS extracted ion chromatograms (EICs) for 10 as substrate (m/z 289.2274, left panel) and a product (B) of Pt2OGD-5 that corresponds to a desaturation ([M + H]+ = m/z 287.2118, right panel). d) MS2 spectra of the new compound “B” (m/z 287.2118, 20 V) in comparison to that of 10 (m/z 289.2274). Note that the major ion fragments in “B” are typically 2 m/z units less than those of 10, which supports that the new compound (proposed as 12) bears the same scaffold as 10, but with a desaturation. e) Comparison of 10 consumption by Pt2OGD-4 vs. Pt2OGD-5. Each of the bar graphs represents an independent experiment. Pairwise comparisons between Pt2OGD-4 and Pt2OGD-5 reactions were assessed using a two-tailed Welch’s t-test, assuming unequal variance. n = 3 infiltrated leaves for each condition. Each bar graph shows the mean +/− standard deviation. f) Biosynthetic proposal for the activity of Pt2OGD-5. While Pt2OGD-5 can desaturate 10 to produce 12 (putative), Pt2OGD-4 appears to have higher activity on 10, suggesting that Pt2OGD-4 activity prior to Pt2OGD-5 activity is the major metabolic route for producing 13 (putative). Source Data
Extended Data Fig. 9
Extended Data Fig. 9. Functional characterization of PtABH-1.
a) Transient expression of PtABH-1 with Pt2OGD-5 and Pt2OGD−4 in N. benthamiana with co-infiltration of 10 as substrate. Shown are LC–MS extracted ion chromatograms (EICs) for the product of Pt2OGD−4 and Pt2OGD-5 (13, m/z 301.1911, left panel) and a product (A) of PtABH-1 that corresponds to a loss of an acetyl group ([M + H]+ = m/z 259.1805, right panel), which is confirmed to be 14 via comparison to an authentic standard. b) MS2 spectra of the new compound “A” (m/z 259.1805, 20 V) in comparison to that of 14 (m/z 259.1805, 20 V). c) Transient expression of PtABH-1 with Pt2OGD-4 (Pt2OGD-5 omitted) in N. benthamiana with co-infiltration of 10 as substrate. Shown are LC–MS EICs for the product of Pt2OGD-4 (11, m/z 303.2067, left panel) and a new product (B) of PtABH-1 that corresponds to the loss of an acetyl group, ([M + H]+ = m/z 261.1961, right panel), which is confirmed to be 18 via comparison to an authentic standard. d) MS2 spectra of the new compound “B” (m/z 261.1961, 20 V) in comparison to that of 18 (m/z 261.1961, 20V). e) Biosynthetic proposal for the activity of PtABH-1, which can deacetylate either 11 or 13 to produce 18 or 14, respectively. Critically, the ability to access confirmed standards biosynthetically verifies the proposed location of the carbonyl installed by Pt2OGD-4 and the double bond installed by Pt2OGD-5.
Extended Data Fig. 10
Extended Data Fig. 10. Step-by-step biosynthesis of downstream Lycopodium alkaloids.
a) Generation of HupA (17). b) Generation of 8,15-dihydro congeners. c) Generation of 2,3-dihydro congeners. d) Generation of 2,3,8,15-tetrahydro congeners. For all panels, filled in boxes to the left indicate presence of biosynthetic genes in our N. benthamiana transient expression system. Flabellidine (10) was co-infiltrated as a substrate in all experiments. Shown below each compound is the mean ion abundance for the indicated mass ions (m/z) for each compound. In all panels, n = 6 infiltrated leaves for each experimental condition. Error bars represent +/− standard deviation. New enzymes, or new reactions for previously described enzymes, are coloured purple. Lycopodium alkaloids with common names have been verified with authentic standards. All other structures are proposed based upon MS2, biosynthetic logic and/or insight gained from downstream products or known enzyme activities. Additional details can be found in Extended Data Figs. 7–9, Supplemental Results and Supplementary Figs. 4 and 5. Source Data

Comment in

References

    1. Wink, M. in Modern Alkaloids: Structure, Isolation, Synthesis and Biology (eds Fattorusso, E. & Taglialatela‐Scafati, O.) 1–24 (Wiley, 2007).
    1. Lichman BR. The scaffold-forming steps of plant alkaloid biosynthesis. Nat. Prod. Rep. 2021;38:103–129. doi: 10.1039/D0NP00031K. - DOI - PubMed
    1. Anarat-Cappillino G, Sattely ES. The chemical logic of plant natural product biosynthesis. Curr. Opin. Plant Biol. 2014;19:51–58. doi: 10.1016/j.pbi.2014.03.007. - DOI - PMC - PubMed
    1. Ma X, Gang DR. The Lycopodium alkaloids. Nat. Prod. Rep. 2004;21:752–772. doi: 10.1039/b409720n. - DOI - PubMed
    1. Liu J-S, et al. The structures of huperzine A and B, two new alkaloids exhibiting marked anticholinesterase activity. Can. J. Chem. 1986;64:837–839. doi: 10.1139/v86-137. - DOI

Publication types

MeSH terms