. 2023 Nov;623(7988):803-813.
doi: 10.1038/s41586-023-06717-x. Epub 2023 Nov 8.

Autoantibodies against type I IFNs in humans with alternative NF-κB pathway deficiency

Tom Le Voyer  1   2 Audrey V Parent #  3 Xian Liu #  3 Axel Cederholm #  4 Adrian Gervais  5   6 Jérémie Rosain  5   6   7 Tina Nguyen  8   9 Malena Perez Lorenzo  5   6 Elze Rackaityte  10 Darawan Rinchai  11 Peng Zhang  11 Lucy Bizien  5   6 Gonca Hancioglu  12 Pascale Ghillani-Dalbin  13 Jean-Luc Charuel  13 Quentin Philippot  5   6 Mame Sokhna Gueye  5   6 Majistor Raj Luxman Maglorius Renkilaraj  5   6 Masato Ogishi  11 Camille Soudée  5   6 Mélanie Migaud  5   6 Flore Rozenberg  14 Mana Momenilandi  5   6 Quentin Riller  15 Luisa Imberti  16 Ottavia M Delmonte  17 Gabriele Müller  18   19 Baerbel Keller  19   20 Julio Orrego  21 William Alexander Franco Gallego  21 Tamar Rubin  22 Melike Emiroglu  23 Nima Parvaneh  24 Daniel Eriksson  25   26   27 Maribel Aranda-Guillen  27 David I Berrios  3 Linda Vong  28   29 Constance H Katelaris  30 Peter Mustillo  31 Johannes Raedler  32 Jonathan Bohlen  5   6 Jale Bengi Celik  33 Camila Astudillo  34   35 Sarah Winter  36 NF-κB ConsortiumCOVID Human Genetic EffortCatriona McLean  37 Aurélien Guffroy  38 Joseph L DeRisi  10   39 David Yu  3 Corey Miller  3 Yi Feng  11 Audrey Guichard  40 Vivien Béziat  5   6   11 Jacinta Bustamante  5   6   7   11 Qiang Pan-Hammarström  41   42 Yu Zhang  17   43 Lindsey B Rosen  17 Steve M Holland  17 Marita Bosticardo  17 Heather Kenney  17 Riccardo Castagnoli  44   45 Charlotte A Slade  46   47   48 Kaan Boztuğ  49   50   51   52 Nizar Mahlaoui  53   54 Sylvain Latour  36 Roshini S Abraham  55 Vassilios Lougaris  56 Fabian Hauck  32 Anna Sediva  57 Faranaz Atschekzei  58 Georgios Sogkas  58 M Cecilia Poli  34   35 Mary A Slatter  59 Boaz Palterer  60 Michael D Keller  61 Alberto Pinzon-Charry  62   63 Anna Sullivan  62   63 Luke Droney  62   63 Daniel Suan  62   64 Melanie Wong  62   64   65 Alisa Kane  9   62   66   67 Hannah Hu  62   66   67 Cindy Ma  8   9   62 Hana Grombiříková  68 Peter Ciznar  69 Ilan Dalal  70 Nathalie Aladjidi  71 Miguel Hie  72 Estibaliz Lazaro  73 Jose Franco  21 Sevgi Keles  74 Marion Malphettes  75 Marlene Pasquet  76 Maria Elena Maccari  18   77 Andrea Meinhardt  78 Aydan Ikinciogullari  79 Mohammad Shahrooei  80   81 Fatih Celmeli  82 Patrick Frosk  83 Christopher C Goodnow  8   9   62 Paul E Gray  62   84 Alexandre Belot  85   86   87 Hye Sun Kuehn  88 Sergio D Rosenzweig  88 Makoto Miyara  13   89 Francesco Licciardi  90 Amélie Servettaz  91   92 Vincent Barlogis  93 Guillaume Le Guenno  94 Vera-Maria Herrmann  95 Taco Kuijpers  96 Grégoire Ducoux  97 Françoise Sarrot-Reynauld  98 Catharina Schuetz  99 Charlotte Cunningham-Rundles  100 Frédéric Rieux-Laucat  15 Stuart G Tangye  8   9   62 Cristina Sobacchi  101   102 Rainer Doffinger  103 Klaus Warnatz  19   20 Bodo Grimbacher  18   19 Claire Fieschi  75   104 Laureline Berteloot  105 Vanessa L Bryant  46   47   48 Sophie Trouillet Assant  40   106 Helen Su  17   43 Benedicte Neven  54 Laurent Abel  5   6   11 Qian Zhang  5   6   11 Bertrand Boisson  5   6   11 Aurélie Cobat  5   6   11 Emmanuelle Jouanguy  5   6   11 Olle Kampe  107 Paul Bastard  5   6   11   54 Chaim M Roifman  28   29 Nils Landegren  4   27 Luigi D Notarangelo  17 Mark S Anderson  3   108 Jean-Laurent Casanova  109   110   111   112   113 Anne Puel  114   115   116
Collaborators, Affiliations

Autoantibodies against type I IFNs in humans with alternative NF-κB pathway deficiency

Tom Le Voyer et al. Nature. 2023 Nov.

Abstract

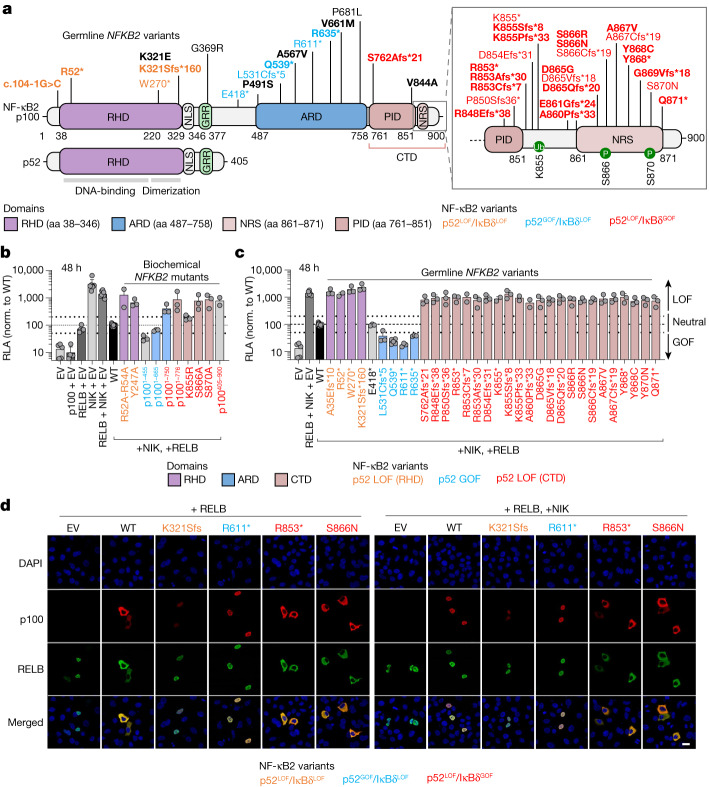
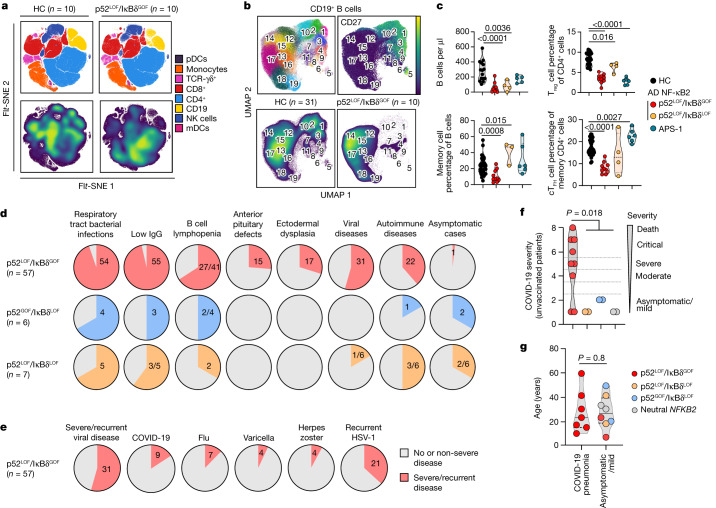
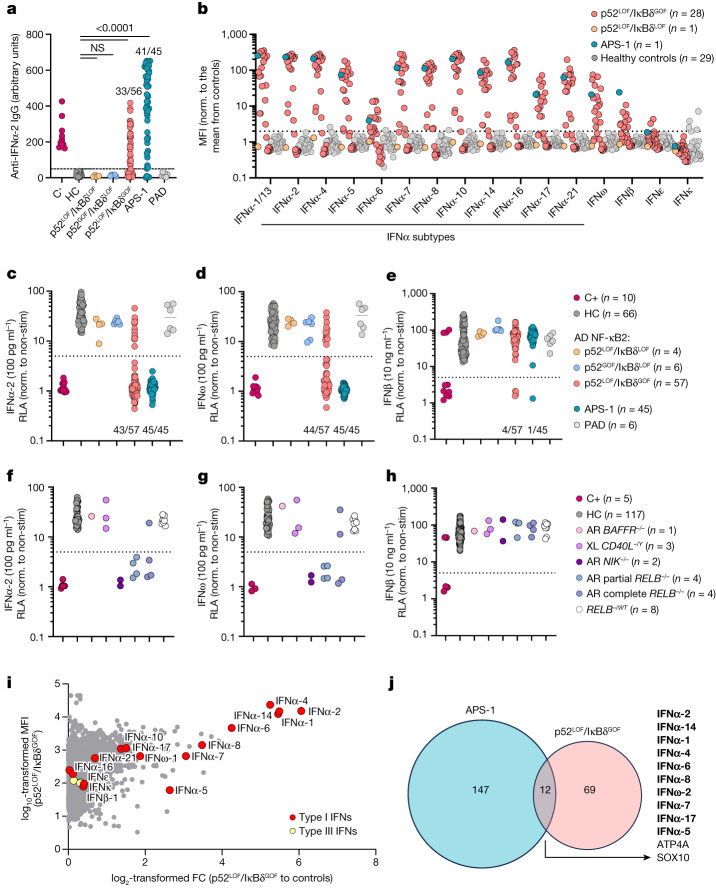
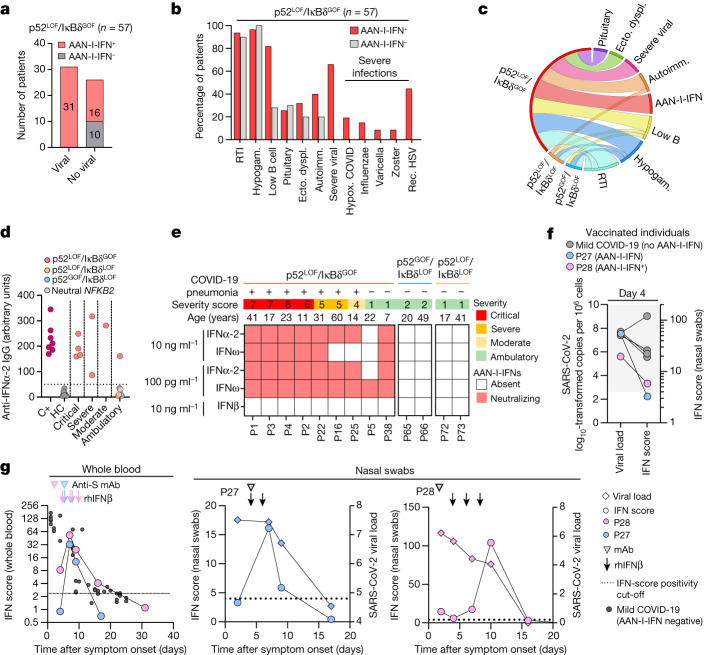
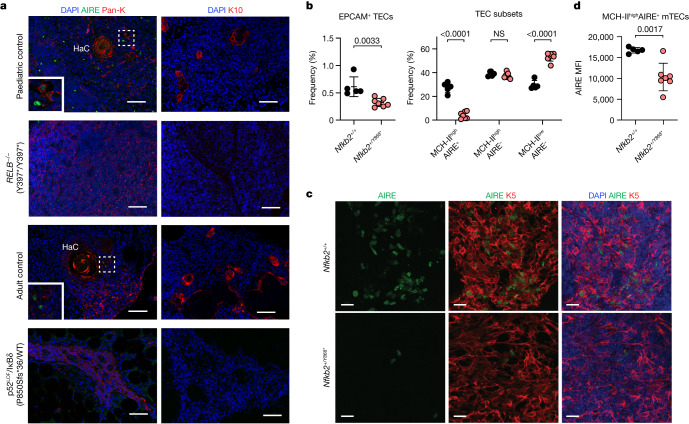
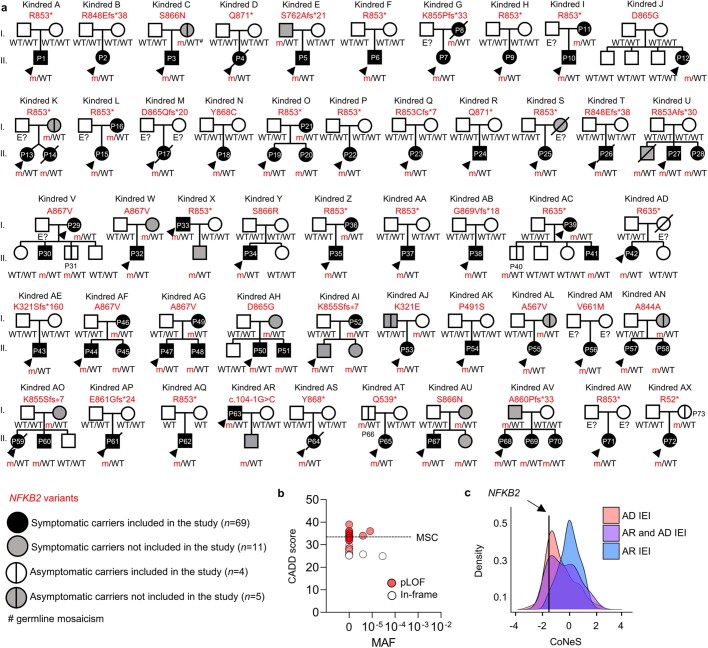
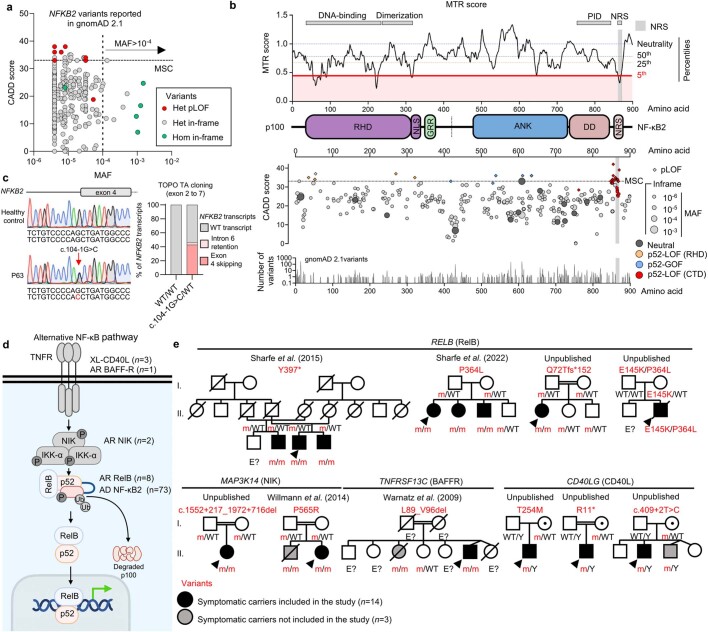
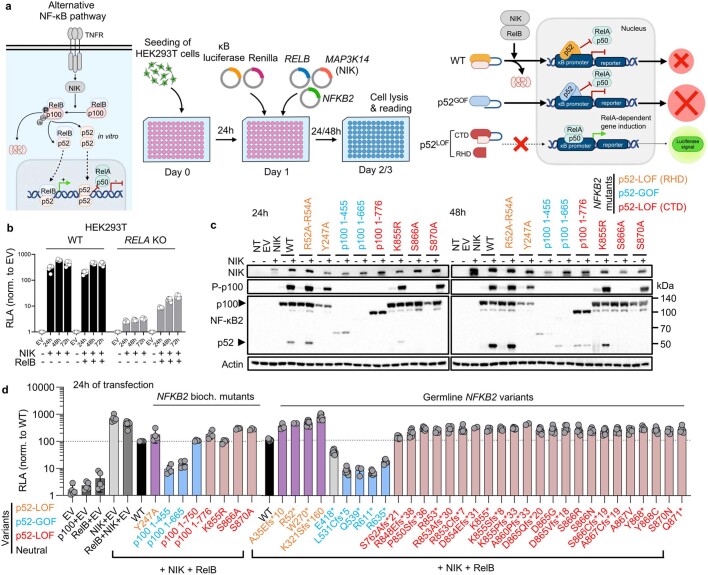
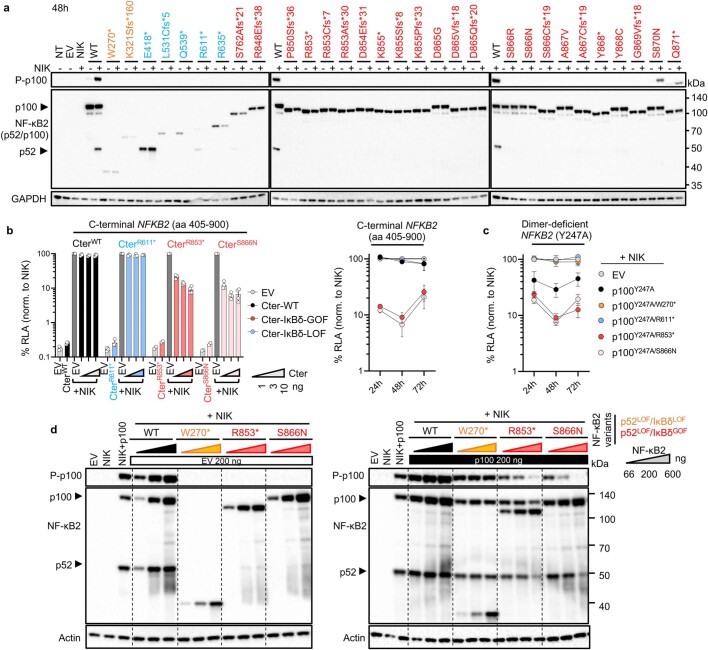
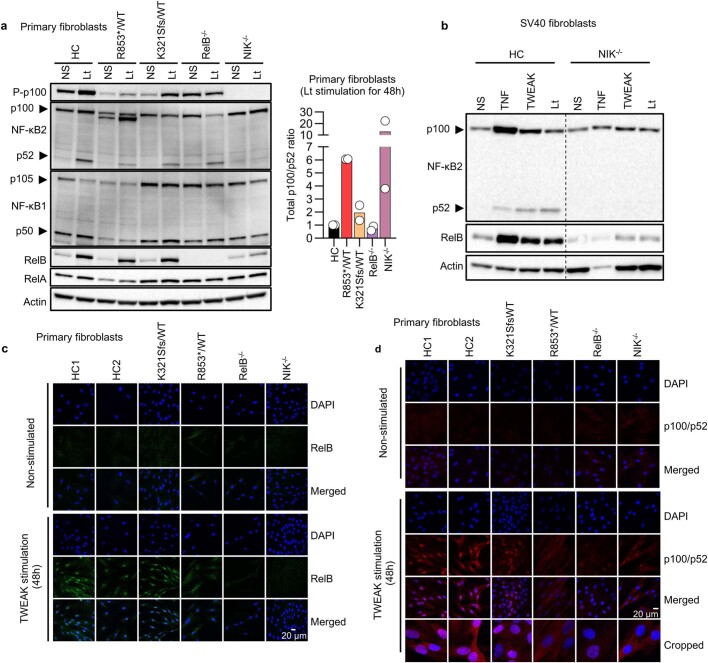
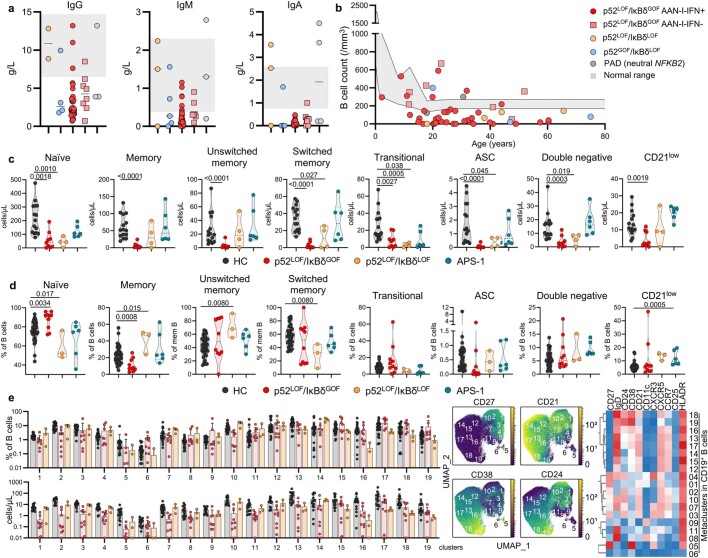
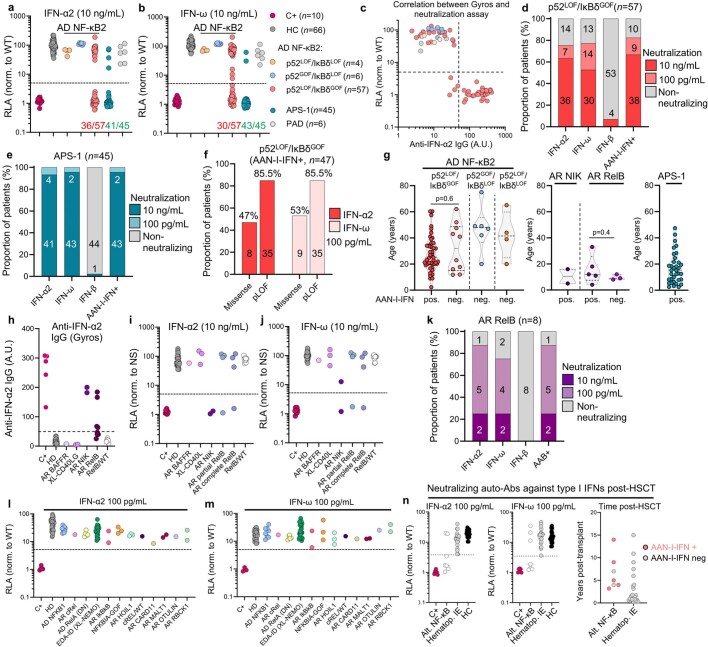
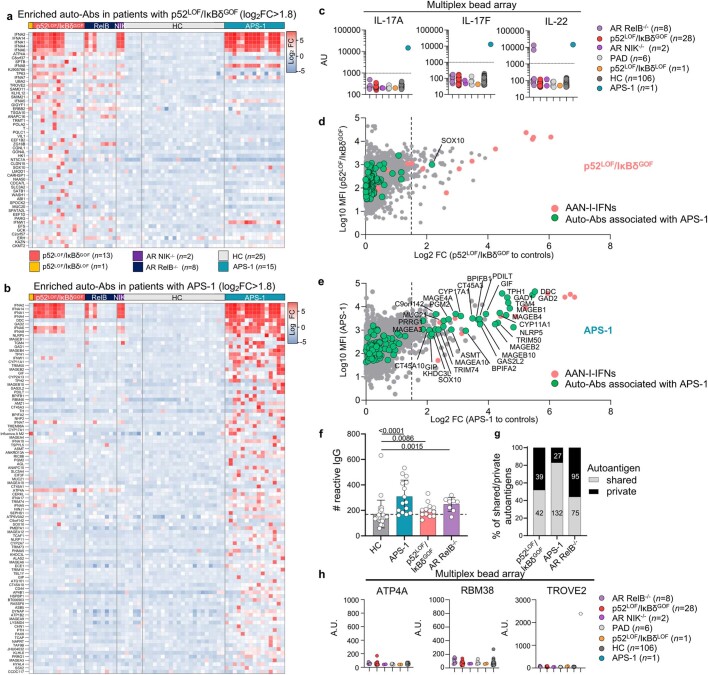
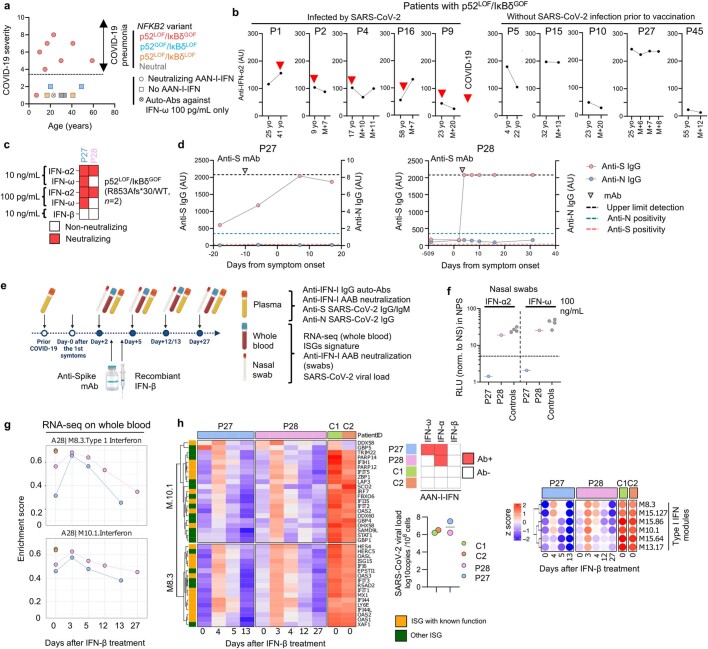
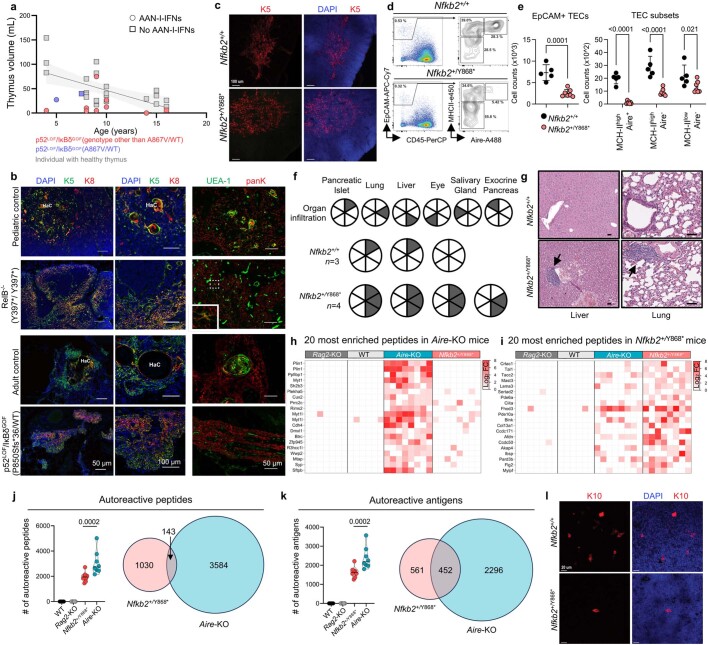
Patients with autoimmune polyendocrinopathy syndrome type 1 (APS-1) caused by autosomal recessive AIRE deficiency produce autoantibodies that neutralize type I interferons (IFNs)1,2, conferring a predisposition to life-threatening COVID-19 pneumonia3. Here we report that patients with autosomal recessive NIK or RELB deficiency, or a specific type of autosomal-dominant NF-κB2 deficiency, also have neutralizing autoantibodies against type I IFNs and are at higher risk of getting life-threatening COVID-19 pneumonia. In patients with autosomal-dominant NF-κB2 deficiency, these autoantibodies are found only in individuals who are heterozygous for variants associated with both transcription (p52 activity) loss of function (LOF) due to impaired p100 processing to generate p52, and regulatory (IκBδ activity) gain of function (GOF) due to the accumulation of unprocessed p100, therefore increasing the inhibitory activity of IκBδ (hereafter, p52LOF/IκBδGOF). By contrast, neutralizing autoantibodies against type I IFNs are not found in individuals who are heterozygous for NFKB2 variants causing haploinsufficiency of p100 and p52 (hereafter, p52LOF/IκBδLOF) or gain-of-function of p52 (hereafter, p52GOF/IκBδLOF). In contrast to patients with APS-1, patients with disorders of NIK, RELB or NF-κB2 have very few tissue-specific autoantibodies. However, their thymuses have an abnormal structure, with few AIRE-expressing medullary thymic epithelial cells. Human inborn errors of the alternative NF-κB pathway impair the development of AIRE-expressing medullary thymic epithelial cells, thereby underlying the production of autoantibodies against type I IFNs and predisposition to viral diseases.


Conflict of interest statement

A. Guichard is an employee of Biomerieux. J.-L. Casanova is listed as an inventor on patent application PCT/US2021/042741, filed on the 22 July 2021 and submitted by The Rockefeller University, that covers the diagnosis of susceptibility to, and treatment of, viral disease and viral vaccines, including COVID-19 and vaccine-associated diseases. The other authors declare no competing interests.

Figures

Fig. 1
Fig. 1. Functional testing of the NFKB2 alleles by overexpression.
a, Schematic of the NF-κB2 protein (p100 and p52) with the variants, identified in heterozygous patients, that were included in this study (n = 28 variants, shown in bold) or not included here but reported elsewhere (n = 13 variants). The C-terminal domain (CTD) spans amino acids (aa) 760–900. The REL-homology domain (RHD; purple), the ankyrin repeat domain (ARD; blue) and the CTD, including the processing-inhibitory domain (PID) and the NIK-responsive sequence (NRS) (brown), are shown. The NFKB2 variants that are LOF for p52/p52 repression of κB transcriptional activity (p52 activity) and LOF for IκBδ regulatory activity (p52LOF/IκBδLOF) are shown in orange. The variants that are GOF for p52 activity and LOF for IκBδ activity are shown in blue (p52GOF/IκBδLOF). The variants in the CTD that are both LOF for the p52 activity and GOF for the IκBδ regulatory activity (p52LOF/IκBδGOF) are shown in red. Neutral NFKB2 variants are shown in black. b, The relative luciferase activity (RLA) of HEK293T cells transfected with a κB reporter luciferase construct (κB-luc) in the presence or absence of plasmids encoding NIK, RELB and/or p100/NF-κB2 WT or biochemical p100/NF-κB2 mutants reported in previous studies, normalized (norm.) to WT p100/NF-κB2, after 48 h of transfection. Data are mean ± s.d. from three independent experiments. EV, empty vector. c, The RLA of HEK293T cells transfected with a κB-luc vector, in the presence of plasmids encoding NIK, RELB and p100/NF-κB2 WT or the NFKB2 variants included in this study or reported in previous studies, at 48 h after transfection. Data are mean ± s.d. from three independent experiments. d, Subcellular localization of the WT or the NF-κB2 variants used for cotransfection with RELB without (left) or with (right) NIK, as determined by confocal microscopy analysis of HeLa cells. The nuclei were stained with DAPI; p100 and RELB were detected using antibodies recognizing their N-terminal domains. Data shown are representative of two independent experiments. Scale bar, 20 μm.
Fig. 2
Fig. 2. Distinctive immunological and clinical phenotype of patients with p52LOF/IκBδGOF heterozygous variants.
a, FFT-accelerated interpolation-based (FI) t-distributed stochastic neighbour embedding (t-SNE) analysis of concatenated whole-blood samples from ten patients with p52LOF/IκBδGOF variants, and ten age-matched healthy control individuals (HC), based on cytometry by time of flight (CyTOF) data. t-SNE analysis is not shown for the patients with p52LOF/IκBδLOF variants (n = 4) or APS-1 (n = 6) owing to their lower number. NK, natural killer cells; mDCs and pDCs, myeloid and plasmacytoid dendritic cells, respectively. b, Uniform manifold approximation and projection (UMAP)-based unsupervised clustering analysis of CD19+ B cells from a concatenated group of 10 patients with p52LOF/IκBδGOF variants and 31 age-matched controls (HC), with a heat map showing the mean levels of the surface markers included in the clustering defining 19 distinct metaclusters, CD27 marker expression and the metacluster distribution in healthy control individuals and patients with p52LOF/IκBδGOF variants. c, The number of B cells and the proportions of memory B cells, Treg cells and circulating TFH (cTFH) cells in patients with a p52LOF/IκBδGOF variant (n = 10, red dots, except for the B cell numbers, showing only patients above 6 years of age, n = 9), age-matched controls (n = 27, black dots), patients with a p52LOF/IκBδLOF variant (= 4, orange dots) and patients with APS-1 (n = 6, green dots). Statistical comparisons were performed using two-tailed Mann–Whitney U-tests. AD, autosomal dominant. d, The proportion and number of patients with p52LOF/IκBδGOF (n = 57), p52GOF/IκBδLOF (n = 6) or p52LOF/IκBδLOF (n = 7, including 4 reported here and 3 previously reported) NF-κB2 variants with their corresponding clinical manifestations. e, The proportion and number of patients with severe/recurrent (red shape) or no/non-severe (grey shape) viral diseases among the 57 patients with p52LOF/IκBδGOF NF-κB2 variants. f, COVID-19 severity scale for unvaccinated patients with a p52LOF/IκBδGOF (red dots, n = 9), p52LOF/IκBδLOF (orange dots, n = 2), p52GOF/IκBδLOF (blue dots, n = 2) or neutral (grey dots, n = 2) NF-κB2 variant. Statistical comparisons were performed using two-tailed Mann–Whitney U-tests. g, Age at the COVID-19 episode in unvaccinated patients with a p52LOF/IκBδGOF (red dots, n = 9), p52LOF/IκBδLOF (orange dots, n = 2), p52GOF/IκBδLOF (blue dots, n = 2) or neutral (grey dots, n = 2) NF-κB2 variant, as a function of COVID-19 severity. Statistical comparisons were performed using two-tailed Mann–Whitney U-tests.
Fig. 3
Fig. 3. AAN-I-IFNs detected in patients heterozygous for p52LOF/IκBδGOF variants and patients with inborn errors of RELB or NIK.
a, Detection of IgG autoantibodies against IFNα-2 by Gyros in patients with inborn errors of NF-κB2 with a p52LOF/IκBδLOF (n = 4), p52GOF/IκBδLOF (n = 6) or p52LOF/IκBδGOF (n = 56) variant, patients with APS-1 (n = 45), patients with idiopathic PAD (n = 6), positive control individuals with AAN-I-IFNs (C+, n = 10) or healthy control individuals (HC, n = 25). Data are the mean values from at least three independent experiments. Statistical comparisons were performed using two-tailed Mann–Whitney U-tests. NS, not significant. b, Detection, using a multiplex bead assay, of autoantibodies against the 16 type I IFNs in patients with p52LOF/IκBδGOF (n = 28) or p52LOF/IκBδLOF (n = 1) variants or with APS-1 (n = 1). Values are normalized to the mean fluorescence intensity (MFI) of plasma samples from healthy control individuals (n = 29) for each indicated cytokine. ce, Luciferase-based neutralization assay to detect autoantibodies neutralizing 100 pg ml−1 IFNα-2 (c), IFNω (d) or 10 ng ml−1 IFNβ (e) in positive-control individuals (n = 10), healthy control individuals (n = 66), patients with a p52GOF/IκBδLOF (n = 6), p52LOF/IκBδLOF (n = 4) or p52LOF/IκBδGOF (n = 57) variant, patients with idiopathic PAD (n = 6) and patients with APS-1 (n = 45). Non-stim., non-stimulated. fh, Luciferase-based neutralization assay to detect autoantibodies neutralizing 100 pg ml−1 IFNα-2 (f) or IFNω (g) or 10 ng ml−1 IFNβ (h) in patients with autosomal-recessive BAFFR (n = 1), X-linked (XL) CD40L deficiency (n = 3), autosomal-recessive NIK deficiency (n = 2), autosomal-recessive RELB partial or complete deficiency (n = 8) in healthy relatives heterozygous for a null or hypomorphic RELB allele (n = 8), positive control individuals (n = 5) or healthy control individuals (n = 117). All neutralization assay data are presented as the mean of at least two independent experiments. i, Protein microarray showing the distribution of autoantibody reactivity in plasma samples from patients carrying a p52LOF/IκBδGOF variant (n = 13). Data are represented as the fold change (FC) relative to 26 plasma samples from healthy control individuals. Data for HuProt are presented as the mean of at least two technical replicates. j, Representation of the global autoantigen profile of patients with APS-1 and patients with a p52LOF/IκBδGOF variant, with their overlap. Type I IFN autoantigens are highlighted in bold.
Fig. 4
Fig. 4. Susceptibility to COVID-19 pneumonia and other severe viral diseases is strongly associated with the presence of AAN-I-IFNs.
a, The number of patients with a p52LOF/IκBδGOF variant and manifestations of viral diseases as a function of their AAN-I-IFN status. b, Clinical and immunological manifestations in patients with a p52LOF/IκBδGOF variant, as a function of their AAN-I-IFN status. Autoimm., autoimmunity; ecto. dyspl., ectodermal dysplasia; hypogam., hypogammaglobulinaemia; hypox., hypoxaemic; rec., recurrent; RTI, recurrent bacterial respiratory tract infection. c, Chord diagram of the main clinical and immunological manifestations of patients with inborn errors of NF-κB2. d, Anti-IFNα-2 IgG detection by Gyros in positive control individuals (n = 10), healthy control individuals (n = 7), patients with a p52LOF/IκBδGOF (n = 9), p52LOF/IκBδLOF (n = 2), p52GOF/IκBδLOF (n = 2) or neutral (n = 2) NF-κB2 variant and COVID-19, as a function of disease severity. e, Heat map showing the type I IFN neutralization profile of unvaccinated patients during COVID-19, according to disease severity and clinical presentation during infection, including patients with a p52LOF/IκBδGOF (n = 9), p52GOF/IκBδLOF (n = 2) or p52LOF/IκBδLOF (n = 2) variant. The red squares indicate a complete neutralization ability of the plasma for ISRE induction in the luciferase reporter assay system, and the white squares indicate a total absence of neutralizing autoantibody detection in the ISRE–luciferase assay. f, The viral load and IFN score in nasal swabs over the course of SARS-CoV-2 infection in patients with a p52LOF/IκBδGOF variant (n = 2) with AAN-I-IFNs, and in vaccinated individuals with a mild disease and no AAN-I-IFNs (n = 4). g, The IFN score and viral load in whole blood (left) or nasal swabs (right) over the course of SARS-CoV2 infection in patients with a p52LOF/IκBδGOF variant with AAN-I-IFNs (n = 2), or in individuals infected with SARS-CoV-2 presenting only mild disease (n = 36). The vertical arrows indicate the times of recombinant human IFNβ (rhIFNβ) injection and the arrowheads indicate the infusion of monoclonal antibodies (mAbs) against SARS-CoV-2 spike protein.
Fig. 5
Fig. 5. Impaired mTEC development and thymic AIRE expression in a patient with autosomal-recessive RELB deficiency, a patient heterozygous for a p52LOF/IκBδGOF NF-κB2 variant and in mice heterozygous for the Y868* NF-κB2 variant.
a, Immunofluorescence staining of thymic tissue from age-matched controls, a patient with autosomal-recessive complete RELB deficiency or heterozygous for a p52LOF/IκBδGOF NF-κB2 variant. AIRE-expressing cells (green) and Hassall’s corpuscles (HaC) are shown on the left. Pan-K, pan-keratin. Staining for K10 (red), defining terminally differentiated corneocyte-like mTECs, is shown on the right. DAPI staining is shown in blue. Scale bars, 50 μm (left) and 100 μm (right). Inset: the controls at a higher magnification. Data shown are representative of one independent experiment. b, The percentage of EPCAM+CD45 thymic epithelial cells (TECs), and the various TEC subsets (defined on the basis of their MHC class II (MHC-II) and AIRE expression) in WT controls (Nfkb2+/+, black dots, n = 5) and mice carrying a heterozygous missense variant homologous to the human Y868* p52LOF/IκBδGOF NF-κB2 variant (Nfkb2+/Y868*, red dots, n = 7). Statistical comparisons were performed using unpaired, parametric, two-tailed Student’s t-tests (EPCAM+ TECs) or two-way nonparametric analysis of variance (ANOVA) (Sidak’s test) with correction for multiple comparisons (TEC subsets). Data are mean ± s.d. Data shown are representative of three independent experiments. c, Representative confocal microscopy images of AIRE (green), K5 (red) and DAPI (blue) of WT (Nfkb2+/+, n = 3, top) and Nfkb2+/Y868* (n = 3, bottom) mouse thymuses. Scale bars, 20 μm. Data shown are representative of two independent experiments. d, Mean fluorescence intensity (MFI) of AIRE expression in mature MHC-IIhighAIRE+ mTECs from WT (n = 5) and Nfkb2+/Y868* (n = 7) mouse thymuses. Statistical comparisons were performed using unpaired, parametric two-tailed Student’s t-tests. Data are mean ± s.d. Data shown are representative of three independent experiments. Source Data
Extended Data Fig. 1
Extended Data Fig. 1. Pedigrees of the 73 patients studied carrying heterozygous NFKB2 variants.
(a) Pedigrees of the patients heterozygous for rare variants of NFKB2. Generations are indicated by Roman numerals (I–II), and each symptomatic carrier included in the study, represented by a black symbol, is indicated as P followed by an Arabic numeral (P1–P73). Grey symbols represent relatives who are symptomatic carriers but for whom no material was available for this study. A vertical bar, within a white or grey symbol, indicates an asymptomatic carrier included or not included (due to a lack of available material), respectively in the study; an arrow indicates the index case; a black diagonal line indicates that the individual is deceased. “E?” indicates individuals of unknown genotype. (b) CADD-MAF (combined annotation-dependent depletion-minor allele frequency) graph of the rare or private NFKB2 variants (n = 28) from the 73 patients recruited. The red and white dots represent pLOF and missense heterozygous NFKB2 variants, respectively. Each score was calculated with CADD version 1.6. The dashed line represents the mutation significance (MSC) cutoff threshold of 33 for NFKB2. (C) CoNeS score of the NFKB2 gene.
Extended Data Fig. 2
Extended Data Fig. 2. Population genetics and constraint metrics of the NFKB2 gene, and pedigrees of the patients with inborn errors of RelB, NIK, BAFFR and CD40L.
(a) CADD-MAF graph for the NFKB2 variants reported in the gnomAD v2.2.1. The red and grey dots represent monoallelic pLOF and heterozygous in-frame (missense and indel) variants, respectively. The green dots represent homozygous missense variants. The horizontal dashed line represents the mutation significance (MSC) cutoff threshold of 33 for NFKB2. (b) Genomic constrained coding regions across NFKB2, as estimated by the missense tolerance ratio (MTR) score evaluating region-specific intolerance to missense variants. A score <1.0 indicates a lower-than-expected ratio of missense to synonymous variants in the gnomAD v2.0 dataset for the 21 bp window surrounding an amino-acid residue. The horizontal-coloured dashed lines represent the percentiles for the most missense-depleted regions of NFKB2. The NIK-responsive sequence (NRS) is within the 5th percentile for the most missense-depleted regions for NFKB2. The lower graph shows the distribution of the heterozygous NFKB2 variants reported in gnomAD 2.1.1 and from the patients reported in this study, by location within the protein and CADD score. (c) Electropherograms showing the c.104-1 G > C/WT essential splice-site variant carried in the heterozygous state of P63 and a healthy donor (left) and the proportion of transcripts identified by sequencing 100 colonies from TOPO cloning with cDNA from PCR products corresponding to a region spanning exon 2 to 7 in P63 or a healthy donor. (d) Representation of the alternative NF-κB pathway and the patients included. (e) Pedigrees and variants of patients with inborn errors of RelB, NIK, BAFFR and CD40L. A dot within a white symbol indicates an asymptomatic carrier; an arrow indicates the index case; a black diagonal line indicates a deceased individual. “E?” indicates individuals of unknown genotype.
Extended Data Fig. 3
Extended Data Fig. 3. Functional testing of NFKB2 variants by overexpression.
(a) Schematic representation of the alternative NF-κB pathway and the function of the p52/RelB and p52/p52 heterodimers (left panel); a graphical overview of the luciferase assay for testing the p52 function of the NFKB2 variants (middle panel); and a schematic representation of the functional consequences of the WT, p52GOF and p52LOF variants in the luciferase assay (right panel). (b) Relative luciferase activity (RLA) of WT or RelA-deficient HEK293T cells transfected with a κB reporter construct (κB-luc) in the absence or presence of plasmids encoding NIK and/or RelB for 24, 48 or 72 h. Results are expressed as the RLA normalized against the value for the EV. Bars represent the mean values (± s.d.) from 3 independent experiments performed in technical duplicates. (c) Western blot of HEK293T cells transfected for 24 h (left panel) or 48 h (right panel) in the absence or presence of plasmids encoding NIK and the WT or previously reported biochemical NF- κB2/p100 mutants. Data representative of two independent experiment are shown. (d) Luciferase assay testing the NF-κB2/p100 biochemical mutants (left) or deleterious variants from patients (right), 24 h after transfection. Bars represent the mean values (± s.d.) from more than 3 independent experiments.
Extended Data Fig. 4
Extended Data Fig. 4. Assessments of NIK-dependent p100 processing and p100-IκBδ activity of the NFKB2 variants by overexpression.
(a) Western blot of HEK293T cells transfected for 48 h in the presence or absence of plasmids encoding NIK and WT or mutant NF-κB2, showing phosphorylated Y866-p100 (P-p100) levels, and p100 and p52 expression. Data representative of three independent experiments are shown. (b) Relative luciferase activity (RLA), indicating the p100/NF-κB2-dependent capacity to repress κB transcriptional activity for luciferase in HEK293T cells in the presence or absence of plasmids encoding NIK and various amounts of a plasmid encoding the C-terminal part of p100/NF-κB2 (Cter, aa 405-900) from WT or mutants, 48 h after transfection. The results are expressed as a percentage of the κB-luc RLA after transfection with NIK alone (left panel); the kinetic effect of transfection with NIK either alone or together with a plasmid encoding the various Cter constructs, as assessed by κB-luc transcriptional repression, from 24 to 72 h after transfection is shown in the right panel. Bars represent the mean values (± s.d.) from two independent experiments performed in duplicate. (c) Kinetic effect of transfection with NIK alone or together with a plasmid encoding the dimer-deficient Y247A single (p100Y247A) or double (p100/Y247A/W270*, p100Y247A/R611*, p100Y247A/S866N, or p100Y247A/R853*) mutants, in terms of κB transcriptional repression of luciferase activity from 24 to 72 h after transfection. Results are expressed as a percentage of the κB RLA after transfection with NIK alone. Bars represent the mean values (± s.d.) from two independent experiments performed in duplicate. (d) Western blot of HEK293T cells cotransfected with a plasmid encoding NIK, together with various amounts of a plasmid encoding the WT or mutant NF-κB2 variants, together with a constant amount of empty vector (left panel) or of WT NFKB2 (right panel), showing phosphorylated p100 (P-p100), p100 and p52 expression. Data representative of three independent experiments are shown.
Extended Data Fig. 5
Extended Data Fig. 5. The processing-resistant NFKB2 mutants have enhanced p100-IκBδ activity in heterozygous patients’ cells.
(a) Western blot of P-p100, NF-κB2 (p100/p52), NF-κB1 (p105/p50), RelB, and RelA in primary fibroblasts from one healthy donor (HC), a patient with the p52LOF/IκBδGOF R853*/WT variant, a patient with the p52LOF/IκBδLOF K321Sfs/WT variant, a patient with AR complete (Q72Tfs*152/Q72Tfs*152) RelB (RelB−/−) or (P565R/P565R) NIK (NIK−/−) deficiency, with or without stimulation with LT-α1β2 (Lt) for 48 h (left panel), and a graph depicting total p100/p52 intensity ratio after Lt stimulation (right panel). Bars represent the mean values (± s.d.) from two independent experiments. (b) Western blot showing p100 processing into p52 and RelB induction in total cell extracts of SV40 fibroblasts from a healthy donor (HC) or a patient with AR complete NIK deficiency (NIK−/−) either left non stimulated (NS) or after stimulation for 48 h with TNF, TWEAK, Lt. Data representative of three independent experiments are shown. (c) Confocal microscopy showing the subcellular distribution of RelB in primary fibroblasts from two healthy controls (HC1, HC2), patients with a p52LOF/IκBδLOF K321Sfs/WT or a p52LOF/IκBδGOF R853*/WT NF-κB2/p100 variant, and patients with AR complete RelB (RelB−/−) or NIK (NIK−/−) deficiency, without and with stimulation with TWEAK for 48 h. Data representative of three independent experiments are shown. (d) Confocal microscopy showing the subcellular distribution of p100/p52 in primary fibroblasts from two healthy controls (HC1, HC2), patients with a p52LOF/IκBδLOF K321Sfs*/WT or a p52LOF/IκBδGOF R853*/WT NF-κB2/p100 variant, AR complete RelB deficiency (RelB−/−), or AR complete NIK deficiency (NIK−/−) without and with stimulation with TWEAK for 48 h, with an antibody recognizing the N-terminus of p100. Data representative of three independent experiments are shown. The bottom panels represent magnified images (cropped images).
Extended Data Fig. 6
Extended Data Fig. 6. Immunoglobulin level and B cell immunophenotyping of patients with inborn errors of NF-κB2.
(a) Immunoglobulin IgG, IgM, and IgA levels (g/L) in patients with inborn errors of NF-κB2. Normal immunoglobulin distribution corresponds to the grey area. Bars represent the median values. (b) B cell count across ages in patients with p52LOF/IκBδGOF variants with (n = 39, red dots) and without (n = 7, red squares) AAN-I-IFNs, patients with p52LOF/IκBδLOF/WT (n = 3, orange dots), p52GOF/IκBδLOF/WT (n = 4, blue dots), or neutral (PAD, grey dots) NF-κB2 variants. Normal B-cell count for age corresponds to the grey area. (c) Cell numbers among B cell subsets, as determined by CyTOF, in healthy donors (n = 15, black dots), patients with p52LOF/IκBδGOF variants aged ≥ 6 years (n = 9, red dots), patients with p52LOF/IκBδLOF variants (n = 4, orange dots), and APS-1 patients (n = 6, green dots). (d) Proportions of B cell subsets, as determined by CyTOF, in healthy donors (n = 15, black dots), patients with p52LOF/IκBδGOF variants (n = 10, red dots), patients with p52LOF/IκBδLOF variants (n = 3, orange dots), and APS-1 patients (n = 6, green dots). B-cell subset proportions from a patient with a p52LOF/IκBδLOF R52*/WT variant are not shown due to his lack of circulating B cells. (e) Proportions of B cell subsets and absolute counts of B cells identified in the 19 metaclusters in healthy donors (n = 22, black dots), patients with a p52LOF/IκBδGOF variant aged ≥ 6 years (n = 9, red dots), and patients with a p52LOF/IκBδLOF variant (n = 3, orange dots) (left panels); representation of the CD27, CD21, CD38, and CD24 markers on UMAP (middle panels); heatmap showing the mean levels of the surface markers included in the clustering defining 19 distinct metaclusters. The error bars represent the mean values (± s.d.) of each group.
Extended Data Fig. 7
Extended Data Fig. 7. AAN-I-IFNs in patients with inborn errors of the alternative NF-κB pathway.
(a-b) Luciferase-based neutralization assay for detecting auto-Abs neutralizing 10 ng/mL IFN-α2 (a) or IFN-ω (b) in patients with the three inborn errors of NF-κB2, APS-1 and PAD patients, positive controls (C+), and healthy controls (HC). (c) Correlation between the detection of auto-Abs against IFN-α2 by Gyros (x-axis) and results for the luciferase-based neutralization assay (y-axis) after stimulation with 10 ng/mL IFN-α2. The dotted line represents the cutoffs for detection (A.U. value > 50) or neutralization (induction <5). (d-e) Proportion of patients with auto-Abs neutralizing type I IFNs at 10 ng/mL or 100 pg/mL among patients with a p52LOF/IκBδGOF variant (d), and APS-1 patients (e). (f) Proportion of patients with AAN-I-IFNs among patients carrying a missense or pLOF p52LOF/IκBδGOF variant. (g) Age distribution of patients with the three inborn errors of NF-κB2, AR RelB or NIK deficiency, or APS-1 according to the presence or absence of AAN-I-IFNs in plasma. (h) Detection of IgG auto-Abs against IFN-α2 by Gyros in patients with inborn errors of NIK, RelB, BAFF and CD40L. (i-j) Luciferase-based neutralization assay for detecting auto-Abs neutralizing 10 ng/mL IFN-α2 (i) or IFN-ω (j) in patients with inborn errors of NIK, RelB, BAFF and CD40L. (k) Proportion of patients with auto-Abs neutralizing type I IFNs at 10 ng/mL or 100 pg/mL in patients with AR RelB deficiency. (l-m) Luciferase-based neutralization assay for detecting auto-Abs neutralizing 100 pg/mL IFN-α2 (l) or IFN-ω (m) in patients with inborn errors of the canonical NF-κB pathway. DN = dominant-negative. (n) Detection of auto-Abs neutralizing 100 pg/mL IFN-α2 or IFN-ω in patients with inborn errors of the alternative NF-κB pathway post-HSCT (n = 7) versus children with inborn errors of T-cell intrinsic immunity [(SCID, n = 3, CID, n = 1), neutrophil-intrinsic immunity (chronic granulomatous disease, CGD, n = 10), cytotoxicity (familial hemophagocytic lymphohistiocytosis, HLH, n = 3), erythrocyte function (β-thalassaemia, n = 3)] who underwent HSCT (Hematop. IE, n = 20) (left panel), with the time interval between HSCT and plasma collection (right panel).
Extended Data Fig. 8
Extended Data Fig. 8. Narrow autoantibody profiles in patients with p52LOF/IκBδGOF variants.
(a-b) Heat map of the autoantigens with the highest levels of enrichment in patients with a p52LOF/IκBδGOF variant (n = 13, a) or APS-1 patients (n = 15, b), versus patients with AR RelB deficiency (n = 8), AR NIK (n = 2) deficiency, or with APS-1 (n = 15), as determined with protein microarray (HuProt). Results are shown as the mean fluorescence of two technical replicates with a log2 fold-change >1.8 in patients with p52LOF/IκBδGOF variants (a) or APS-1 (b) relative to 25 healthy controls (HC). (c) Detection of IgG auto-Abs against IL-17A, IL-17F, or IL-22 using a multiplex bead array in patients with inborn errors of the alternative NF-κB pathway. Data representative of one independent experiment are shown. (d) Protein microarray distribution of auto-Abs against IFN-α and IFN-ω (red dots) or other autoantigens frequently found targeted in patients with APS-1 (green dots), in patients with a p52LOF/IκBδGOF variant, relative to controls. (e) Protein microarray distribution of auto-Abs against IFN-α and IFN-ω (red dots), or other autoantigens associated with APS-1 (green dots) in APS-1 patients relative to controls. (f) Number of autoreactive IgG in each patient (APS-1, p52LOF/IκBδGOF, RelB−/−) or control, as determined by the sum of autoantigens with a log2 FC > 1.5 relative to the mean value for all healthy controls (HC). The error bars represent the median ± s.d. of the autoreactive IgG in each group. Comparisons done using two-tailed Mann–Whitney test. (g) Proportion of shared (by ≥ 2 patients) and private reactive autoantigens in the group of patients with a p52LOF/IκBδGOF variant, APS-1, or AR RelB deficiency. (h) Detection of auto-Abs against ATP4A, RBM38, or TROVE2 in a multiplex bead array. The white dot indicates the positive control for the detection of anti-TROVE2 auto-Abs. A.U. corresponds to arbitrary units. Data representative of one independent experiment are shown.
Extended Data Fig. 9
Extended Data Fig. 9. AAN-I-IFNs prevent ISG induction in blood and the upper respiratory tract during COVID-19, a defect that can be rescued by exogenous IFN-β treatment.
(a) Correlation between age and COVID-19 severity in patients with inborn errors of NF-κB2. The crossed light red square represents a patient with auto-Abs neutralizing only IFN-ω at 100 pg/mL. (b) Changes in the titres of auto-Abs against IFN-α2, as measured by Gyros, with age, in patients with a p52LOF/IκBδGOF variant and COVID-19. Red arrows indicate the onset of COVID-19. (c) Heatmap showing the neutralization profile of P27 et P28 heterozygous for a p52LOF/IκBδGOF variant (R853Afs*30/WT) during COVID-19. (d) Longitudinal follow-up of anti-S and anti-N IgG in P27 and P28 during the course of COVID-19, before and after treatment by the infusion of an anti-S monoclonal Ab (mAb, grey arrow). (e) Overview of the longitudinal investigation of COVID-19 episodes in P27 et P28. (f) Neutralization capacity of the nasal swab from P27 et P28 upon SARS-CoV-2 infection and individuals infected with the omicron variant but without detectable AAN-I-IFNs (controls, n = 4, grey dots). Bars represent the median. (g) Longitudinal IFN module enrichment score during the course of COVID-19 in P27 and P28 and in two age-matched controls infected with SARS-CoV-2. IFN modules M.10.1 and M.8.3 are represented. Values obtained before and after the treatment of P27 and P28 with IFN-β. (h) ISG score induction by IFN module analysis during the course of COVID-19 in P27 and P28, before and after recombinant IFN-β treatment, and in age-matched controls (C1 and C2, n = 2) infected with SARS-CoV-2.
Extended Data Fig. 10
Extended Data Fig. 10. Thymus volume in p52LOF/IκBδGOF children, and autoimmune pathology and autoreactive IgG profiles in Nfkb2+/Y868* mice.
(a) Estimation of thymus volume in p52LOF/IκBδGOF patients relative to aged-matched controls aged from 3 to 16 years. Black line represents simple linear regression of the control thymus volume with its 95% confidence bands (grey area). Data representative of one independent experiment are shown. (b) Immunofluorescence staining of thymic tissue from age-matched controls and patients with AR complete RelB deficiency or a p52LOF/IκBδGOF variant. HaC, Hassall’s corpuscles. Scale bars, 50 μm (left and right panel) or 100 μm (central panel). (c) Representative confocal microscopy images of the thymic medulla stained for cytokeratin 5 (K5) for the WT controls (Nfkb2+/+, n = 3) or Nfkb2+/Y868* mice (n = 3). Scale bar, 100 μm. Data representative of two independent experiment are shown. (d) Contour plot for Aire expression in mature MHC-II+ mTECs. (e) Absolute number of EpCAM+CD45- thymic epithelial cells (TECs), and TEC subsets in Nfkb2+/+ (n = 5) and Nfkb2+/Y868* (n = 7) mice. Comparisons done using unpaired, parametric, two-tailed Student’s t-test (for EpCAM+ TECs) or two-way non-parametric ANOVA (Sidak’s test) with correction for multiple comparisons (for TEC subsets). Three independent experiments were performed. (f) Summary of lymphocytic cell infiltrates in Nfkb2+/+ (n = 3) and Nfkb2+/Y868* (n = 4) mice. Each circle represents an individual animal, and each slice of the circle represents a tested organ. Lymphocytic infiltrates of the designated organ are indicated by the grey-shaded sections of the circle. One independent experiment was performed. (g) Representative tissue sections stained with hematoxylin and eosin (H&E) showing lymphocytic infiltrates (black arrows) in Nfkb2+/+ or Nfkb2+/Y868* mice. Scale bar, 50 μm. Data representative of one independent experiment are shown. (h-i) Heatmap of the top 20 autoreactivities by degree of enrichment, in Aire-KO (h) or Nfkb2+/Y868* (i) mice relative to WT and Rag2-KO mice. (j-k) Number of autoreactive peptides (j) or antigens (k) displaying enrichment in WT, Rag2-KO, Nfkb2+/Y868* and Aire-KO mice, and representation of the autoreactive peptide and antigen profiles of Nfkb2+/Y868* and Aire-KO mice, with their overlap. Comparisons done using two-tailed Mann–Whitney test. (l) Representative confocal microscopy images of K10 and DAPI staining on Nfkb2+/+ (n = 3) and Nfkb2+/Y868* (n = 3) mouse thymuses. Scale bars, 20 μm. Data representative of two independent experiments are shown. Source Data

Similar articles

Cited by

References

    1. Levin M. Anti-interferon auto-antibodies in autoimmune polyendocrinopathy syndrome type 1. PLoS Med. 2006;3:e292. doi: 10.1371/journal.pmed.0030292. - DOI - PMC - PubMed
    1. Meager A, et al. Anti-interferon autoantibodies in autoimmune polyendocrinopathy syndrome type 1. PLoS Med. 2006;3:e289. doi: 10.1371/journal.pmed.0030289. - DOI - PMC - PubMed
    1. Bastard P, et al. Preexisting autoantibodies to type I IFNs underlie critical COVID-19 pneumonia in patients with APS-1. J. Exp. Med. 2021;218:e20210554. doi: 10.1084/jem.20210554. - DOI - PMC - PubMed
    1. Puel A, Bastard P, Bustamante J, Casanova J-L. Human autoantibodies underlying infectious diseases. J. Exp. Med. 2022;219:e20211387. doi: 10.1084/jem.20211387. - DOI - PMC - PubMed
    1. Mogensen KE, Daubas P, Gresser I, Sereni D, Varet B. Patient with circulating antibodies to alpha-interferon. Lancet. 1981;318:1227–1228. doi: 10.1016/S0140-6736(81)91460-4. - DOI - PubMed

MeSH terms

Supplementary concepts