. 2023 Nov;623(7988):814-819.
doi: 10.1038/s41586-023-06709-x. Epub 2023 Nov 8.

Single-molecule dynamics show a transient lipopolysaccharide transport bridge

Affiliations

Single-molecule dynamics show a transient lipopolysaccharide transport bridge

Lisa Törk et al. Nature. 2023 Nov.

Abstract

Gram-negative bacteria are surrounded by two membranes. A special feature of the outer membrane is its asymmetry. It contains lipopolysaccharide (LPS) in the outer leaflet and phospholipids in the inner leaflet1-3. The proper assembly of LPS in the outer membrane is required for cell viability and provides Gram-negative bacteria intrinsic resistance to many classes of antibiotics. LPS biosynthesis is completed in the inner membrane, so the LPS must be extracted, moved across the aqueous periplasm that separates the two membranes and translocated through the outer membrane where it assembles on the cell surface4. LPS transport and assembly requires seven conserved and essential LPS transport components5 (LptA-G). This system has been proposed to form a continuous protein bridge that provides a path for LPS to reach the cell surface6,7, but this model has not been validated in living cells. Here, using single-molecule tracking, we show that Lpt protein dynamics are consistent with the bridge model. Half of the inner membrane Lpt proteins exist in a bridge state, and bridges persist for 5-10 s, showing that their organization is highly dynamic. LPS facilitates Lpt bridge formation, suggesting a mechanism by which the production of LPS can be directly coupled to its transport. Finally, the bridge decay kinetics suggest that there may be two different types of bridges, whose stability differs according to the presence (long-lived) or absence (short-lived) of LPS. Together, our data support a model in which LPS is both a substrate and a structural component of dynamic Lpt bridges that promote outer membrane assembly.


Conflict of interest statement

Competing interest declaration

The authors declare no competing interests.

Figures

Extended Data Fig. 1:
Extended Data Fig. 1:. Lpt-HaloTag fusions are expressed and support cell growth.
a, α-LptA immunoblot of LT136 (expresses wild-type endogenous LptA (~20 kDa) and LptA-Halo (~53kDa)), LT23 (expresses LptA-Halo) and TB28 (expresses wild-type endogenous LptA). b, α-LptB immunoblot of LT137 (expresses wild-type endogenous LptB (~25 kDa) and Halo-LptB (~55 kDa)), LT17 (expresses Halo-LptB), and TB28 (expresses wild-type endogenous LptB). c, α-LptC immunoblot of LT138 (expresses wild-type endogenous LptC (~20 kDa) and Halo-LptC (~55kDa)), LT16 (expresses Halo-LptC) and TB28 (expresses wild-type endogenous LptC). d, α-LptD immunoblot of LT18 (expresses LptD-Halo) and TB28 (expresses wild-type endogenous LptD) without and with beta-mercaptoethanol (βme) treatment. Under nonreducing conditions, wild-type endogenous LptD is ~110 kDa and LptD-Halo is ~150 kDa. The addition of βme reduces disulfide bonds in LptD and causes wild-type endogenous LptD to run around 87 kDa, and LptD-Halo to run around 120 kDa. LptD-Halo shows the same response to βme addition as wild-type LptD, confirming that it can properly fold. e, α-LptE immunoblot of LT61 (expresses wild-type endogenous LptE (~20 kDa) and Halo-LptE (~55kDa)), LT63 (expresses Halo-LptE) and TB28 (expresses wild-type endogenous LptE). a–e, Shown results are representative of two independent experiments. LT136, LT137, LT138, and LT61 were included in blots as controls to identify bands. Uncropped gel images can be found in Supplementary Figure 1. f, Growth curves of LT23 (LptA-Halo), LT17 (Halo-LptB), LT16 (Halo-LptC), LT18 (LptD-Halo), LT63 (Halo-LptE) and TB28 (WT, green).
Extended Data Fig. 2:
Extended Data Fig. 2:. Representative trajectories of Halo-tagged LptA, B, C, D, and E.
Trajectories were overlaid over the corresponding phase image. Each trajectory is represented in a different color. The color was chosen randomly.
Extended Data Fig. 3:
Extended Data Fig. 3:. Mean square displacement versus τ curves show inhomogeneous dynamics for LptA, B, and C.
20 randomly sampled MSD versus τ plots are shown for trajectories collected for LptA, B, C, E, and D. MSD plots for LptA, B and C trajectories show immobile, mobile and also switching trajectories. LptD and E show mostly immobile trajectories.
Extended Data Fig. 4:
Extended Data Fig. 4:. Cumulative distribution function analysis shows two-state dynamics for LptA, B, and C.
Cumulative distribution function of displacements with Δt=200 ms for single-molecule tracks of LptA, B, C, and D were plotted. (Figure 1f) One state (red line) and two state (black line) dynamic models were fitted to the CDF plots. a, Residuals for the one-state dynamic model fit are plotted. b, Residuals for the two-state dynamic model fit are shown. For all three proteins, the two-state model resulted in the best fit without over fitting the curve. The results shown are representatives of at least two independent experiments.
Extended Data Fig. 5:
Extended Data Fig. 5:. The mobility of LptA, LptB, and LptC changes in response to altering the levels of LptC* and LptC
a, Immunoblots against LptC and RpoA are shown for LT16 containing pBAD33LptC(G153R) treated with different arabinose (ara) concentrations to express LptC(G153R) (LptC*) under the same conditions used for imaging. Molecular weight markers are given in kDa. b, Immunoblots against LptC, LptB, and LptA are shown for LT16 containing pBAD33LptC treated with different arabinose (ara) concentrations to express wild-type LptC. c, Confinement radius plots for LptA, B, and C without inducing (black line, LptC* low) and with inducing LptC(G153R) production with 40 mM arabinose (green line, LptC* high). n = low/high, LptA:3552/8330, LptB:6773/2324, LptC:18938/30560. d, Confinement radius plots for LptA, B, and C without inducing (black line, LptC low) and with inducing overproduction of wild-type LptC with 40 mM arabinose (green line, LptC high). n = low/high, LptA:2371/12773, LptB:1311/2747, LptC:8864/11788. e, Immunoblots of the fractionation of LptA-Halo containing strain, LT23, are shown. OMlight is a mixed membrane fraction and contains both IM and OM proteins (including the Lpt bridge), and OMheavy contains components fractionating only with the OM. Results shown in this figure are representative of at least two independent experiments.
Extended Data Fig. 6:
Extended Data Fig. 6:. LptA, LptB, and LptC display biexponential decay kinetics.
Single exponential curves (red) and biexponential curves (black) were fitted to the lifetime plots of LptA, B, and C. (line = fit, dots = lifetime data). (Figure 3b) Fitted values can be found in Extended Data Fig. 7. a, Residuals for the single exponential fits are shown (red). b, Residuals for the biexponential fits are shown (black). For all three proteins the biexponential fit resulted in the best fit of the lifetime distribution. Plots are representatives of two independent experiments.
Extended Data Fig. 7:
Extended Data Fig. 7:. Bridge lifetime follows a biexponential decay.
a, Bleaching control measurement; Halo-LptC (LT16) lifetime plots measured with 500 ms exposure in 500 ms intervals (green, n = 708) compared to 500 ms exposure in 1 s intervals (blue, n = 1186). The average of two independent experiments is shown with the standard deviations (error bars.) b, Results for the fitted values of the biexponential and exponential fits to the lifetime data of LptA, B, and C, and for the lifetime data measured for LptB under overproduction of LptCA-fusion. Provided values are the mean of two independent experiments and the standard deviation is given as error. c, Silver stain, α-LptA, α-LptD, α-LptE and α-RpoA blots of LT17 with (+/LPSlow) and without (−/wt) 0.5X MIC LpxC inhibitor (PF 5081090) treatment are shown. Two replicates are shown. The silver stain detects LPS levels. Molecular weight markers are given in kDa. d, Spot dilutions of LT17 on LB agar after LpxC inhibitor treatment (LPSlow) are shown in comparison to untreated LT17. Three biological replicates are shown. e, Phase images of LT17 with (LPSlow) and without (wt) LpxC inhibitor treatment are shown. Shown images are representative field of views of two independent experiments. Histograms of cell length and width, measured of LT17 cells (n=cells/independent experiments, LPSwt:300/2, LPSlow:300/2) with (blue) and without (green) LpxC inhibitor treatment are depicted. f, Confinement radius plots for Halo-LptB under wild-type conditions (black line, n = 2110) and with LpxC inhibitor treatment (green line, n = 8145). g, Confinement radius plots for Halo-LptB under wild-type conditions (black line, n = 3637) and with overproduction of LptCA-fusion protein (40 mM arabinose, green line, n = 3602). f, g, Results are representative of at least two independent experiments. h, i, Residuals of the exponential (red, h) and biexponential (black, i) fit to the LptCA-fusion lifetime distribution (Figure 4b) are shown.
Figure 1:
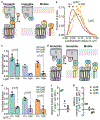
Figure 1:. Observation of an immobile state for Lpt proteins suggests they can form a bridge in cells.
a, Schematic depicting the bridge model of LPS transport. b,c, Representative single-molecule tracks of LptD-Halo (strain LT18), Halo-LptE (strain LT63) (b), and LptA-Halo (strain LT23), Halo-LptB (strain LT17) and Halo-LptC (strain LT16) (c) are shown. Each single-molecule track is shown in a different, randomly chosen color and overlaid over the corresponding phase-contrast image. Further representative trajectory images can be found in Extended Data Fig. 2. Representative single-molecule videos can be found in supplementary materials. d, (top) Schematic depicting the confinement radius measurement (blue dot = centroid of the track, black dots = Cartesian coordinates of the track). (bottom) Confinement radii histograms for the different imaged Lpt protein tracks are shown in comparison to the confinement radii histogram of immobilized dye (grey), serving as localization precision control. n = dye:4836, LptA:1250, LptB:2964, LptC:4675, LptD:855, LptE:1092. Shown results are representative of at least two independent experiments. Tracks with a confinement radius ≤ 0.07 μm (red dotted line) are considered immobile. e, CDF of displacements with Δt=200 ms for single-molecule tracks of LptA, B, C, and D are plotted. f, One state (red line) and two state (black line) dynamic models were fitted to the CDF plots of LptA, B, and C. g, The average Diffusion constant, Dfast, and alpha values (immobile fraction) with standard deviations for LptA, B and C are reported. These values result from the two-state dynamic model fit to the CDF plots. Residual plots are shown in Extended Data Fig. 4. Sample sizes for the CDF plots and all fit values are reported in Supplementary Table 5.
Figure 2:
Figure 2:. LptA has immobile states independent of the bridging state; LptB does not.
a, Schematic depicting breaking of Lpt bridges upon induction of an LptC mutant (C*), LptC(G153R), that cannot form bridges in cells. b, Confinement radius plots of Halo-LptC tracks measured in the presence of increasing levels of LptC*, induced with 0, 1, 7, 20, or 40 mM of arabinose. n = (low-high, respectively), 5142, 7292, 12660, 7671, 13546. Shown result is representative of two independent experiments. c, e, Immobile fractions of single-molecule LptA, B, and C tracks, imaged with (high) or without (low) inducing LptC(G153R) (c) or wild-type LptC (e) production with 40 mM arabinose are shown. The bar depicts the average of independent experiments. Independent experiments are depicted as dots. The immobile fraction is the value α, obtained by the CDF fit. P-values were obtained from an independent two-sided t-test. (n=trajectories/independent experiments: c, LptAC*low 7926/4, LptAC*high 25407/4, LptBC*low 9603/2, LptBC*high 16488/2, LptCC*low 30847/3, LptCC*high 47101/3, e, LptAC*low 14300/3, LptAC*high 44086/3, LptBC*low 6407/3, LptBC*high 15591/3, LptCC*low 11427/3, LptCC*high 14076/3). CDF fit values and trajectory sample sizes are given in Supplementary Table 5. Corresponding confinement radius plots for the tracks can be found in Extended Data Fig. 5 c–d. d, Schematic depicting the hypothesized effect of overproduction of wild-type LptC. f, The quotient of LptA, B, and C tracks per cell surface under LptC overproduction and LptA, B, and C tracks per cell surface under wild-type conditions. g, The quotient of immobile LptA, B, and C tracks per cell surface under overproduction of wild-type LptC and immobile LptA, B, and C tracks per cell surface under wild-type conditions. f, g, The average of the respective independent experiments is depicted as a line. An average quotient higher than 1 indicates an increase in (immobile-) tracks per cell, and smaller than 1 indicates a decrease upon overproduction of LptC. Values for (immobile-) tracks per cell for each condition and time-lapse are given in Supplementary table 6.
Figure 3:
Figure 3:. Bridges break and form rapidly with bridge formation facilitated by LPS.
a, Measured lifetimes for Halo-tagged LptA (n = 2140), B (n = 1837), and C (n = 708) in the immobile state are shown in survival probability plots. Lifetimes were measured by fitting intensity traces of immobile spots to a hidden Markov model. The average of two independent experiments is shown with standard deviations (error bars.) b, Single exponential curves (red) and biexponential curves (black) are fitted to the lifetime plots of LptA, B, and C. (line = fit, dots = lifetime data). Plots are representatives of two independent experiments. Residuals plots can be found in Extended Data Fig. 6 and fitted values can be found in Extended Data Fig. 7 b. c, Lifetime distribution plots of immobile Halo-LptB tracks without (“wt”, green, n = 1511) and with (“low”, blue, n = 1949) LpxC inhibitor (~0.5X MIC) treatment. The average of two independent experiments is shown with standard deviations (error bars.) d, The immobile fractions of single-molecule LptB tracks, measured under wild-type (wt) and with LpxC inhibitor (~0.5X MIC) treatment (“low”) conditions is shown. The bar depicts the average of two independent experiments. Independent experimental values are depicted as dots. (n=trajectories/independent experiments: LPSwt 3707/2, LPSlow 17015/2. The immobile fraction is the value α, obtained by the CDF fit. CDF fit results, samples sizes are reported in Supplementary Table 5. Corresponding confinement radius plots for the tracks can be found in Extended Data Fig. 7 f.
Figure 4:
Figure 4:. Model for coordinating intermembrane Lpt bridge formation with LPS transport.
a, Schematic depicting Lpt bridge breakage when bridges contain the LptC-A fusion protein. b, Single exponential curve (red) and biexponential curve (black) are fitted to the lifetime plot of LptB in the presence of LptC-A fusion. (line = fit, dots = lifetime data). Fitted values and residual plots can be found in Extended Data Fig. 7b, h, i. Representative plot of two independent experiments is shown. c, Survival probability plots of LptB lifetimes with (blue dots, n = 1286) and without (green dots, n = 1047) overproduction of the LptC-A fusion protein. The average of two independent experiments is shown with standard deviations (error bars.) d, Immobile fractions of single-molecule LptB tracks, measured without (low) or with (high) induction of LptCA-fusion protein expression are shown. The bar depicts the average of three independent experiments. Independent experimental values are depicted as dots. Simultaneously performed experiments are denoted with the same dot type. (n=trajectories/independent experiments: LptCAlow 13485/3, LptCAhigh 14491/3. The immobile fraction is the value α, obtained by the CDF fit. CDF fit results and samples size are reported in Supplementary Table 5. Corresponding confinement radius plot for the tracks can be found in Extended Data Fig. 7 g. e, Schematic depicting model for bridge formation and breakage.

References

    1. Osborn M, Gander J, Parisi E & Carson J Mechanism of assembly of the outer membrane of Salmonella typhimurium: isolation and characterization of cytoplasmic and outer membrane. Journal of Biological Chemistry 247, 3962–3972 (1972). - PubMed
    1. Kamio Y & Nikaido H Outer membrane of Salmonella typhimurium: accessibility of phospholipid head groups to phospholipase c and cyanogen bromide activated dextran in the external medium. Biochemistry 15, 2561–2570 (1976). - PubMed
    1. Mühlradt PF & Golecki JR Asymmetrical distribution and artifactual reorientation of lipopolysaccharide in the outer membrane bilayer of Salmonella typhimurium. European journal of biochemistry 51, 343–352 (1975). - PubMed
    1. Raetz CR & Whitfield C Lipopolysaccharide endotoxins. Annual review of biochemistry 71, 635–700 (2002). - PMC - PubMed
    1. Sperandeo P. et al. Functional analysis of the protein machinery required for transport of lipopolysaccharide to the outer membrane of Escherichia coli. Journal of bacteriology 190, 4460–4469 (2008). - PMC - PubMed

Publication types

MeSH terms

LinkOut - more resources