. 2024 Mar;22(3):635-649.
doi: 10.1111/pbi.14211. Epub 2023 Nov 8.

The TaSOC1-TaVRN1 module integrates photoperiod and vernalization signals to regulate wheat flowering

Affiliations

The TaSOC1-TaVRN1 module integrates photoperiod and vernalization signals to regulate wheat flowering

Xumei Luo et al. Plant Biotechnol J. 2024 Mar.

Abstract

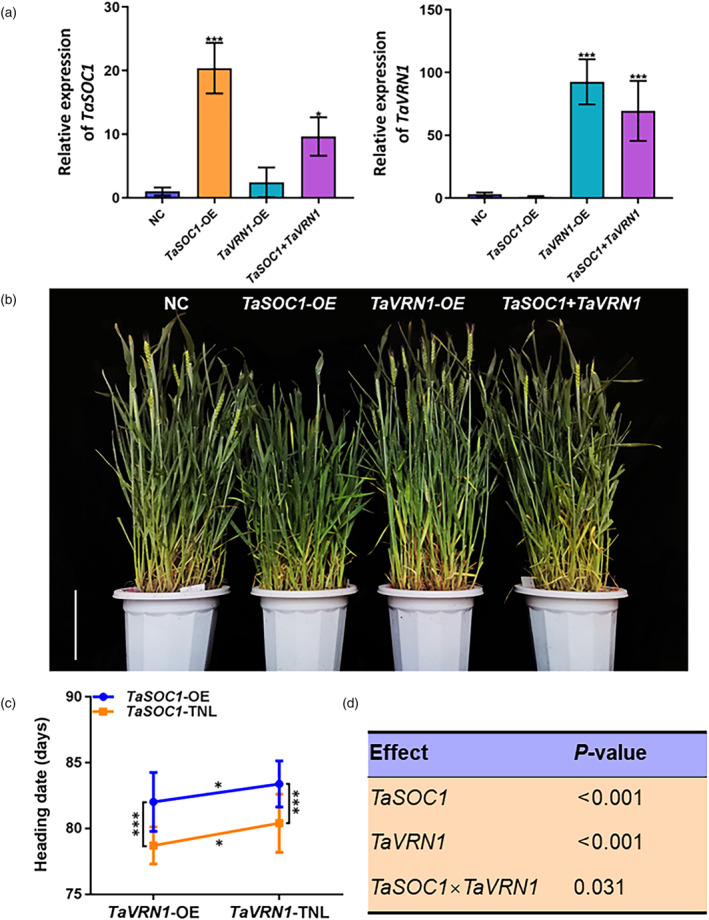
Wheat needs different durations of vernalization, which accelerates flowering by exposure to cold temperature, to ensure reproductive development at the optimum time, as that is critical for adaptability and high yield. TaVRN1 is the central flowering regulator in the vernalization pathway and encodes a MADS-box transcription factor (TF) that usually works by forming hetero- or homo-dimers. We previously identified that TaVRN1 bound to an MADS-box TF TaSOC1 whose orthologues are flowering activators in other plants. The specific function of TaSOC1 and the biological implication of its interaction with TaVRN1 remained unknown. Here, we demonstrated that TaSOC1 was a flowering repressor in the vernalization and photoperiod pathways by overexpression and knockout assays. We confirmed the physical interaction between TaSOC1 and TaVRN1 in wheat protoplasts and in planta, and further validated their genetic interplay. A Flowering Promoting Factor 1-like gene TaFPF1-2B was identified as a common downstream target of TaSOC1 and TaVRN1 through transcriptome and chromatin immunoprecipitation analyses. TaSOC1 competed with TaVRT2, another MADS-box flowering regulator, to bind to TaVRN1; their coding genes synergistically control TaFPF1-2B expression and flowering initiation in response to photoperiod and low temperature. We identified major haplotypes of TaSOC1 and found that TaSOC1-Hap1 conferred earlier flowering than TaSOC1-Hap2 and had been subjected to positive selection in wheat breeding. We also revealed that wheat SOC1 family members were important domestication loci and expanded by tandem and segmental duplication events. These findings offer new insights into the regulatory mechanism underlying flowering control along with useful genetic resources for wheat improvement.

Keywords: Triticum aestivum; TaSOC1; TaVRN1; flowering time; photoperiod; vernalization.


Conflict of interest statement

The authors declare no conflicts of interest.

Figures

Figure 1
Figure 1
Phenotypic analyses of TaSOC1 overexpression lines (TaSOC1‐OE) and transgenic null lines (TNL) under different vernalization conditions. Statistical analyses of the heading date of TaSOC1‐OE and TNL after exposure to 30‐ (a), 14‐ (c) and 0‐day (e) of vernalization treatments (n = 40 plants). OE2, OE3 and OE25 are representative lines of TaSOC1‐OE. TNL is the negative control (NC). ***P < 0.001. Phenotypic display of heading date of TaSOC1‐OE and TNL after exposure to 30‐ (b), 14‐ (d) and 0‐day (f) vernalization treatments. Scale bar, 30 cm.
Figure 2
Figure 2
TaSOC1 knockout lines (TaSOC1‐KO) and phenotypic investigation of TaSOC1‐KO and KN199 under differing vernalization conditions. (a) Sequencing‐based identification of TaSOC1 knockout (KO) mutants. PAM and mutant sites are shown in red and blue, respectively; orange bars and black lines represent exons and introns, respectively; ATG, start codon; sgRNA, small guide RNA; TGA, stop codon. Statistical analyses (b) and phenotype display (c) of the heading date of TaSOC1‐KO and KN199 following 30 days (complete) of vernalization. Statistical analyses (d) and phenotype display (e) of heading dates of TaSOC1‐KO and KN199 following 14 days (partial) vernalization. Statistical analyses (f) and phenotype display (g) of heading dates of TaSOC1‐KO and KN199 under non‐vernalization conditions (n = 40 plants). KO1, KO2 and KO3 are representative TaSOC1‐KO. KN199 was used as the negative control (NC). *P < 0.05, **P < 0.01, ns, not significant; scale bar, 30 cm.
Figure 3
Figure 3
Confirmation of the interaction between TaSOC1 and TaVRN1, and spatiotemporal overlapping of their expression responses to vernalization in leaves. Bimolecular fluorescence complementation (BiFC) (a) and luciferase complementation imaging (LCI) (b) assays confirm interaction of TaSOC1 and TaVRN1 in wheat protoplasts and N. benthamiana leaves, respectively. TaSOC1‐cYFP+nYFP and cYFP+TaVRN1‐nYFP were used as negative controls in BiFC assays; nLUC+TaSOC1‐cLUC, TaVRN1‐nLUC+cLUC and nLUC+cLUC were used as negative controls in LCI assays; the nuclei of some cells in the bright and chlorophyll fields of BiFC images were labelled using arrows. Scale bars, 50 μm; LUC, luciferase. TaSOC1 (c) and TaVRN1 (d) had clear responses to vernalization treatments (n = three biological replicates). Sampling time‐points include the day before vernalization (V0), 7th day (V7), 21st day (V21) and 35th day of vernalization (V35), and 7th day (V35N7) and 21st day post‐vernalization (V35N21); orange and blue lines represent vernalization and non‐vernalization (negative control) treatments, respectively; error bars indicate standard deviations of three biological replicates.
Figure 4
Figure 4
Identification of genetic interaction between TaSOC1 and TaVRN1. (a) Relative expression levels of TaSOC1 and TaVRN1 in the lines with different genotypes in a segregating population derived from cross TaSOC1‐OE × TaVRN1‐OE. Transgenic null lines (TNL) are negative control (NC); TaSOC1‐OE, TaSOC1 overexpression lines; TaVRN1‐OE, TaVRN1 overexpression lines; TaSOC1 + TaVRN1, double overexpression lines. (b) Phenotype visualization for heading dates of different genotypes under incomplete vernalization conditions (14‐day vernalization treatments). Scale bar, 30 cm. Student's t tests (c) and two‐way ANOVA (d) for heading dates for different genotypes under incomplete vernalization conditions (n = 40 plants). *P < 0.05, ***P < 0.001; bars represent standard deviations of three biological replicates.
Figure 5
Figure 5
Identification of common downstream target genes regulated by TaSOC1 and TaVRN1 and detection of TaSOC1 and TaVRN1 enrichment at different sites of TaFPF1. (a) Identification of differentially expressed genes (DEGs) in TaSOC1 overexpression lines (TaSOC1‐OE) and TaVRN1 overexpression lines (TaVRN1‐OE) compared to respective transgenic null lines (TNL) based on RNA‐seq assays. The overlapping part of the blue and orange circles indicates 15 DEGs shared by TaSOC1 and TaVRN1. RNA‐seq (b) and reverse transcription quantitative PCR (RT‐qPCR) (c) assays for expression levels of TaFPF1‐2B in TaSOC1‐OE and TaVRN1‐OE (n = three biological replicates). FPKM, fragments per kilobase million. OE, overexpression line; TNL, transgenic null line. Note: TaFPF1 expression levels in TaSOC1‐OE and TaVRN1‐OE were compared to the counterparts of their respective TNLs. (d) TaFPF1‐2B expression analyses in a F2 segregating population derived from cross TaSOC1‐OE × TaVRN1‐OE using RT‐qPCR (n = three biological replicates). NC, negative control (TNLs identified from the F2 population). (e) Schematic of detection sites in the TaFPF1 promoter. The blue arrowheads indicate the positions of CArG‐like motifs, and black boxes 1–11 represent different detection sites; orange box, first exon; TSS, transcription start site; ATG, start codon. (f) TaSOC1 and TaVRN1 enrichment at different sites of the TaFPF1 promoter using chromatin immunoprecipitation quantitative PCR (ChIP‐qPCR) assays (n = three biological replicates). Anti‐GFP, GFP antibody; NIC, non‐immune control; *P < 0.05, **P < 0.01, ***P < 0.001, ns, not significant. (g) Validation of TaSOC1 and TaVRN1 binding to the representative sites 5, 7 and 8, close to transcription sites of TaFPF1, by yeast one‐hybrid (Y1H) assays. 5, 7 and 8 indicate the sites 5, 7 and 8 in the TaFPF1 promoter; 5 m, 7 m and 8 m represent their respective mutated versions. The promoter in LacZi empty vector is used as a negative DNA bait. AD represents activation domain in the vector pB42AD.
Figure 6
Figure 6
TaSOC1 responses to gibberellin and photoperiod using quantitative real‐time PCR and transgenic assays. (a) Expression pattern of TaSOC1 under GA treatments. Sampling time‐points include the day before GA treatment (0), and first (1 week), second (2 weeks), third (3 weeks), fourth (4 weeks) and fifth (5 weeks) week of GA treatment (n = three biological replicates); the orange and blue lines represent the GA treatments and non‐treatment controls (NTC), respectively. (b) Expression pattern of TaSOC1 under photoperiod treatments (n = three biological replicates). The numbers on the horizontal axis represent sampling time‐points (0 shows the day before photoperiod treatments; 5, 10, 15 and 20 days represent the 5th, 10th, 15th and 20th day of photoperiod treatment, respectively; N5 days and N10 days indicate the 5th and 10th day after 20‐day photoperiod treatment, respectively); orange and blue lines represent short‐day (SD) and long‐day (LD) treatments, respectively. (c) Expression pattern of TaSOC1 at different time‐points over a single day during photoperiod treatments (n = three biological replicates). Sampling time‐points include 6:00, 10:00, 14:00, 18:00 and 22:00 o'clock in 1 day; orange and blue lines represent SD and LD treatments, respectively. Statistical analysis (d) and phenotypes (e) of heading date of TaSOC1 overexpression lines (TaSOC1‐OE) and transgenic null lines (TNL) following GA treatments (n = 40 plants). Statistical analyses (f) and phenotypes (g) of heading date of TaSOC1‐OE and TNL under photoperiod treatments (n = 40 plants). Statistical analysis (h) and phenotypes (i) of heading date of TaSOC1 knockout lines (TaSOC1‐KO) and KN199 under SD conditions following complete vernalization (n = 40 plants). KO1, KO2 and KO3, representative TaSOC1‐KO lines; NC (negative control), KN199; *P < 0.05, **P < 0.01, ***P < 0.001, ns, not significant; scale bar, 30 cm.
Figure 7
Figure 7
Allelic variations and genetic effects of TaSOC1 and orthologue TaSOC1‐5A. Identification of sequence variants and haplotypes of TaSOC1 (a) and TaSOC1‐5A (b). The amino acid changes are indicated in red; orange boxes show exons and black lines indicate promoters or introns; the first nucleotide of the start codon is defined as +1; ATG, start codon; TGA, stop codon. Visualization of genotyped gene‐specific markers for major haplotypes of TaSOC1 (c) and TaSOC1‐5A (d). Blue, red and black dots in (c) indicate TaSOC1‐Hap1, TaSOC1‐Hap2 and NTC (non‐template control) genotypes, respectively; the pink dot represents a cultivar that failed successful genotyping. In (d): M, DL2000 DNA marker ladder (TaKaRa); lanes 3, 7 and 10 indicate TaSOC1‐5A‐Hap1 with the 246 and 372 bp target bands (blue arrows); lanes 1, 2, 4, 5, 6, 8 and 9 show the 618 bp target band (red arrow) for TaSOC1‐5A‐Hap2; bp, base pairs. (e) Genetic effects of the major TaSOC1 and TaSOC1‐5A haplotypes on heading date. *P < 0.05; ns, not significant.

Similar articles

Cited by

References

    1. Borner, R. , Kampmann, G. , Chandler, J. , Gleiûner, R. , Wisman, E. , Ape, K. and Melzer, S. (2000) A MADS domain gene involved in the transition to flowering in Arabidopsis . Plant J. 24, 591–599. - PubMed
    1. Cao, S.H. , Kumimoto, R.W. , Gnesutta, N. , Calogero, A.M. , Mantovani, R. and Holt, B.F., 3rd (2014) A distal CCAAT/NUCLEAR FACTOR Y complex promotes chromatin looping at the FLOWERING LOCUS T promoter and regulates the timing of flowering in Arabidopsis . Plant Cell, 26, 1009–1017. - PMC - PubMed
    1. Cao, S.H. , Luo, X.M. , Xu, D.A. , Tian, X.L. , Song, J. , Xia, X.C. , Chu, C.C. et al. (2021) Genetic architecture underlying light and temperature mediated flowering in Arabidopsis, rice, and temperate cereals. New Phytol. 230, 1731–1745. - PubMed
    1. Cao, S.H. and Yan, L.L. (2013) Construction of a high‐quality yeast two‐hybrid (Y2H) library and its application in identification of interacting proteins with key vernalization regulator TaVRN‐A1 in wheat. BMC. Res. Notes, 6, 81. - PMC - PubMed
    1. Chen, A. and Dubcovsky, J. (2012) Wheat TILLING mutants show that the vernalization gene VRN1 down‐regulates the flowering repressor VRN2 in leaves but is not essential for flowering. PLoS Genet. 8, e1003134. - PMC - PubMed

Substances

Associated data