. 2023 Nov 8;18(11):e0290423.
doi: 10.1371/journal.pone.0290423. eCollection 2023.

Eurasian back-migration into Northeast Africa was a complex and multifaceted process

Affiliations

Eurasian back-migration into Northeast Africa was a complex and multifaceted process

Rickard Hammarén et al. PLoS One. .

Abstract

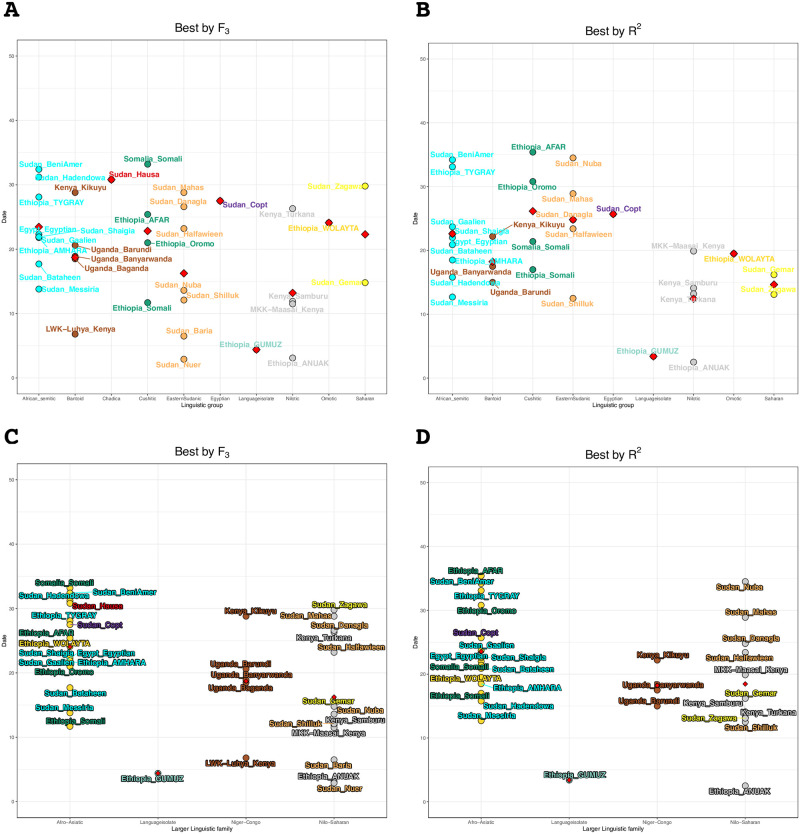
Recent studies have identified Northeast Africa as an important area for human movements during the Holocene. Eurasian populations have moved back into Northeastern Africa and contributed to the genetic composition of its people. By gathering the largest reference dataset to date of Northeast, North, and East African as well as Middle Eastern populations, we give new depth to our knowledge of Northeast African demographic history. By employing local ancestry methods, we isolated the Non-African parts of modern-day Northeast African genomes and identified the best putative source populations. Egyptians and Sudanese Copts bore most similarities to Levantine populations whilst other populations in the region generally had predominantly genetic contributions from the Arabian peninsula rather than Levantine populations for their Non-African genetic component. We also date admixture events and investigated which factors influenced the date of admixture and find that major linguistic families were associated with the date of Eurasian admixture. Taken as a whole we detect complex patterns of admixture and diverse origins of Eurasian admixture in Northeast African populations of today.


Conflict of interest statement

The authors have declared that no competing interests exist.

Figures

Fig 1
Fig 1. Spatial distribution of ancestries.
A) ADMIXTURE results for K = 7, 13 & 14 visualized using PONG (a truncated version of S2 Fig, and the K = 13 and 14 panels do not include all clusters, e.g. East Asia is not represented). B) Kriging plot of the distribution of the pink component at K = 14 (maximized in Yemen) in A on the East Africa populations. C) Kriging plot of the distribution of the dark blue component (Lebanese) from K = 14. D) FEEMS plot of inferred patterns of migration rates for the lowest cross-validation lambda. High w (blue) indicates an area with higher than average effective migration whilst low w (brown) indicates lower than average effective migration areas.
Fig 2
Fig 2. f3 outgroup results of the target populations.
Only the top three hits are shown. The f3 outgroup was calculated for the Eurasian-like ancestry for each target population in the following manner: Target | Source | Ju|’hoansi.
Fig 3
Fig 3. Admixture dating in generation for the Eurasian-like ancestry from MOSAIC.
A and D contain data for the best source as determined by f3 whilst B and E illustrate the dataset determined by the best on R2 value. A and B are the admixture date in generations, C is the target population locations, and D and E are the same data but plotted over the study area surface using Kriging interpolation. The numbers here represent the major breaks (black lines). Note that some populations did not find a Eurasian source in the best by R2 runs and thus do not have a date.
Fig 4
Fig 4. Dot plot representations of the admixture dating in generation for the most Eurasian-like ancestry from MOSAIC.
A and C contain data for the best source as determined by f3 whilst B and D illustrate the dataset determined by the best on R2 value. A and B are per smaller linguistic classifications whilst C and D show the same data but are divided into linguistic families. The red triangle represents the mean value.
Fig 5
Fig 5. Correlation between dates from the two approaches.
Linear regression (blue line) comparing the admixture dates of the Eurasian-like ancestry from the best by f3 to the best by R2 dataset. The grey area represents the 95% confidence interval. The black line is X = Y, i.e. same date in both approaches.

Similar articles

Cited by

References

    1. Johanson D, Edey M. How our olders human acestor was discovered—and who she was. Simon & Schuster; 1990.
    1. McDougall I, Brown FH, Fleagle JG. Stratigraphic placement and age of modern humans from Kibish, Ethiopia. Nature. 2005;433(7027):733–736. doi: 10.1038/nature03258 - DOI - PubMed
    1. Vidal CM, Lane CS, Asrat A, Barfod DN, Mark DF, Tomlinson EL, et al. Age of the oldest known Homo sapiens from eastern Africa. Nature. 2022;601(7894):579–583. doi: 10.1038/s41586-021-04275-8 - DOI - PMC - PubMed
    1. Pagani L, Kivisild T, Tarekegn A, Ekong R, Plaster C, Gallego Romero I, et al. Ethiopian genetic diversity reveals linguistic stratification and complex influences on the Ethiopian gene pool. American journal of human genetics. 2012;91(1):83–96. doi: 10.1016/j.ajhg.2012.05.015 - DOI - PMC - PubMed
    1. Prendergast ME, Lipson M, Sawchuk EA, Olalde I, Ogola CA, Rohland N, et al. Ancient DNA reveals a multistep spread of the first herders into sub-Saharan Africa. Science (New York, NY). 2019;365(6448):eaaw6275. doi: 10.1126/science.aaw6275 - DOI - PMC - PubMed

Publication types