. 2023 Nov 10;9(45):eadi9834.
doi: 10.1126/sciadv.adi9834. Epub 2023 Nov 8.

A human urothelial microtissue model reveals shared colonization and survival strategies between uropathogens and commensals

Affiliations

A human urothelial microtissue model reveals shared colonization and survival strategies between uropathogens and commensals

Carlos Flores et al. Sci Adv. .

Abstract

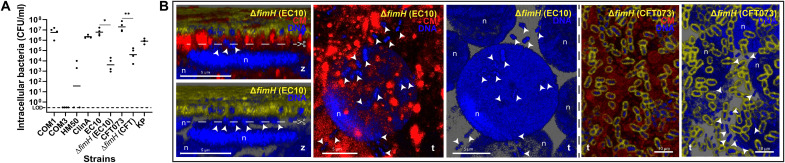
Urinary tract infection is among the most common infections worldwide, typically studied in animals and cell lines with limited uropathogenic strains. Here, we assessed diverse bacterial species in a human urothelial microtissue model exhibiting full stratification, differentiation, innate epithelial responses, and urine tolerance. Several uropathogens invaded intracellularly, but also commensal Escherichia coli, suggesting that invasion is a shared survival strategy, not solely a virulence hallmark. The E. coli adhesin FimH was required for intracellular bacterial community formation, but not for invasion. Other shared lifestyles included filamentation (Gram-negatives), chaining (Gram-positives), and hijacking of exfoliating cells, while biofilm-like aggregates were formed mainly with Pseudomonas and Proteus. Urothelial cells expelled invasive bacteria in Rab-/LC3-decorated structures, while highly cytotoxic/invasive uropathogens, but not commensals, disrupted host barrier function and strongly induced exfoliation and cytokine production. Overall, this work highlights diverse species-/strain-specific infection strategies and corresponding host responses in a human urothelial microenvironment, providing insights at the microtissue, cell, and molecular level.


Figures

Fig. 1.
Fig. 1.. UPEC infection in the human urothelial model 3D-UHU.
(A) Schematic representation of 3D-UHU development and staining for extracellular versus intracellular bacteria. Ab, antibody. (B) 3D view of uninfected model. (C) 3D views after 12 hpi with UPEC CFT073 and UTI89 (in yellow). (D) Invasion and IBC formation (dashed lines) by UPEC CFT073 (left), UTI89 (middle), and EC10 (right), 12 hpi at an MOI of 50. Arrowheads depict intracellular unaggregated UTI89. (E) UPEC IBC eruption at 12 hpi and MOI of 50. Dotted lines depict pod-like structures exposing EC10, and sprouting filaments can be observed for UTI89. t, top-down view; z, side view. Yellow, extracellular bacteria; blue, DNA of host nuclei (n) and bacteria (intracellular and extracellular); red, F-actin or cell membrane (CM). Confocal [(B) to (D) and (E), left] and scanning electron microscopy (SEM) [(E), right] images representative of a minimum of four independent biological replicates per strain (N ≥ 4).
Fig. 2.
Fig. 2.. Bacterial invasion and UPEC ∆fimH phenotypes.
(A) Intracellular bacteria quantified by gentamicin protection assay 12 hpi with nonpathogenic E. coli (COM1, COM3, and HM50), UPEC (ClinA, EC10, CFT073, and respective ∆fimH mutants), and KP at an MOI of 100 [limit of detection (LOD) = 0 CFU/ml]. Data plotted as mean of four independent biological replicates (N = 4), **P < 0.01; *P < 0.1. (B) Invasion without IBC formation by ∆fimH in EC10 and CFT073 backgrounds (arrowheads). Scissors depict the position of cross sections for the side views for ∆fimH EC10 in the adjacent panels. Staining as in Fig. 1. Confocal images representative of a minimum of four independent biological replicates per strain (N ≥ 4).
Fig. 3.
Fig. 3.. Bacterial effect on 3D-UHU tissue integrity.
(A) 3D-UHU barrier function assessed by fluorescein isothiocyanate (FITC)–dextran (4 kDa) permeability assay before/after infection. Relative fluorescence units (RFU) were measured in basal chambers over 24 hours; data plotted as means ± SE of biological quadruplicates (N = 4). Inset compares the final time point. ****P < 0.0001; ***P < 0.001. (B) Cytotoxicity caused by the uropathogens and non-UPEC used in this study, 12 hpi, as assessed by lactate dehydrogenase (LDH) release assay. Data plotted as means ± SE of biological triplicates (N = 3). ****P < 0.0001; ***P < 0.001; *P < 0.1.
Fig. 4.
Fig. 4.. Non-UPEC colonization strategies and morphology in 3D-UHU.
(A) Invasion by commensals at 12 hpi, COM1, with IBC formation (dashed lines), and COM5, isolated intracellularly (arrowheads). Staining as in Fig. 1. (B) Size distribution of E. coli at 12 hpi. Black lines, means of rod (dark gray) and filament (light gray) sizes; pie charts, proportion of each group in N = 1000 bacteria per strain. (C) Filamentation by commensal E. coli COM2, COM3, COM4, and COM5 accompanied by bacterial membrane vesiculation (bv) and fusiform nuclei (*) at 12 hpi. (D) Adhesion by COM2, HM50, and COM4 to the underside of exfoliating cells. Dotted lines depict the edge of cell with HM50 underneath (arrows). Bottom right: COM1 surrounding a dying cell. Confocal [(A), (C), and (D), top right] and SEM [(D), left and bottom] images representative of a minimum of four independent biological replicates per strain (N ≥ 4).
Fig. 5.
Fig. 5.. Effect of non-UPEC uropathogens on 3D-UHU permeability and infection by Gram-positive uropathogens.
(A) 3D-UHU barrier function after infection with non-UPEC uropathogens, assessed by FITC-dextran (4 kDa) permeability assay. Fluorescence measured in basal chambers over 24 hours. Data plotted as means ± SE of biological triplicates (N = 3; ****P < 0.0001; **P < 0.01). (B) SA in discrete regions of the urothelial surface and associated with damaged upper cell host membranes (bottom). Cocci invasion (arrowhead at right uppermost panel) and chains underneath upper cell layers (middle, dotted lines). Scissors depict the place of cross sections for the side views in the adjacent bottom panels. (’) represents images without the red channel. (C) EF spread on the urothelial surface and chains translocating between the upper cell layers (bottom, dotted lines). Heavily colonized umbrella cells being exfoliated (right uppermost) and cocci erupting from a vesicle-like structure and urothelial cell (right bottom). Staining as Fig. 1. Confocal [(B), top and middle, and (C), left] and SEM [(B), middle right and bottom, and (C), right] images representative of a minimum of four independent biological replicates per strain (N ≥ 4).
Fig. 6.
Fig. 6.. Invasion and biofilm formation by Gram-negative non-UPEC uropathogens in the 3D-UHU.
(A) KP infection. Bacteria scattered on the urothelial surface (at 3 and 12 hpi); membrane ruffling and spike-like structures surrounding KP. Dashed lines depict IBCs (middle); arrowhead depicts possible eruption (bottom right). Staining as in Fig. 1. (’) represents images without the red channel. (B) PA infection. Formation of biofilm-like aggregates, incorporating cell debris, and precipitates (bottom SEM images). Violin plot showing decrease in bacteria length over course of infection (N = 1100 bacteria per time point; ****P < 0.0001). Arrowheads in bottom panels depict intracellular bacteria. (C) PM infection. Rods, chains, and/or elongated forms on 3D-UHU surface (top), inside a cross section of intermediate cell layers (IC), inside umbrella cells (bottom left), and penetrating paracellularly in inflamed urothelium while forming interjunctional biofilms with crystalline precipitates (*) (right and bottom SEM images). Confocal [(A), left and middle; (B), top; and (C), left top and middle] and SEM [(A), right; (B), bottom; and (C), right and bottom] images representative of a minimum of four independent biological replicates per strain (N ≥ 4).
Fig. 7.
Fig. 7.. Host responses to uropathogens and commensals.
(A) Membrane ruffling and formation of blebs/vesicle-like structures (*) by umbrella cells 12 hpi with CFT073 (left) and UTI89 (right). Staining as in Fig. 1. (B) Expelled CFT073 in exosome-like structures decorated with LC3 (top) and Rab27a (bottom). a to d depict different encasement patterns suggesting bacterial release either through elongation or case degradation (schematics above the images). (C) Host cell exfoliation 12 hpi with uropathogens and nonuropathogenic bacteria, and exfoliated cell with intracellular COM1 (arrowheads on images below). Staining as in Fig. 1. Scissors depict cross-sectional placement for the side view, shown at bottom. Data plotted as means ± SE of biological quadruplicates (N = 4); ****P < 0.0001; ***P < 0.001; *P < 0.1. (D) Cytokine (IL-1α, IL-1β, G-CSF, and RANTES) production by 3D-UHU 12 hpi. Fold changes compared to uninfected controls (dashed line) plotted as means ± SE of biological triplicates (N = 3); ****P < 0.0001. Confocal [(A), left, (B), and (C)] and SEM [(A), right] images representative of a minimum of four independent biological replicates per strain (N ≥ 4).

Comment in

References

    1. F. M. E. Wagenlehner, T. E. Bjerklund Johansen, T. Cai, B. Koves, J. Kranz, A. Pilatz, Z. Tandogdu, Epidemiology, definition and treatment of complicated urinary tract infections. Nat. Rev. Urol. 17, 586–600 (2020). - PubMed
    1. World Health Organization, Global Report on Infection Prevention and Control (World Health Organization, 2022).
    1. Antimicrobial Resistance Collaborators , Global burden of bacterial antimicrobial resistance in 2019: A systematic analysis. Lancet 399, 629–655 (2022). - PMC - PubMed
    1. A. L. Flores-Mireles, J. N. Walker, M. Caparon, S. J. Hultgren, Urinary tract infections: Epidemiology, mechanisms of infection and treatment options. Nat. Rev. Microbiol. 13, 269–284 (2015). - PMC - PubMed
    1. D. A. Hunstad, S. S. Justice, Intracellular lifestyles and immune evasion strategies of uropathogenic Escherichia coli. Annu. Rev. Microbiol. 64, 203–221 (2010). - PubMed

MeSH terms

Substances