. 2023 Nov 21;4(11):101264.
doi: 10.1016/j.xcrm.2023.101264. Epub 2023 Nov 7.

Targeting the TCA cycle through cuproptosis confers synthetic lethality on ARID1A-deficient hepatocellular carcinoma

Affiliations

Targeting the TCA cycle through cuproptosis confers synthetic lethality on ARID1A-deficient hepatocellular carcinoma

Tao Xing et al. Cell Rep Med. .

Abstract

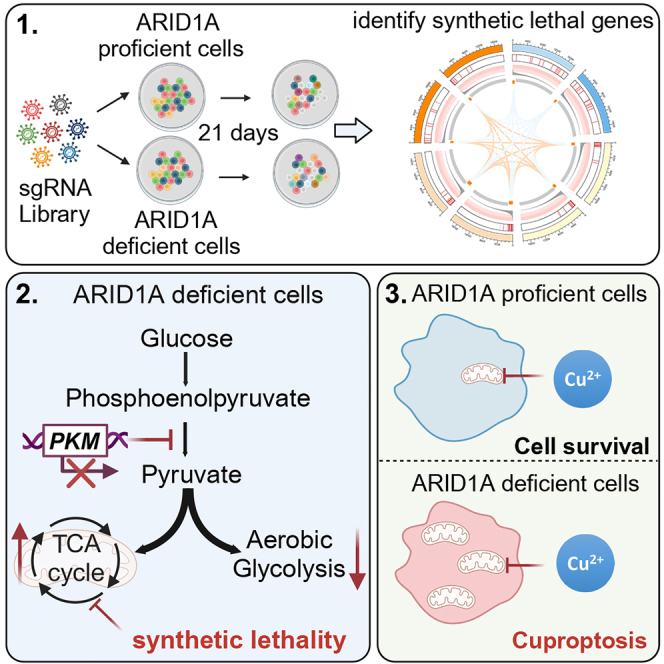
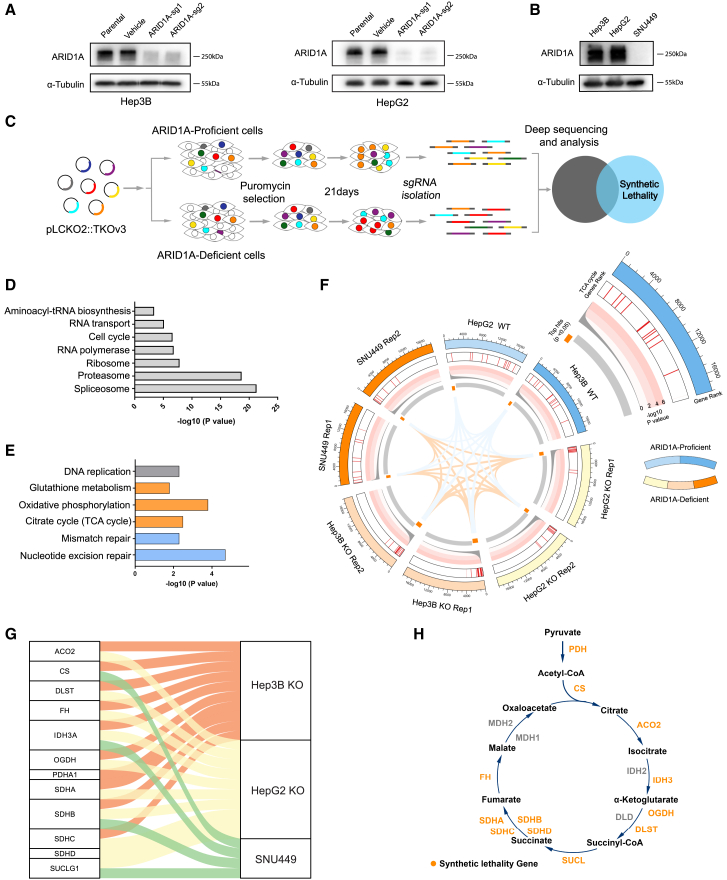
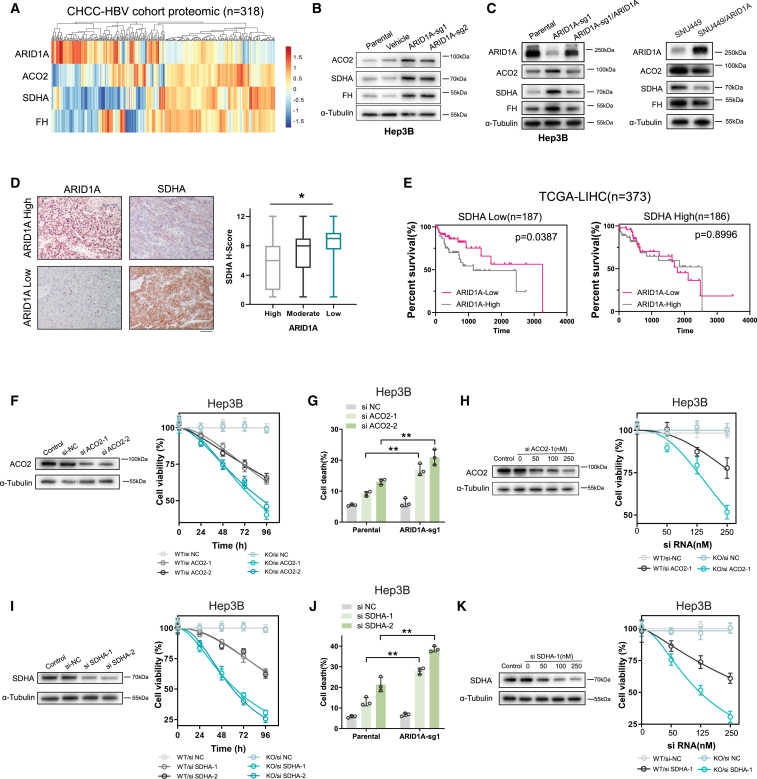
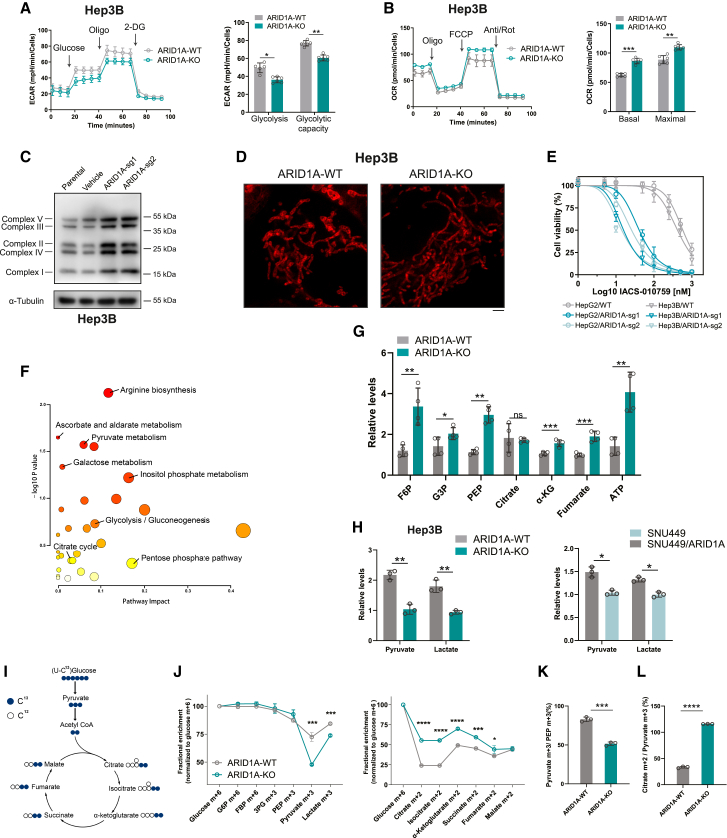
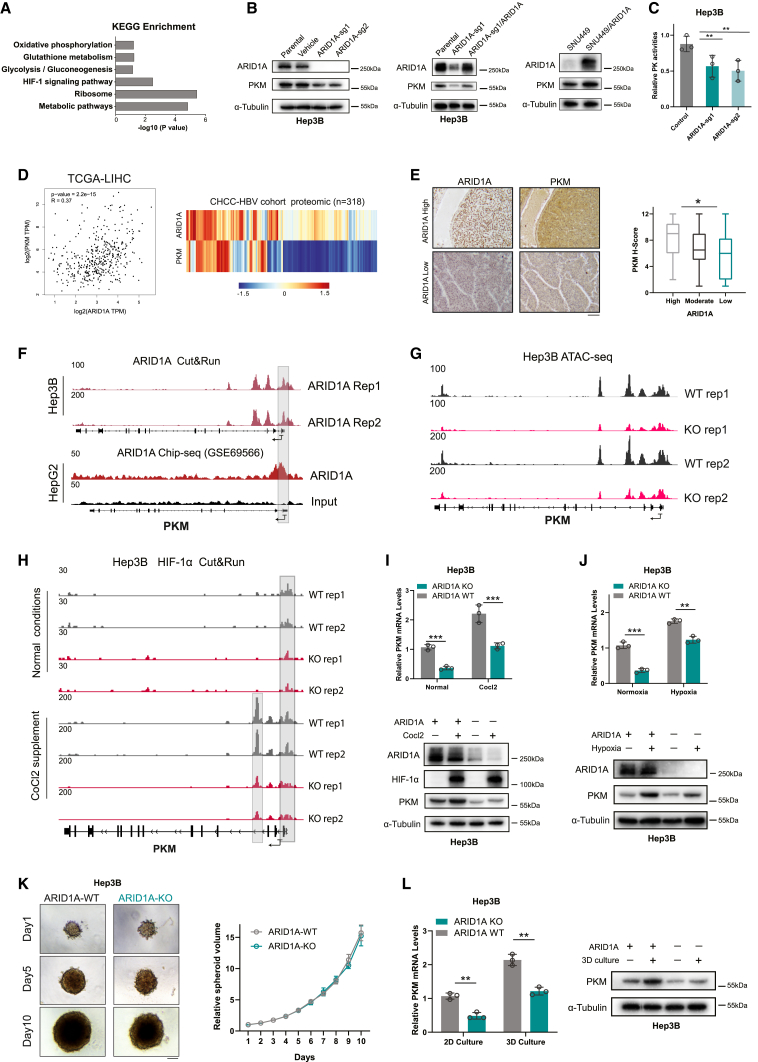
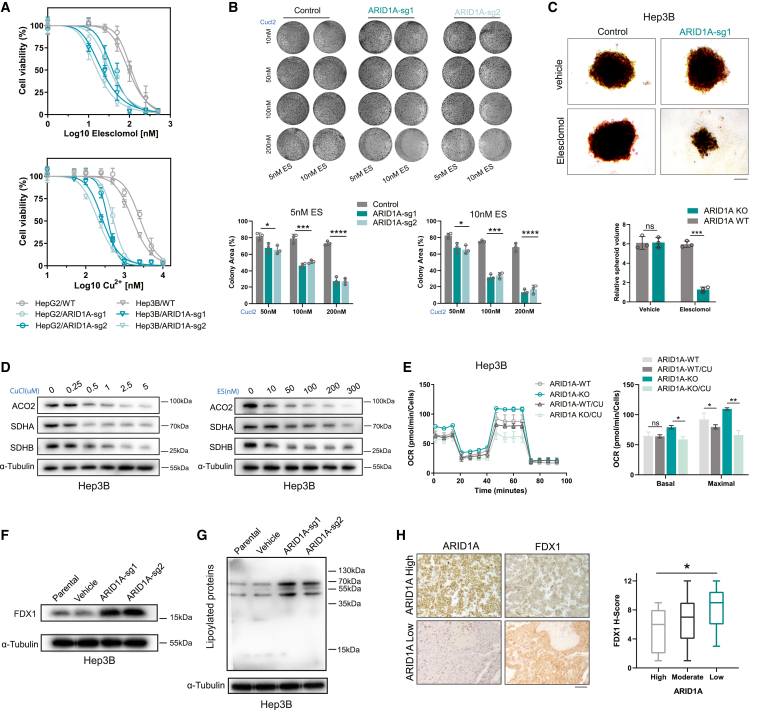
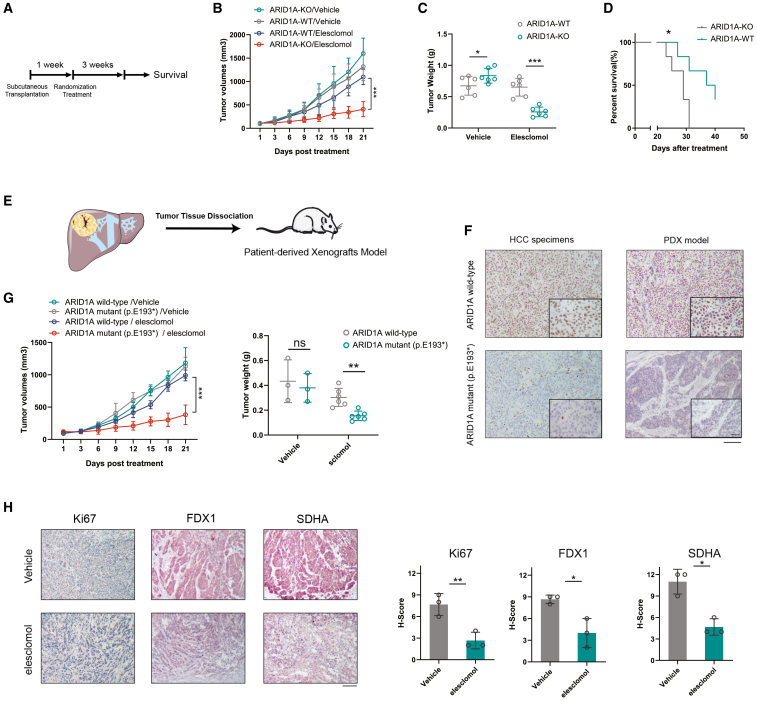
ARID1A is among the most commonly mutated tumor suppressor genes in hepatocellular carcinoma (HCC). In this study, we conduct a CRISPR-Cas9 synthetic lethality screen using ARID1A-deficient HCC cells to identify approaches to treat HCC patients harboring ARID1A deficiency. This strategy reveals that the survival of these ARID1A-deficient HCC cells is highly dependent on genes related to the tricarboxylic acid (TCA) cycle. Mechanistically, ARID1A loss represses expression of key glycolysis-related gene PKM, shifting cellular glucose metabolism from aerobic glycolysis to dependence on the TCA cycle and oxidative phosphorylation. Cuproptosis is a recently defined form of copper-induced cell death reported to directly target the TCA cycle. Here, we find that ARID1A-deficient HCC cells and xenograft tumors are highly sensitive to copper treatment. Together, these results offer evidence of the synthetic lethality between ARID1A deficiency and mitochondrial respiration impairment, suggesting that copper treatment constitutes a promising therapeutic strategy for selectively targeting ARID1A-deficient HCC.


Conflict of interest statement

Declaration of interests All the authors declare no competing interests.

Figures

None
Graphical abstract
Figure 1
Figure 1
Genome-wide CRISPR screening identified a synthetic lethal interaction between ARID1A and the TCA cycle (A) ARID1A-KO in Hep3B cells and HepG2 cell, as evaluated by immunoblotting. (B) Immunoblot analysis of ARID1A in three HCC cell lines demonstrating the loss of ARID1A protein expression in SNU449 cells. (C) CRISPR-Cas9 screening flowchart used in this study. (D and E) KEGG enrichment analysis of key cellular activity genes (D) and synthetic lethal genes (E). (F) Circos plots showing the CRISPR screen results. The outermost rim shows the rank of each gene in the screening results; significant screened hits are ranked on the innermost rim (p < 0.05). Heatmap indicating the location of synthetic lethal TCA-related genes in the gene ranking list. The line plots show the −log10 p values for the corresponding genes. (G) A Sankey plot was used to demonstrate the connection of synthetic lethal TCA-related genes with the screening groups. (H) Schematic of TCA cycle modules and the locations of synthetic lethal genes.
Figure 2
Figure 2
ARID1A deficiency generated dependence on the TCA cycle-related genes in HCC (A) A heatmap showing the protein levels of ARID1A, ACO2, SDHA, and FH in samples from HCC patients in CHCC-HBV database (n = 318). (B and C) The protein expression levels of ARID1A and ACO2, SDHA, and FH were measured by immunoblotting in cells characterized by ARID1A deficiency and proficiency. (D) HCC specimens from 102 patients were subjected to IHC staining for ARID1A and SDHA; expression was scored by two pathologists. The results suggested a strong correlation between ARID1A and SDHA expression. Scale bar, 100 μm. (E) Kaplan-Meier curves demonstrating that low ARID1A and SDHA mRNA expression levels were correlated with better prognosis in HCC patients in the TCGA cohort. (F and I) Silencing of ACO2 (F) or SDHA (I) expression in Hep3B cells by siRNA. α-Tubulin was used as the loading control. The assessment of relative cell viability rates was conducted following the transfection of siRNA in both parental and ARID1A-KO (sg1) Hep3B cells (mean ± SD; n = 6 independent experiments). (G and J) Cell death rates were determined after treatment with ACO2 (G) or SDHA (J) siRNA in parental and ARID1A-KO Hep3B cells (mean ± SD; n = 3 independent experiments). (H and K) Western blot results demonstrating efficient downregulation of ACO2 (H) or SDHA (K) after transfection of various concentrations of siRNA. The relative cell viability rates were assessed subsequent to transfection with varying concentrations of siRNA in parental and ARID1A-KO (sg1) Hep3B cells (mean ± SD; n = 6 independent experiments).
Figure 3
Figure 3
ARID1A deficiency reprogrammed glucose metabolism from glycolysis to the TCA cycle (A) Representative traces of extracellular acidification rate (ECAR) values obtained from a glycolytic stress test showing reduced glycolysis and glycolytic capacity in ARID1A-KO (sg1) Hep3B cells (mean ± SD; n = 6 independent experiments). (B) Representative traces of oxygen consumption rate (OCR) values obtained from a mitochondrial stress test, indicating increased basal respiration and maximal respiration rates in ARID1A-KO (sg1) Hep3B cells (mean ± SD; n = 6 independent experiments). (C) The expression of OXPHOS protein levels was evaluated in both parental and ARID1A-KO Hep3B cells, utilizing the Total OXPHOS antibody cocktail. (D) Representative mitochondrial images of ARID1A WT and ARID1A-KO (sg1) Hep3B cells stained with mitochondrial marker. Scale bar, 2 μm. (E) Cell viability analyses were conducted on the specified cells subsequent to a 3-day treatment with IACS-010759 (mean ± SD; n = 6 independent experiments). (F) MSEA demonstrating the differential metabolic pathways in ARID1A-KO (sg1) Hep3B cells. (G) Different levels of glycolysis intermediates and TCA cycle intermediates in parental and ARID1A-KO (sg1) Hep3B cells (mean ± SD; n = 4 independent experiments). (H) Different levels of pyruvate and lactate were measured by quantitative kit in cells characterized by ARID1A deficiency and proficiency (mean ± SD; n = 3 independent experiments). (I) Schematic representation of 13C-labeled glucose metabolism. (J) Fractional enrichment (normalized to glucose m + 6) of glycolytic intermediates and TCA intermediates in parental and ARID1A-KO (sg1) Hep3B cells (mean ± SD; n = 3 independent experiments). (K and L) Decreased pyruvate m + 3/PEP m + 3 ratio (K) and increased citrate m + 2/pyruvate m + 3 ratio (L) in ARID1A-KO (sg1) Hep3B cells (mean ± SD; n = 3 independent experiments).
Figure 4
Figure 4
ARID1A deficiency suppressed glycolysis by decreasing PKM transcription (A) KEGG enrichment analysis of genes with significantly altered expression in ARID1A-knockdown HepG2 cells. (B) Indicated cells were examined for expression of ARID1A and PKM by immunoblot. (C) Measurement of PK activity in ARID1A-KO and control Hep3B cells (mean ± SD; n = 3 independent experiments). (D) The mRNA and protein level of PKM was positively correlated with that of ARID1A in the public HCC dataset. (E) Representative images and quantitation of immunostaining for ARID1A and PKM in HCC specimen sections (n = 102). Scale bar, 100 μm. (F and G) Representative browser track of CUT&RUN or ChIP-seq (F) and ATAC-seq (G) on the PKM locus in indicated cells. (H) Representative Integrative Genomics Viewer (IGV) tracks of the peak signals in HIF-1α CUT&RUN peaks at the PKM genomic locus. (I and J) Quantitative PCR (qPCR) and immunoblot analysis revealed more pronounced PKM upregulation in WT cells than in ARID1A-KO (sg1) cells under CoCl2 stimulation (I) or hypoxia condition (J) (mean ± SD; n = 3 independent experiments). (K) Alterations in spheroid volume were monitored over a span of 10 days for spheroids derived from ARID1A-KO (sg1) and control Hep3B cells (mean ± SD; n = 3 independent experiments). Scale bar, 50 μm. (L) qPCR and immunoblot analysis show a more conspicuous upregulation of PKM in WT Hep3B cells compared to ARID1A-KO (sg1) cells within the context of 3D culture system (mean ± SD; n = 3 independent experiments).
Figure 5
Figure 5
ARID1A deficiency sensitized cells to cuproptosis in vitro (A) Cell viability of indicated cells after treatment with increasing concentrations of elesclomol (with 1 μM CuCl2 in medium) or CuCl2 (with 10 nM elesclomol in medium) (mean ± SD; n = 6 independent experiments). (B) Colony formation assay of HepG2 cells treated with different concentrations of elesclomol and CuCl2 for 10–15 days (mean ± SD; n = 3 independent experiments). (C) Longitudinal changes in the volume of spheroids formed from ARID1A-KO (sg1) and control Hep3B cells under elesclomol or vehicle (with 1 μM CuCl2 in medium) treatment (mean ± SD; n = 3 independent experiments). Scale bar, 50 μm. (D) ACO2, SDHA, and SDHB protein levels after treatment with different concentrations of elesclomol (with 1 μM CuCl2 in medium) or CuCl2 (with 25 nM elesclomol in medium). (E) Representative traces of OCR values after treatment with 10 nM elesclomol (with 1 mM CuCl2 in medium) indicating decreased basal respiration and maximal respiration rates in ARID1A-KO (sg1) Hep3B cells (mean ± SD; n = 6 independent experiments). (F and G) Immunoblotting revealed significant FDX1 (F) and lipoylated proteins (G) upregulation in ARID1A-KO HCC cells. (H) Images of FDX1 and ARID1A IHC staining in HCC specimen sections (n = 102). Scale bar, 100 μm.
Figure 6
Figure 6
Clinically applicable elesclomol was effective in ARID1A-deficient HCC (A) Schematic representation of the experimental design and reference time of the CDX model experiment. (B and C) Longitudinal variations in tumor volume (B) and the ultimate tumor weight measurements (C) were examined in mice treated with elesclomol or vehicle controls (mean ± SD; n = 6 independent experiments). (D) After treatment cessation, mice from the elesclomol treatment groups were followed for survival analysis by the Kaplan-Meier method (n = 6 independent experiments). (E) Schematic representation of the experimental design of the PDX model experiment. (F) The expression of ARID1A in ARID1A WT and ARID1A mutant HCC specimens and PDX models. Scale bar, 100 μm. ARID1A enlarged, 25 μm. (G) Tumor volumes and weights of mice bearing tumors of PDX models treated with elesclomol or vehicle controls. (H) Representative images of Ki67, SDHA, and FDX1 staining in PDX tumor samples harvested from mice in the vehicle and elesclomol treatment groups. The H-score was then quantified (mean ± SD; n = 6 independent experiments). Scale bar, 100 μm.

Similar articles

Cited by

References

    1. Bray F., Ferlay J., Soerjomataram I., Siegel R.L., Torre L.A., Jemal A. Global cancer statistics 2018: GLOBOCAN estimates of incidence and mortality worldwide for 36 cancers in 185 countries. CA. Cancer J. Clin. 2018;68:394–424. doi: 10.3322/caac.21492. - DOI - PubMed
    1. Llovet J.M., Zucman-Rossi J., Pikarsky E., Sangro B., Schwartz M., Sherman M., Gores G. Hepatocellular carcinoma. Nat. Rev. Dis. Primers. 2016;2 doi: 10.1038/nrdp.2016.18. - DOI - PubMed
    1. Hilmi M., Neuzillet C., Calderaro J., Lafdil F., Pawlotsky J.M., Rousseau B. Angiogenesis and immune checkpoint inhibitors as therapies for hepatocellular carcinoma: current knowledge and future research directions. J. Immunother. Cancer. 2019;7:333. doi: 10.1186/s40425-019-0824-5. - DOI - PMC - PubMed
    1. Guichard C., Amaddeo G., Imbeaud S., Ladeiro Y., Pelletier L., Maad I.B., Calderaro J., Bioulac-Sage P., Letexier M., Degos F., et al. Integrated analysis of somatic mutations and focal copy-number changes identifies key genes and pathways in hepatocellular carcinoma. Nat. Genet. 2012;44:694–698. doi: 10.1038/ng.2256. - DOI - PMC - PubMed
    1. Kaelin W.G., Jr. The concept of synthetic lethality in the context of anticancer therapy. Nat. Rev. Cancer. 2005;5:689–698. doi: 10.1038/nrc1691. - DOI - PubMed

Publication types

MeSH terms